2022 Interim Results Presentation - August 2022 - JS global life

Page created by Ray Marsh
 
CONTINUE READING
2022 Interim Results Presentation - August 2022 - JS global life
2022 Interim Results Presentation

August 2022
2022 Interim Results Presentation - August 2022 - JS global life
Disclaimer

Potential investors, analysts and shareholders of JS Global Lifestyle Company Limited (the “Company”) and other recipients of this document are reminded that this document
and any oral discussion made together with this document are provided for your information purposes only and you may not forward, publish, distribute, release or disseminate
any part of the presentation directly or indirectly to any other person.

This presentation and subsequent discussions may contain forward-looking statements that involve risks and uncertainties. These statements are generally indicated by the use
of forward-looking terminology such as believe, expect, anticipate, estimate, plan, project, target, may or will, or may be expressed as being the results of actions that may or are
expected to occur in the future. You should not place undue reliance on these forward-looking statements, which reflect our belief only as of the date of this presentation. These
forward-looking statements are based on our own information and on information from other sources we believe to be reliable.

It is important to note that the contents of the presentation have not been audited or independently verified. We do not make, and expressly disclaim, any representations and
warranties in respect of any matters contained in the presentation. We cannot provide any assurance that the information contained in the presentation is or will be accurate or
complete and so they should not be relied on. We assume no liability whatsoever for any loss howsoever arising from use of, or in connection with, any of the information and data
contained in this presentation.

This presentation is not, and is not intended to be, for publication, distribution, release or dissemination, directly or indirectly, in or into any other jurisdiction which to do so would
be restricted, unlawful or a breach of a legal or regulatory requirement.
This presentation does not constitute a public offer for the purposes of any applicable law or an offer to sell or solicitation of any offer to purchase any securities or other financial
instruments or any recommendation in respect of such securities or instruments.

By attending or reading this presentation, you will be deemed to have agreed to the terms, obligations and restrictions set out herein.

                                                                                                                                                                                               1
2022 Interim Results Presentation - August 2022 - JS global life
Table of contents

 1   1H 2022 Financials Update   3

 2    1H 2022 Business Update    11

 3    ESG                        32

 4    Strategy and Outlook       36

                                      2
2022 Interim Results Presentation - August 2022 - JS global life
1. 1H 2022 Financials Update

                               3
2022 Interim Results Presentation - August 2022 - JS global life
1H 2022 Key financial metrics

Unit: USD mn

                                Revenue                                                                                                                                          Gross profit and margin

                                                                                                        Revenue in 1H                                                                            40.6%                 38.6%     Gross profit in 1H
                                                   2,239
                                                                                                            2022                                                                                                                       2022
                                                                             2,232
                                                                                                    USD 2,232mn                                                                                    908                   862      USD 862mn
                                                                                                               -0.3%                                                                                                                    -5.1%

                                                 1H 2021                   1H 2022
                                                                                                                                                                                                1H 2021                1H 2022

                                Revenue (constant currency)                                                                                                                      Adjusted EBITDA and margin(1)

                                                                                                    Revenue (cc) in 1H                                                                           15.7%                 14.3%     Adj. EBITDA in 1H
                                                  2,239                     2,256
                                                                                                          2022                                                                                                                          2022
                                                                                                                                                                                                   351
                                                                                                    USD 2,256mn                                                                                                          318
                                                                                                                                                                                                                                  USD 318mn
                                                                                                               +0.8%                                                                                                                    -9.2%

                                                 1H 2021                   1H 2022
                                                                                                                                                                                                1H 2021                1H 2022

                                Earnings per share (cents)                                                                                                                       Adjusted net profit and margin(2)

                                                                                                                                                                                                 10.8%                  9.3%
                                                                                                                                                                                                                                 Adj. net profit in 1H
                                                                                                       EPS in 1H 2022
                                                                                                                                                                                                                                        2022
                                                    5.7
                                                                                                    USD4.8cents                                                                                    242
                                                                                                                                                                                                                        207
                                                                                                                                                                                                                                  USD 207mn
                                                                              4.8                             -15.8%
                                                                                                                                                                                                                                       -14.4%

                                                                                                                                                                                                1H 2021                1H 2022
                                                 1H 2021                   1H 2022

(1)    Adjustments for EBITDA included stock-based compensation and tariff refunds in Q4 2021. The adjusted EBITDA was non-audited number.
(2)    Adjustments for net income included amortization of intangible assets arising from acquisition of SN, stock-based compensation and tariff refunds in Q4 2021. The adjusted net income was non-audited number.
                                                                                                                                                                                                                                                         4
2022 Interim Results Presentation - August 2022 - JS global life
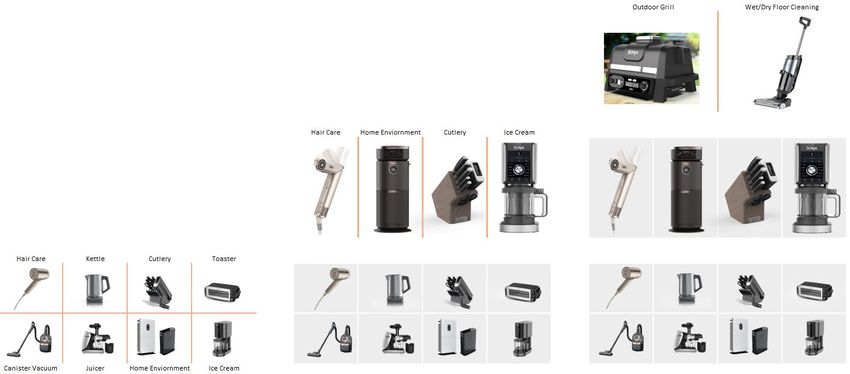
Revenue stable despite challenging YoY comps and macro environment

By segment
                                                                                                                   The SharkNinja segment achieved growth of 1.2%
(USD mn)                                              With                                                          to $1.615 billion on a constant currency basis in
                                                    Constant                                                        the first half of 2022. While SharkNinja has
                                                    Currency
                                                                                            YoY      YoY (cc)       already achieved extraordinary performance in 1H
                                                                                                                    2021, its market share kept increasing in 1H 2022,
           2,239                  2,232                 2,256                                                       which was attributable to its development strategy
                                                                         Total:              -0.3%     +0.8%
                                                                                                                    to keep exploring new opportunities in both
                                                                                                                    existing and new markets along with the
            1,596                  1,593                1,615                                                       successful launch of products into new categories.
                                                                        SharkNinja:          -0.2%    +1.2%

             643                   639                   641                                                       Revenue from the Joyoung segment fell slightly
                                                                         Joyoung:            -0.6%     -0.3%        by 0.6% year-on-year, mainly due to the
           1H 2021             1H 2022        1H 2022 (Constant                                                     slowdown of China’s economic growth in Q2 2022
                                                  Currency)                                                         and the slow recovery of consumer demand.
                     Joyoung               SharkNinja                                                               However, after the launch of new products with
                                                                                                                    cutting-edge technology and healthy concept in
              1H2021 Revenue by segment                                      1H2022 Revenue by segment              Q2 2022, Joyoung achieved superior market
                                                                                                                    performance compared with peers in the air fryer,
                                                                                                                    rice cooker, high speed blender and other sectors.

                                  28.7%                                                    28.6%

                          71.3%                                                    71.4%

                                           Revenue contribution by segment
                                                   remains stable

                                                                                                                                                                         5
2022 Interim Results Presentation - August 2022 - JS global life
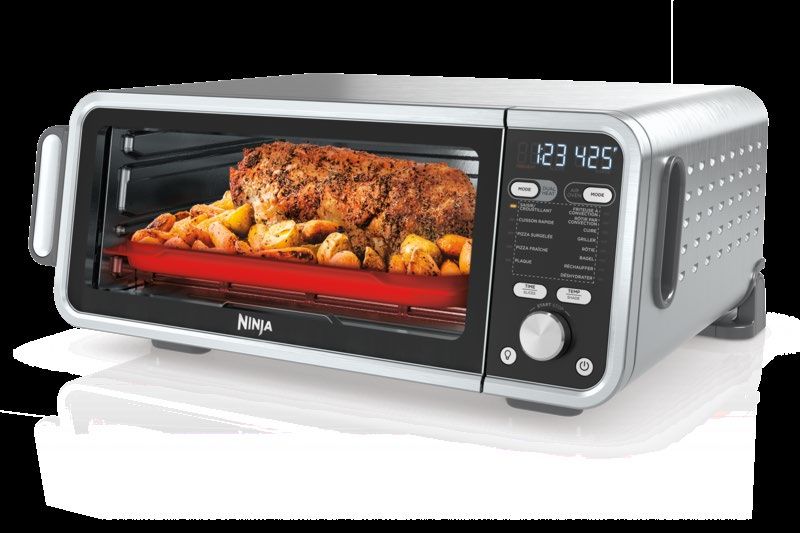
Continued market share gains across different markets

By region            (USD mn)
                                                                                                                                                      Regionally, although the North American
                                                                           With                                                                        market is facing a historically high level of
                                                                         Constant                                      YoY            YoY (cc)
                                                                                                                                                       inflation, we have continuously executed
                                                                         Currency
                                                                                            Total:                    -0.3%            +0.8%           effective business strategies and launched
                                                                                                                                                       new products that are popular among
        2,239                             2,232                          2,256              Other Markets(1):         +28.5%          +36.1%           consumers, which helped us to achieve a
                         72                                92
            280                               264                           280
                                                                                       97                                                              continuous increase in market share.
                                                                                            Europe(2):                 -5.8%             0.1%
            627
                                                                                                                                                       Revenue from the North American market
                                              623                           625
                                                                                            China:                     -0.6%                           declined slightly by 0.6% in 1H 2022.
                                                                                                                                        -0.3%
           1,261                             1,254                         1,254            North America:             -0.6%            -0.6%         The European market was mainly affected by
                                                                                                                                                       the uncertain geopolitical situation and the
                                                                                                                                                       unfavorable exchange rate factors such as
        1H 2021                           1H 2022                   1H 2022 (constant
                                                                        currency)                                                                      the depreciation of the British pound and the
                                                                                                                                                       euro against the U.S. dollar. Revenue in the
           North America              China           Europe           Other Markets
                                                                                                                                                       European region kept stable year-on-year on
                                                                                                                                                       a constant currency basis.
                         1H 2021 Revenue by region                                                1H 2022 Revenue by region
                                            Other                                                                 Other                               Total revenue generated from China saw a
                                           Markets                                                               Markets                               slight year-on-year drop of approximately
                                            3.2%                                                                 4.1%
                              Europe                                                                 Europe
                                                                                                                                                       0.6%. Total revenue generated from other
                                   12.5%
                                                                                                          11.8%                                        markets achieved an extraordinary year-on-
                                                                                                                                                       year growth of 36.1% under constant currency.

                                   28.0%                   56.3%                                                           56.2%
                                                                                                         27.9%
                                                                   North America                                                   North America
                          China                                                                   China

(1)    Other markets including Japan, Australia, etc.
(2)    Europe including UK, Germany, France, Italy, etc.                                                                                                                                               6
2022 Interim Results Presentation - August 2022 - JS global life
Cleaning and other categories saw revenue growth

By product category
                                                                                                               Stable revenue was achieved across Cooking,
(USD mn)                                                                           YoY                          Cleaning, and Food Preparation category in 1H
                 2,239                        2,232               Total:
                                                                                                                2022, especially driven by market share gains in
                   102                           116                                            -0.3%           kitchenware, coffee machine, cordless vacuum,
                                                                                                                and high-performance blender as well as air fryer
                   786                           769              Others:                      +13.4%           sector.

                   486                           473              Cooking appliances:           -2.2%          The revenue from others category achieved
                   865                           875
                                                                                                                year-on-year growth of 13.4%, mainly driven by
                                                                  Food prep:                    -2.7%           newly-launched products including air purifiers,
                                                                                                                hair dryers, and water purification products.
                 1H 2021                      1H 2022
                                                                  Cleaning appliances:         +1.1%
                   Cleaning appliances        Food prep
                   Cooking appliances:        Others

           1H 2021 Revenue by product category                 1H 2022 Revenue by product category

                           Others                                               Others

                      4.6%
                                                                            5.2%
                              38.7%
                                                                                   39.2%
                  35.0%                      Cleaning                                           Cleaning
     Cooking                                appliances     Cooking     34.4%
                                                                                               appliances
    appliances                                            appliances
                          21.7%
                                                                               21.2%

                         Food preparation                                   Food preparation
                           appliances                                         appliances
                                                                                                                                                                    7
2022 Interim Results Presentation - August 2022 - JS global life
Gross margin declined mainly due to freight cost reclassification

  Evolution of gross profit and margin

  (USD mn)
                                                                                                                             The gross margin for 1H2022 is 38.6% with a
                                                                                                                              decrease of 2.0 percentages year-on-year.
               37.4%                     43.7%(1)                        40.6%                         38.6%(2)

                                                                                                                             The decrease of 0.4 percentage point in gross
                                                                           908                                                profit margin was mainly resulted from higher
                                                                                                        862
                                                                                                                              commodity cost and unfavorable foreign
                                                                                                                              currency impact, partially offset by tariff
                                                                                                                              exclusions on certain goods imported from
                                             662
                                                                                                                              China to the U.S. which were announced on 23
                                                                                                                              Mar 2022.
               462
                                                                                                                             The remaining decrease of 1.6 percentage point
                                                                                                                              in gross profit margin was mainly due to the
                                                                                                                              recognition of some freight expenses into COGS.
                                                                                                                              Therefore, the gross profit margin post operating
                                                                                                                              adjustments in 1H 2022 was basically flat with
                                                                                                                              1H 2021.

             1H 2019                       1H 2020                       1H 2021                       1H 2022

                                                                    Gross margin

(1) The gross margin of 1H 2020 included tariff refund of $38.1m which was related to 2019. If not for such refund, the
gross margin would be 41.2% in 1H 2020.
(2) The gross margin of 1H 2022 included tariff refund of $19.0m which was related to 2021. If not for such refund, the
gross margin would be 37.8% in 1H 2022.
                                                                                                                                                                                  8
2022 Interim Results Presentation - August 2022 - JS global life
Sufficient working capital and healthy cash flow

Working capital management

Inventory turnover days(1)                                                                        Trade and bill receivables turnover days(2)                                                        Trade and bill payables turnover days(3)
(Days)                                                                                            (Days)                                                                                             (Days)

                                                                        108

                                             87                                                                  86                                                      85
                                                                                                                                             81                                                                                              107                         108
                 76
                                                                                                                                                                                                                  98

                2021                     1H 2021                     1H 2022                                    2021                     1H 2021                     1H 2022                                     2021                     1H 2021                     1H 2022

                                                                                                                                       JS Global

   Increase in inventory turnover days compared with Dec 2021 is primarily due to seasonality since the second half year sales are typically higher than the
  first half year, leading to higher inventory balance at the end of June. Accounts receivable days and accounts payable days in 1H 2022 remained generally
      stable compared to the full year of 2021 and the first half of 2021. The existing working capital is sufficient and the cash flow position is healthy. The
                                              company will continue to optimize and actively manage working capital.
(1)    Turnover days of average inventories equals average inventories divided by cost of sales and multiplied by the number of days in the period. Average inventories equal inventories at the beginning of the period plus inventories at the end of the period, divided by two.
(2)    Turnover days of average trade and bill receivables equals average trade and bill receivables divided by revenue and then multiplied by the number of days in the period. Average trade and bill receivables equal trade and bill receivables (net of impairment) at the beginning of the
       period plus trade and bill receivables at the end of the period, divided by two.
(3)    Turnover of average trade and bill payables equals average trade and bill payables divided by cost of sales and then multiplied by the number of days in the period. Average trade and bill payables equals trade and bill payables (net of impairment) at the beginning of the period
       plus trade and bill payables at the end of the period, divided by two.
                                                                                                                                                                                                                                                                                                   9
Balanced capital structure

    Capital expenditure                                                              Total debt / Total equity
       (USD mn)
                                                                                            0.7x
                                                           150
                               130
                                                                                                                 0.5x                                    0.5x
             95                                                                                                                           0.5x

                                                                         69

            2019              2020                         2021        1H 2022             2019                  2020                    2021           1H 2022

                                     Capital expenditure                                                            Total debt / Total equity

    Debt profile and maturities                                                      ROE
     (百万美元)

                                                                                                                 24.3%                   25.1%
                                                                                           23.4%
           1,075                                                                                                                                        20.5%
             26               940                          942           975
                   26
                               47                          85            205
                                                47

          1,049
                              893                          857           770
                                               893

           2019              2020                          2021        1H 2022             2019                  2020                    2021           1H 2022
                           Interest-bearing bank loans – current
                           Interest-bearing bank loans – non-current                                       Adjusted net profit / Average total equity

    Relatively low financing cost with interest rate of 1.56+LIBOR and 1.80+LIBOR on two tranches of bank loans.
                                                                                                                                                                  10
2. 2022 Business Update

                          11
Remains on track to long-term growth objectives

1     Our business is resilient, growing, and diversified
                                                                           What sets us apart is
                                                                             our high quality,
           We continue to grow market share in existing categories,
      2    across our major markets                                           rapid product
                                                                             innovation, that
                                                                               consistently
            New Category Entry – 2021 launches driving 1H22 topline
       3    growth, while major 2022 launches start shipping in Q3                delivers
                                                                           extraordinary value
                                                                            to our consumers,
           International expansion outside our core markets continues to
      4    grow via Shark & Ninja brands                                     across multiple
                                                                              categories and
      The strength of our growth strategy and skill to navigate the
                                                                               geographies
5     current macro environment will deliver another solid year

                                                                                               12
Industry leading organic top and bottom-line growth
 over last 3 years  +81% sales, +208% adj. net profit

1st Half Performance       v. 1H 2021        v. 1H 2020   v. 1H 2019

Net Sales                      Flat            +47%        +81%

Adj Net Profit                -14%             +54%       +208%

                                                                       13
Our brands are strong, and increasingly diversified

                          Extraordinary growth in 1H                                 $2.2      $2.2
                                                                                    billion   billion
                               over last 3 years
                             *Growth rates versus 2019 1st Half results
1H Net Sales (USD mn)

                                                                           $1.5
                                                                          billion
                                                      $1.2
                                                     billion

                                                                                                        14
#1. Our business is resilient, and growing top-line

                              Following +48% growth in 1H
Revenue Growth by half

                                  2021, we successfully
                               maintained topline in 1H22

                                              IPO            Global            Supply
                             Tariffs                                                    Inflation
                                             Dec’19         Pandemic           Chain

                                                                                               15
 (YoY growth rates)
#1. Our business is resilient, while maintaining bottom-line

                                      Following +80% growth in 1H
Adj. Net Profit Growth by half

                                        2021, we minimized bottom
                                      line decline despite economic
                                                challenges

                                       Tariffs        IPO Dec’19      Global Pandemic   Supply Chain   Inflation
                                                                                                                   16
(YoY growth rates)
#2. Market share leader in US and UK

                    As a small household appliance market leader across core markets, JS Global
                    achieved significant market share expansion YoY in our existing categories
                    June 30, 2022, v. June 30, 2021

                                              US market                                                                                          UK market                       (1)

                                             #1 vacuum brand                                                              Continued improvement in market share across all categories
                                      #1 small kitchen appliance brand
                   JS Global’s market share evolution in each category in the US in 1H2022(2)                           JS Global’s market share evolution in each category in the Great Britain in 1H2022(3)

                                                                                                                                  55.2%
                        35.2%                                                                                           50.0%
            32.5%
                                                                 34.4%
                                                     30.8%
                                                                                              25.2%        25.4%
                                                                                                                                                         29.4%     31.0%

                                                                                                                                                                                                     15.7%
                                                                                                                                                                                           12.4%

      Food preparation appliances                   Cleaning appliances                       Cooking appliances      Electrical Cooking Pots            Vacuum Cleaners               Food preparation appliances
                                   1H2021                                           1H2022                                                 1H2021                                  1H2022
Notes:
(1)    Excludes Northern Ireland.
(2)    US Market share data source: The NPD Group / Retail Tracking Service, U.S. dollar sales, Jan-Jun 2021, 2022.
(3)    UK Market share data source: GfK; Market Intelligence; Value Sales, GB; Jan-Jun 2021, 2022.                                                                                                                   17
Market share trajectory: United States

Consistent, YoY market share gains in existing categories,
in our largest geographic market
   35.0%
                                                             35.2%
                                    32.5%
   33.0%                                                 34.4%
   31.0%
   29.0%
                                         30.8%
                27.2%
   27.0%                                                25.4%
   25.0%       26.6%
                                         25.2%
   23.0%
   21.0%
               18.3%
   19.0%
   17.0%

               1H-20                1H-21              1H-22
                                                                     18
Market share trajectory: NEW categories, in US

      SharkNinja’s new categories quickly gaining share in US market
                               June 30th, 2021                                         1 year later….                           June 30th, 2022
 Kitchenware                                   1.8%                                     ~$3.5 billion (1)
                                                                                            US Market FY                                       3.6%
 (Cookware & Cutlery)

 Air Purifiers                                 0.1%
                                                                                        ~$1.0 billion (2)
                                                                                            US Market FY                                       5.1%

 Hair Dryers                                   0.0%                                    ~$500 million (2)
                                                                                            US Market FY                                       3.1%

 Ice Cream                                     0.0%
                                                                                       ~$100 million (2)
                                                                                            US Market FY                                     50.8%
Source: (1) The NPD Group / Retail Tracking Service, U.S. dollar sales, 52 weeks ending July 2, 2022, (Cookware, Cutlery) ; (2) The NPD Group / Retail Tracking   19
Service, U.S. dollar sales, 12 months ending June 2022, (Air Purifiers, Hairdryers, Ice Cream/Yogurt Makers)
Existing category growth – update on 1H 2022 launches
(SharkNinja)
In the 1st half of 2022, we continue to launch new, innovative products in existing
categories in order to grow market share globally
                                                                                                                                                                       Uses Pure Air Microforce to
                                                                                                                                                                         deliver fast, powerful, and
                                                                           Shark Stratos                                                                                  quiet purification. Clean
                                                                                                                                                                       Sense IQ senses air quality
                                                                                                                                                                       & auto-adjusts to improve air
                                                                                                                                                                        quality and report results in
                                                                        With Odor Neutralizer                                                                                     real time
                                                                         Technology which
                                                                         guards against bad
        Ninja Programmable XL                                             odors inside the
         14-Cup Coffee Maker                                                  vacuum                                                                   Shark Air Purifier MAX
                                                                                                               Ninja TWISTi Blender                         with HEPA
   With a freshness timer, delay brew, brew
  pause and clean cycle functionality coupled
               with 2 brew styles                                                                               Delivering the smoothest
                                                                                                               purees and finest blends of
                                                                                                                any Ninja pitcher with its
                                                                                                                 built-in Twist Tamper,
                                                                                                               Hybrid-Edge™ high-speed
                                                                                                                 blades, and a powerful
                                                                                                                          motor.

               Ninja Foodi                                                      Ninja Foodi                                                    Ninja Professional XL
               Possible Pot                                                    Possible Pan                                                       Food Processor

       Features NeverStick technology that never sticks, chips or flakes. Dishwasher, oven and metal utensil             With an XL feed shute with a 3-part pusher for any size ingredient
                 safe, and features nesting designed to protect cooking surfaces during storage                              and 4 Auto-iQ programs combine unique pulsing patterns

                                                                                                                                                                                                        20
Existing category growth – update on 1H 2022 launches
    (Joyoung)

High-speed cell-wall           0-coating                Air frier            Water purifier     Xiaomowang frying
 breaking blender             rice cooker               VF736                  RF660s                 pan
       P557                        N1                                                                CJ599

                 0-coating                  Air frier           Water purifier        Damowang frying
                rice cooker                 VF739                  RF960                   pan
                     N7                                                                   CJ895                     21
Existing category growth – key 2H 2022 launches
    (Joyoung)
      In the 2nd half of 2022, we continue to bring new products to
      market across existing categories

                    Hand-wash-free   Soymilk   Pressure         Floor     0-Coating
Visible Air frier
                       blender       maker      cooker        scrubber   Rice Cooker
 KL45-VF127
                        Y751         D4120     Y-60C56           Q5         30N6

                                                                                       22
#3. New category update

                                                                                                 New Category Entry
A winning,                                                                                        2022 Launches
compounding,
growth strategy               New Category Expansion
that is building                 2022 Launches
for the future                                                                                                  +
 New Category Growth
   2021 Launches
                               Hair Care     Kettle
                                                      +     Cutlery      Toaster         Hair Care     Kettle
                                                                                                                +     Cutlery      Toaster

                                                                                                                                               23
                           Canister Vacuum   Juicer   Home Environment   Ice Cream   Canister Vacuum   Juicer   Home Environment   Ice Cream
New category growth – update on 2021 launches

 In 2021, we launched EIGHT new categories, most in Q4

   Cannister Vacuum             Kettle                  Cutlery               Hair Dryer

                                                                  Ice Cream
        Juicer        Toaster            Air Purifier                                      24
The product that launched a brand  Foodi

 Launched in 2018         Ninja Heated Cooking Portfolio Today
  The (Original) Ninja
  Foodi TenderCrisp
                                                                                                                         6-1 XL 2-Basket Air Fryer
   Pressure Cooker                                                                                                            with DualZone

                                                                                             Smart XL 6-1 Indoor Grill
                                                                                                   & Air Fryer

                          Air Fryer Max XL

                                                       Foodi SMART XL Pressure
                                                          Cooker Steam Fryer

                                                      2-in-1 Flip Toaster        10-1 XL
                                                                                 Pro Air Fry Oven

 We now have 25%+
market share in the US,
  and 55%+ in UK                                                                                                           Speedi Rapid
                                 13-1 Dual Heat Air                                                                      Cooker & Air Fryer
                                                                                                                                                 25
                                     Fry Oven                       Smart Indoor Grill & Air Fryer
The product that opened the door to a category

 Launched in 2020
                                    Ninja Kitchenware Portfolio Today
  The (Original) Ninja                                       NeverStick Premium Anti-
   Foodi NeverStick                                            Scratch Nest System

  Premium Cookware

                                                                                                                             NeverStick Vivid

                                                                                                   NeverDull Woodblock Set
                         NeverStick Premium Set
                              Possible Pan

 In under 2 years, we
gained 3.6% market
  share in the US, a
$3.5 billion market,                                                     NeverDull Premium 17-
                                                                          Piece Knife Block Set
                                                                                                                              NeverStick Premium
                                                                                                                                  Bakeware

 and are just getting
       started                                    NeverStick Stainless
                                                                                                  NeverStick Premium Set
                                                                                                       Possible Pot                                26
                                                  10-Piece Set
New category expansion – key 2H 2022 launches
  In the 2nd half of 2022, we continue to bring new
  products to market across new and existing categories

Cutlery – Wood Block

                                                      Creami Deluxe

                                                                      Flexstyle
                                                                      Hair Dryer / Styler
                       Air Purifier with Combi Heat                                         27
New category entry – key 2H 2022 launches

 In the 2nd half of 2022, SharkNinja continued to bring new
 products to market across new and existing categories

         Ninja Woodfire Grill                    Shark 2-in-1 Wet Dry Vacuum - Hydrovac
                                                                                          28
#4. International expansion outside core Markets (1H)

                               Extraordinary growth
                             outside our core markets
                                 over last 3 years
1H Net Sales (USD mn)

                                 *Growth rates versus 2019 1H results

                           International

                             North
                            America

                              China
                            Core Markets
                                                                                                 29
                                                                            *Constant Currency
#5. Mitigating measures for global macro environment changes
Macro Factor                        Status / Mitigation

                                    - Ocean freight costs have started to decrease from 2H-21 / 1H-22 highs, but remain elevated
      Ocean Freight                 - Prioritize and manage shipments to maximize the volume of containers shipped under our
                                    negotiated contract rates

                                    - Commodity & component costs expected to come off peaks from 21-1H22
      Inflation - FX, Commodities   - Continue to achieve economies of scale by aggregating SharkNinja and Joyoung volume,
                                    enhancing bargaining power with suppliers

                                    - Chip supply remains secure by leveraging JSG buying power
      Supply Chain Stabilization    - Continue to assess & execute on multiple mitigation strategies; design optimization, new
                                    factory partnership, subcomponent localization, spot buys
                                    - Efforts to continue optimizing our diversified supply chain persist

                                    - Proactive steps taken in 1H to right size inventory at retail and our warehouse network
      Inventory Health              - Resulting in healthy retailer inventory levels of both Shark and Ninja products, well
                                    positioned for new product shipments and holiday sales

                                    - Amazon Prime Day a huge success in the US market
$                                      –showcasing brand strength of Shark and Ninja
      Consumer Demand
                                    - Strategic media investments in 2H to support laucnh of new categories, and international
                                    expansion
                                    - Proven track record of effective P&L management through uncertain times, leveraging
      Economic Uncertainty            our global expense base
                                    - Continue to invest in R&D and Advertising
                                    - Cost Optimization initiatives remain a major focus
                                                                                                                                   30
Optimizing supply chain to handle US tariffs

Tariff updates in 1H2022                                        Further tariff mitigation strategies

   On March 23, 2022, the Office of the United States                             Continuing to expand the capacity
   Trade Representative announced tariff exclusions on                            in Vietnam and Thailand
   most of Shark Ninja’s products that had been subject
   to 25% tariffs.
                                                                                  Working with suppliers to improve
                                                                                  supply chain efficiency and
                                                                                  reduce their costs to be closer to
   Exclusions on the majority of products have been                               the cost paid for products
   reinstated through December 31, 2022 and retroactive
   to October 12, 2021                                                            produced in China moving forward

                                                                                  Focusing on a diversified supply
 While it is possible current tariff exclusions could be made                     chain by balancing production
 permanent or extended beyond 2022, this is by no means                           inside and outside China
 certain, so we are continuing to focus heavily on further
 expanding our sourcing capacity outside of China

                                                                                                                       31
3. ESG

         32
Well-recognized ESG performance

                                                                                              S&P Global Dow
       HKQAA-Hang Seng                                            FTSE Russell                Jones Corporate           Globally renowned          Hang Seng Corporate
       Sustainability Rating                                       ESG Ratings                 Sustainability           financial magazine             Sustainability
                                                             JS Global Lifestyle scored      Assessment (CSA)          Institutional Investor        Benchmark Index
       JS Global Lifestyle was

                            A-                                       2.8 in 2021          JS Global Lifestyle scored
                                                                                                                        JS Global Lifestyle rank   JS Global Lifestyle was
           awarded         ,
      outperforming the average
                                                               while the average score     45     in 2021 while the
                                                                                                                       #3 in the industry for
                                                                                                                                                               a
                                                                                                                                                       selected as

         level of the industry
                                                                for the industry was
                                                                                            average score for the                                    constituent
                                                                            2.2                 industry was
                                                                                                                           Best ESG
                                                                                                                                           (1)
                                                                                                                                                     stock in 2022
                                                                                                     24

(1)   Source: ranking by Institutional Investor Journal released on 23 June 2022
                                                                                                                                                                             33
Establishing a complete ESG system

                                    Sustainability management
                                     Established an effective ESG framework
                                     No violations of laws and regulations was recorded in 2021
                                     Responded to the CDP climate questionnaire for the first time
                                     Revised and disclosed 5 sustainability policies: Employee Rights
                                      Policy, Code of Business Conduct, Supplier Code of Conduct,
                                      Environmental Management
                                      Policy, Board Diversity Policy

Supply chain management                                                                                                 Products and services
                                                                                                                      Invested USD219mn+ in R&D in 2021 and owned
 Conducted ESG-related assessments when selecting and                                                                  10,129 patents as of 31 Dec 2021
  working with suppliers. SharkNinja conducted annual internal
  audits on key tier-1 suppliers to ensure compliance, while                                                          Formulated the Product Recall Management System,
  Joyoung conducted auditing of 22 suppliers and kept                                                                   under which products and services were highly
                                                                                                                        satisfied by customers. No product recall due to
  monitoring their ESG practice
                                                                                                                        product quality issues in 2021
 Established a long-term and routine
                                                                                                                     Actively participated in the development of various
  communication mechanism and an empowerment                                                                          standards, including engaging or participating in the
  strategy with suppliers. SharkNinja conducted at                                                                    formulation of 33 standards from 2018 to 2021
  least one training for its tier 1 suppliers every
  year, while Joyoung organized 41 supplier
                                                                                                             Launched a series of new products, and won seven Home Industry
  trainings, covering 146 suppliers                                                                              Performance Awards issued by NPD Group in terms of innovative
 Required suppliers to abide by the Supplier Code                                                               R&D and product quality
  of Conduct, which was formulated to ensure a                                                   Established a comprehensive information security management system, under
  reliable and responsible supply chain. An                                                       which no information leakage incident occurred in 2021. Meanwhile, engaged a
  aggregate of 23 SharkNinja tier 1 suppliers                                                     third-party professional firm to conduct a comprehensive information security
  received audits under the BSCI or SMETA                                                         assessment. Joyoung passed the ISO/ IEC 27001: 2013 information security
  standards in 2021                                                                               management system certification, while SharkNinja had a cyber security policy

                                                                                                                                                                                  34
Becoming the industry benchmark for ESG practice

Environmental protection & management                                                        SharkNinja followed the international standard for carbon
 SharkNinja provided recycling points for consumers, provided battery recycling bins in      emission accounting - ISO 14064:2018, completing company-
  offices in the U.K. and North America, and supported the ”Blue Box” Program to meet its     wide carbon emissions assessment under the scope 1, scope
  stewardship obligations in Canada                                                           2 and part of scope 3. It also purchased VCS carbon credits to
 Refurbished 818,899 products, generating a revenue of USD13,832,973 via waste recycling     offset the carbon footprint generated
  and reduction                                                                              SharkNinja European headquarters has achieved the dynamic
 Joyoung afforested an area of 27,845 square meters                                          goal of carbon neutrality
 Developed environmental goals and action plans, focusing its efforts on its five major
  environmental impacts: greenhouse gas emissions, energy consumption, materials                         Total photovoltaic power generated by Joyoung was
  consumption, water consumption and waste production, and continued to carry out follow-                 3,163,198 kWh, representing a self-consumption rate of 86%
  up plans                                                                                               SharkNinja’s warehousing and logistics partner in U.K. received three
 Identified JS Global’s climate change risks and financial impacts based on the                          BREEAM certifications, and SharkNinja’s headquarters received LEED
  TCFD Framework                                                                                          Silver certification; Joyoung passed ISO 14001:2015 Environmental
 Environmental protection investment reached RMB2.156mn                                                  Management System certification

Social welfare                                                                                                        Employee management
                                                                                                                    SharkNinja and Joyoung invested USD1.4mn and
                                                                                                                       RMB5mn in employee training respectively.
                                                                                                                       Xiaoyang School, a training platform for employees
                                                                                                                       in Joyoung, trained 55,000 employees totally, with
                                                                                                                       the average training hours per trainee being 60
                                                                                                                       hours
                                                                                                                SharkNinja was named one of America's Best Places to
                                                                                                                    Work in early 2022 and was one of the 100 Best Large
 Spent USD2.66mn on charity activities, with 697 volunteers                                                        Enterprises to Work For in the U.S.
  contributing 7,727 hours of volunteer services                                                         SharkNinja established a strategy and target known as Diversity,
 The projects under “Joyoung Charity Kitchen” have spanned over 222                                        Equity & Inclusion,aiming to hire 20%+ new employees from
  counties of 27 provinces and cities across China, and built 1,217 kitchens, which                         socially disadvantaged groups by 2022; Joyoung guaranteed the
  benefited 2.6+ million students                                                                           employment opportunities of the disabled by employing 46
                                                                                                            persons with disabilities
 Joyoung and its founding team pledged to donate RMB110mn+ to the “Joyoung Charity          Joyoung renewed its stock option plan, covering 107 employees, to whom it has granted 15.6 million
  Kitchen” project in the next ten years, and planned to pick 100 schools in rural areas      stock options
  across China each year and offer RMB80,000 to RMB100,000 to each of them                   Joyoung opened 22 employee interest clubs, providing free summer parent-child training sessions

                                                                                                                                                                                              35
4. Strategy and Outlook

                          36
Five key growth strategies

            Drive sustainable long-term growth
        2   through sales network and product
            category expansion

                                                                               Pursue strategic partnerships
                                                                          5    and acquisitions
    Develop and commercialize innovative
1   products, combining powerful technology
    with appealing designs                                        Strengthen the Group’s brand
                                                             4    recognition and enhance consumer
                                                                  engagement

                                                 3   Maximize the Group’s synergies

                                                                                                               37
A strategy to ensure lasting growth

                           How we DELIVER  Focus on the Consumer

                         Develop and commercialize innovative                                    Drive sustainable long-term
                            products, combining powerful                                        growth through sales network
                          technology with appealing designs                                    and product category expansion

                                                      How we GROW
   Existing Categories                                    New Categories                                   Internationalization
          Dominant market share                            Entry into new and adjacent                               Growth in Europe
           Continued innovation                                product categories                        Expansion in France, Germany, Spain, Italy
Expansion within recently launched categories                                                            Expansion of Shark & Ninja brands in APAC

                                                         Our Outlook
                  Superior navigation of global                                          Continue to exceed overall
                  macro economic challenges                                                market performance
                                                                                                                                                      38
Our mission

        “                                                                            ”
               Positively impact people’s lives around the world every day through
              transformational, innovative and design-driven smart home products

                                                                                         39
Contacts

Investor Relations:
Venus Zhao
Tel: +852 2310 8277
Email: venus.zhao@jsgl.com

Company website:
https://www.jsgl.com

Linkedin:
https://www.linkedin.com/company/j-s-global

Twitter:
@JS_Global_HK

Wechat:
JS环球生活

                                              40
You can also read