2021 SECOND QUARTER EARNINGS - July 29, 2021 - PG&E Corporation
←
→
Page content transcription
If your browser does not render page correctly, please read the page content below

2021 SECOND QUARTER EARNINGS

         July 29, 2021
®

    Forward-Looking Statements
This presentation contains statements regarding management’s expectations and objectives for future periods (including key factors affecting 2021 non-GAAP core earnings)
as well as forecasts and estimates regarding PG&E Corporation’s and Pacific Gas and Electric Company’s (the “Utility”) 2021 Wildfire Mitigation Plan (WMP), rate base
projections, capital expenditure forecasts and regulatory developments. These statements and other statements that are not purely historical constitute forward-looking
statements that are necessarily subject to various risks and uncertainties. Actual results may differ materially from those described in forward-looking statements. PG&E
Corporation and the Utility are not able to predict all the factors that may affect future results. Factors that could cause actual results to differ materially include, but are not
limited to risks and uncertainties associated with:

•   unresolved claims from the Chapter 11 proceedings, including securities class action claims;
•   PG&E Corporation and the Utility’s substantial indebtedness;
•   any wildfires that have occurred in the Utility’s territory, including the extent of the Utility’s liability in connection with the 2019 Kincade fire (including the outcome of the
    criminal complaint filed by the Sonoma County District Attorney), the 2020 Zogg fire, and the 2021 Dixie fire; the Utility’s ability to recover related costs, and the timing of
    insurance recoveries;
•   the Utility’s ability to help reduce wildfire threats and improve safety as a result of climate driven wildfires and extreme weather, including the ability comply with its WMP;
    its ability to retain or contract for the workforce to execute its WMP; and the cost of the program and the timing of any proceeding to recover such costs through rates;
•   the ability to securitize $7.5 billion of costs related to the 2017 Northern California wildfires;
•   the Utility’s implementation of its Public Safety Power Shutoff (PSPS) program;
•   whether the Utility may be liable for future wildfires, and the impact of AB 1054 on potential losses in connection with such wildfires, including the CPUC’s procedures for
    recovering such losses;
•   the requirement that the Utility maintain a valid safety certification and the potential effects of the CPUC’s enhanced enforcement and oversight authority;
•   the Utility’s ability to access the Wildfire Fund, including that the Wildfire Fund has sufficient remaining funds;
•   the global COVID-19 pandemic and its impact on PG&E Corporation’s and the Utility’s financial condition, results of operations, liquidity and cash flows, as well as on
    energy demand, the ability to collect on customer invoices, the ability to mitigate these effects and to recover any related, and the impact of workforce disruptions;
•   the Utility’s ability to obtain wildfire insurance at a reasonable cost in the future, or at all; the adequacy of insurance coverage and scope of limitations; and the ability to
    obtain recovery of insurance premiums;
•   the timing and outcome of FERC rate cases and the Utility’s applications for cost recovery of recorded amounts, future cost of capital proceedings, and other ratemaking
    and regulatory proceedings, including the EOEP;
•   the Utility’s ability to control operating costs, timely recover costs through rates and achieve projected savings, and the extent to which it incurs unrecoverable costs that
    are higher than forecasted;
•   the outcome of the probation and the monitorship, and related compliance costs, including the costs of complying with any additional conditions of probation, including
    expenses associated with any material expansion of the Utility’s vegetation management program;
•   tax treatment of certain assets and liabilities, including whether PG&E Corporation or the Utility undergoes an “ownership change” that limits certain tax attributes; and
•   the other factors disclosed in PG&E Corporation and the Utility’s joint annual report on Form 10-K for the year ended December 31, 2020, as updated by their joint
    quarterly report on Form 10-Q for the quarter ended June 30, 2021 (the “Form 10-Q”) and other reports filed with the SEC, which are available on PG&E Corporation’s
    website at www.pgecorp.com and on the SEC website at www.sec.gov.

Undefined, capitalized terms have the meanings set forth in the Form 10-Q. Unless otherwise indicated, the statements in this presentation are made as of July 29, 2021.
PG&E Corporation and the Utility undertake no obligation to update information contained herein. This presentation was attached to PG&E Corporation and the Utility’s joint
current report on Form 8-K that was furnished to the SEC on July 29, 2021 and is also available on PG&E Corporation’s website at www.pgecorp.com.

                                                                                                                                                                                   2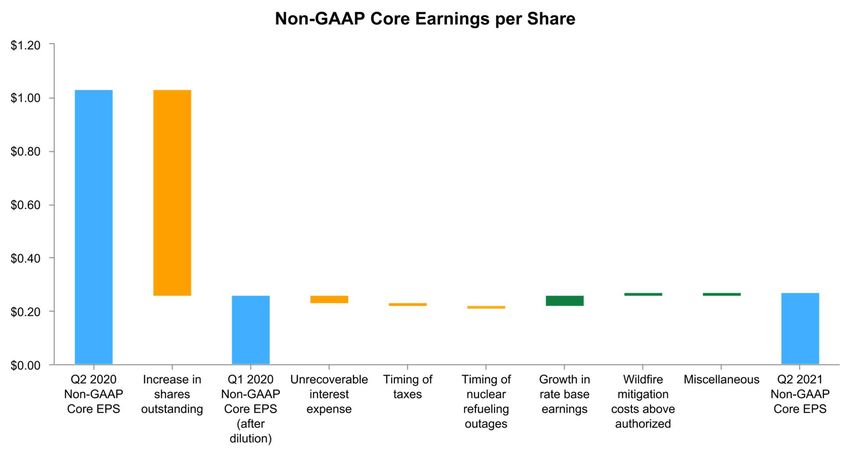
®

  2021: A Focus on People, the Planet, and Prosperity

                People                                                 Planet                                                    Prosperity

 Execution On-Target for
                                                                                          Improved PSPS Protocols
 Wildfire Mitigation Plan

 Q2 Non-GAAP Core EPS
                                                                                          Filed 2023 General Rate Case
 of $0.27

                                                                                                      Underpinned by Performance
Non-GAAP core earnings is not calculated in accordance with GAAP and excludes non-core items. See Appendix 10, Exhibit A for a reconciliation of earnings per share
("EPS") on a GAAP basis to non-GAAP core earnings per share and Exhibit H for the use of non-GAAP financial measures.
See the Forward-Looking Statements for factors that could cause actual results to differ materially from the guidance presented.                                    3
®

Responding to Current Conditions

     Respond to all outages in            Additional Safety Patrols
 1   HFTDs as emergency               3   for Prioritized Circuits
     response                             with high risk of initiating
                                          potential Hot/Dry Summer
                                          Day Wildfires
        Already operationalized

     Implement Fast Trip Setting          Vegetation Management and
 2   for Circuits with high risk of       System Safety Patrols including
                                          associated tree removals in
     initiating potential Hot/Dry         process
     Summer Day Wildfires

     Currently being implemented
     on a risk-informed basis

                                          Additional Actions in Motion
                                                                            4
®

 PSPS Progress

                                                                                                 2021 Goal      2018-2021
                Program                                           2021 Progress1                 (12/31/21)     Progress

              Sectionalizing                             157                          63%           250           988
              Devices
                                                        DEVICES                    Operational    Devices       Devices

              Transmission Line                          19                           66%           29             73
              Switches                                 SWITCHES                     Installed    Switches       Switches

              Temporary
                                                         4                           80%             5              7
              Distribution                                                         Complete
                                                        SITES                                      Sites          Sites
              Microgrids

              Substation                                                                             8              6
              Temporary                                                               75%
                                                          6                                        Sites          Sites
                                                        SITES                        Ready
              Generation                                                                         *By 8/1/2021

Presentation end notes are included in appendix 9.

                                                     Improved preparation reduces impact on customers
                                                                                                                          5
®

Wildfire Mitigation Plan

                                                                                          2021 Goal    2018-2021
             Program                                         2021 Progress1               (12/31/21)   Progress

              System                                  71                        39%          180          852
              Hardening
                                                     MILES                    Hardened      Miles         Miles

              Enhanced
                                                     598                    33%             1,800         4,973
              Vegetation                             MILES                Completed         Miles         Miles
              Management

              Weather                                165                        55%         300          1,170
              Stations                           STATIONS                     Installed   Stations      Stations

                                                     70
                                                                                52%         135           419
              HD Cameras
                                                 CAMERAS                      Installed   Cameras       Cameras

              Distribution                                                                                Tier 3:
                                                                                 77%        460K         Annually
              Inspections                            355K                                              Tier 2: Every
                                                     POLES                    Inspected     Poles
              (Tier 2 &3)                                                                                 3 years

Presentation end notes are included in appendix 9.

                                                                  Taking risk out of the system every day
                                                                                                                   6
®

AB1054

                                                                      Downside
                                                                     Protections

                                                                   Improved
                                         Wildfire Safety           Prudency
                                          Certificate              Standard

                     Approved Wildfire                             Liquidity to Pay
                      Mitigation Plan                              Claims

 Design & Execute                                                   Maximum
Risk Reducing Plan                                                  Liability Cap

                                                   Provides downside protections
                                                                                    7
®

   Q2 2021 Earnings Results

                                                                                          Three Months Ended                  Six Months Ended
                                                                                             June 30, 2021                      June 30, 2021
               (in millions, except per share amounts)                                   Earnings           EPS             Earnings            EPS
              PG&E Corporation’s Earnings on a GAAP basis                            $         397      $       0.18    $         517       $       0.24
              Non-core items:
              Amortization of Wildfire Fund contribution                                        85              0.04              171               0.08
              Investigation remedies                                                            50              0.02                78              0.04
              Bankruptcy and legal costs                                                        40              0.02                72              0.03
              2019-2020 wildfire-related costs, net of insurance                                 3                —               136               0.06
              Prior period net regulatory recoveries                                            —                 —                 88              0.04
              PG&E Corporation’s Non-GAAP Core Earnings                              $         575      $       0.27    $       1,062       $       0.50

                                                                                                     Three Months           Six Months
                                                                                                      Ended June            Ended June
                              Non-Core Items (in millions, pre-tax)                                    30, 2021              30, 2021
                              Amortization of Wildfire Fund contribution                            $           118     $            237
                              Investigation remedies                                                              60                   97
                              Bankruptcy and legal costs                                                          54                   98
                              2019-2020 wildfire-related costs, net of insurance                                   4                 189
                              Prior period net regulatory recoveries                                              —                  122
 Note: Amounts may not sum due to rounding.

Non-GAAP core earnings is not calculated in accordance with GAAP and excludes non-core items. See Appendix 10, Exhibit A for a reconciliation of EPS on a GAAP basis to
non-GAAP core earnings per share and Exhibit H for the use of non-GAAP financial measures.
                                                                                                                                                                   8
See the Forward-Looking Statements for factors that could cause actual results to differ materially from the guidance presented.
®

   Q2 2021 Quarter over Quarter Comparison

                              ($0.77)

                $1.03

                                               $0.26         ($0.03)                                                       $0.01           $0.01          $0.27
                                                                                                            $0.04
                                                                             ($0.01)        ($0.01)

                                              $0.26                                                                                                       $0.27

Non-GAAP core earnings is not calculated in accordance with GAAP and excludes non-core items. See Appendix 10, Exhibit A for a reconciliation of EPS on a GAAP basis to
non-GAAP core earnings per share and Exhibit H for the use of non-GAAP financial measures.
                                                                                                                                                                   9
See the Forward-Looking Statements for factors that could cause actual results to differ materially from the guidance presented.
®

 2021 Factors Impacting Earnings

         ~$47.2B
          ~$44.5B                                  10.25%                             ~$2.1-$2.25B                                   $0.95-$1.05
     Equity Earning Ratebase       (1)
         Equity Earning Ratebase (1)         Authorized CPUC ROE across                   Non-GAAP Core Earnings                        Non-GAAP Core EPS
                                                   the Enterprise (2)

Key Factors Affecting Non-GAAP Core Earnings                                          Non-Core Items(5)
                                                                                      ($ millions after tax)
Drivers of Variance from Authorized
($ millions after tax)                                                                   - Bankruptcy and legal costs                              ~ $1,420 - $1,480

 —
     Net below the line and spend above authorized (3)               $0 - $100           - Amortization of Wildfire Fund contribution              ~            330
 —   Unrecoverable interest expense (4)                              300 - 325
                                                                                         - 2019-2020 wildfire-related costs                        ~      140    -      160
Range of non-GAAP core earnings below authorized                   $300 - $425                                                                     ~
                                                                                         - Investigation remedies                                               130
                                                                                                                                                   ~
                                                                                         - Prior period net regulatory recoveries                                50
Equity                                                                                                                                             ~
                                                                                        + Net securitization inception impact                                   (150)
 2021 Equity issuance                                        $0 - $400M               Estimated non-core items guidance                           ~ $1,920 - $2,000

Assumptions
• Final, non-appealable decision in $7.5B rate neutral securitization application in 2021, including a $1B contribution to the customer credit
  trust in 2021.
• CPUC approval of settlement in the 2011-2014 GT&S capital audit proceeding in 2021.
• 2020 WMCE filing approved in 2021 as recorded.

     Presentation end notes are included in appendix 9.
                                                                                                               Changes from prior quarter noted in blue
 See the Forward-Looking Statements for factors that could cause actual results to differ materially from the guidance presented and underlying assumptions.            10
®
2023 GRC
Gas System Electric System
Wildfire Safety Clean Energy
Safety & Reliability Safety & Reliability
2023 Revenue Requirement 2023 GRC Timeline
$15.5B
$3.6 2023 Increase
June 30, 2021 GRC filed
April 11 – May 2, 2022
Evidentiary Hearings
$11.9
2022 Authorized
December 2022 Expected PD
2023 Revenue Requirement
Average capex of $8 billion per year funds core business
11®
Substantial Capital Investments
(1)
2020-2026 CapEx Forecast ($B)
$7.9-$10.3
(3) Subject to Ongoing and
$7.8-$9.6 $7.9-$9.6 $8.0-$9.6 Future Recovery Requests
$7.8-$8.9
$7.5-$8.5 Spend related to:
$7.6
• 2023 GRC request including
Wildfire Mitigation Balancing
Account
• Oakland HQ Purchase
• Microgrids
(2)
Presentation end notes are included in appendix 9.
See the Forward-Looking Statements for factors that could cause actual results to differ materially from the guidance presented and underlying assumptions. 12®
Ratebase Growth Forecast
Weighted Average Ratebase Forecast
by Rate Case ($B)
Potential Growth Opportunities
~8.5% CAGR • Additional wildfire mitigation
on equity earning ratebase 2021 - 2026
$64-$71
$62-$68 • Transportation electrification
$60-$64
$56-$60 • Additional distributed generation-
enabled microgrids
$49-$50
~$47.2
$44.1 • Grid modernization
• Undergrounding
See the Forward-Looking Statements for factors that could cause actual results to differ materially from the guidance presented and underlying assumptions. 13®
Balance Sheet Improvements
Cost Recovery Wildfire Costs - Regulatory Account Totals
In Billions In Millions
CEMA $916
Yet to be Filed WMPMA $459 $637
~1.91 VMBA $594 $736
WEMA $230 $440
FHPMA $87 $198
WMBA $156 $192
Non-Current
RTBA $242 $532
~3.5B
Filed for Recovery ~1.6 Current
Filed for Recovery and Approved Interim Rate Relief
2018 CEMA 2020 WEMA 2020 WMCE
Interim Rate Relief ~0.8 Decision Expected TBD Aug – 2021 Sep – 2021
Recovery Timing 12 Months 12 Months 12 Months
Recovery Amount Total ($M) $763 $440 $1,216
Presentation end notes are included in appendix 9.
Recovery Mechanisms for Wildfire Related Costs
14®
Multi-Year Financial Plan
2021 – 2026 Outlook
10% ~8.5%
Non-GAAP Core EPS
CAGR Ratebase CAGR
Deleveraging and reduced Ratebase growth driven by
equity needs improve wildfire mitigation and gas
financial health system safety capital
Driven by Ratebase and Debt Paydown
Non-GAAP core earnings is not calculated in accordance with GAAP and excludes non-core items. See Appendix 10, Exhibit A for a reconciliation of EPS on a GAAP basis to
non-GAAP core earnings per share and Exhibit H for the use of non-GAAP financial measures.
15
See the Forward-Looking Statements for factors that could cause actual results to differ materially from the guidance presented.®
People, Planet, Prosperity Underpinned by Performance
People Planet Prosperity
See you soon!
Investor Day – August 9, 2021
16Appendix
®

Table of Contents

 Appendix 1 - Wildfire Risk Reduction Programs                  Slide 19
 Appendix 2 - AB 1054 Wildfire Fund                             Slide 20
 Appendix 3 - Illustrative Wildfire Fund Scenarios              Slide 21
 Appendix 4 - Regulatory Progress                               Slide 22
 Appendix 5 - PG&E Catastrophic Wildfire Cost Securitization    Slide 23
 Appendix 6 - PG&E Wildfire Mitigation Capex Securitization     Slide 24
 Appendix 7 - COVID-19 Impacts                                  Slide 25
 Appendix 8 - Expected Timelines of Selected Regulatory Cases   Slide 26-29
 Appendix 9 - Presentation Footnotes                            Slide 30-31
 Appendix 10 - Supplemental Earnings Exhibits                   Slide 32-47

                                                                              18
®
Appendix 1: Wildfire Risk Reduction Programs
2018-2021 PROGRESS
PROGRAM 2021 GOAL/TARGET As of June 30, 2021
Enhanced and Targeted Inspections • Complete annual cycles for Tier 3 Implementing annual cycles for Tier 3
Inspecting distribution, transmission and substation equipment to address potential risks and every 3 years for Tier 2 and every 3 years for Tier 2
Enhanced Vegetation Management 4,973
• Complete 1,800 miles
Meeting and exceeding state vegetation and safety standards miles
System Hardening 852
• Harden 180 miles miles
Installing stronger poles, covered lines and/or targeted undergrounding
• Replace approximately 1,200 fuses
and other non-exempt equipment
Targeted Equipment Upgrades (e.g. Expulsion Fuses, Surge Arrestors)
identified on poles in Tier 2 and 1,447 fuses
Replacing existing expulsion fuses and surge arrestors with new, safer, CAL FIRE exempt
Tier 3 HFTD areas. 21,631 arrestors
equipment
• Replace at least 15,000 Tier 2 and
Tier 3 non-exempt surge arresters.
• Install 29 transmission line
Transmission and Distribution Sectionalizing Devices switches 73 transmission line switches
Separating the distribution grid into smaller sections for more targeted PSPS events • Install at least 250 sectionalizing 988 sectionalizing devices
devices
HD Cameras & Weather Stations • Install 300 weather stations 1,170 weather stations
Installing HD cameras and weather stations for real time monitoring of high-risk areas to • Install 135 HD cameras 419 HD cameras
enable earlier warning and detection of wildfires
• Develop at least 5 temporary
7 temporary generation distribution
Microgrids generation distribution microgrids microgrids sites
Readying substations and the distribution system to receive temporary generation during sites
severe weather • Prepare at least 8 substation 6 substation temporary generation
temporary generation sites sites
19®
Appendix 2: AB 1054 Wildfire Fund (1)
Wildfire Fund Contribution Treatment Total Funding and Participation
• Contribution amounts amortized based on an assumed ~15-year life (2) Wildfire Fund Funding Sources ($B)
Additional IOU Ongoing
Funding over 10 Contribution
• Tax treatment pending private letter ruling from the IRS Years
PG&E Pre-Emergence Wildfire Liabilities DWR
Surcharge
Repays SMIF
$21B
Loan in Net
Contributions
• For fires occurring after July 12, 2019 and prior to exiting Chapter 11 from IOUs and
Customers
• Claims in excess of $1B are eligible for recovery and the fund will pay no
Capitalization PG&E Initial
more than 40% of allowed claims
December 2020 Contribution
~$10B
PG&E Investments and Liability Cap SDG&E
SCE
• $3.2B of wildfire investments excluded from earning a ROE SMIF
Loan
• $2.9B liability cap (Estimated 20% of 2020 Equity T&D Rate base)
Presentation end notes are included in appendix 9.
20®
Appendix 3: Illustrative Wildfire Fund Scenarios
California’s Wildfire Fund application depends on the total amount of claims and the CPUC’s
determination of whether utility conduct was reasonable and prudent.
Claims Fund Pays Victims: PG&E Corporation CPUC Finds PG&E CPUC Finds PG&E
Determined: PG&E seeks payment from
Fund for eligible claims
Applies for Cost Corporation Acted O Corporation Acted
Gross of insurance1 Recovery: Prudently: Imprudently:
exceeding $1B1
Recovery of amount paid by Fund is not reimbursed
R Fund is reimbursed up to $2.9B cap2
Fund is evaluated via 12-
month CPUC process
$0.75B $0 Fund is not activated in this scenario
Claims do not exceed
Scenario A $1B threshold
No PG&E O Shareholders
$2.5B $1.5B Corporation reimburse $1.5B
R
Reimbursement
($2.5B - $1B) to Fund Cap reduced to $1.2B for future events
Scenario B over remainder of 3-year period
No PG&E Shareholders
$5B $4B Corporation
O
reimburse ~$2.9B
Reimbursement R
($5B - $1B) to Fund Cap reduced to $0 for future events
Scenario C over remainder of 3-year period
Examples are strictly illustrative
Presentation end notes are included in appendix 9.
21®
Appendix 4: Regulatory Progress
Status as of June 2021 Expected Milestones(1)
2021 2022
GRC 2023 GRC Filed 6/30/21
2023 GRC Filing Proposed Decision Expected Q4 2022
2019 Final Decision
GT&S
GT&S Capital Audit Settlement Proposed Decision Expected Q4 2021
Cost of Capital Final Decision(2)
TO 18 Order Rehearing Denied
TO 19 Final Decision (3)
TO Rate Cases
TO 20 Decision 12/30/20
Interim Rate Relief Final Decision
WMCE Application filed 9/30/20 Final Decision Expected Q3 2021
Rate Neutral Securitization
Final Decision Issued 4/23/21
Securitization (AFR Pending) Rate Neutral Bond Issuance (4)
Filings Financing Order Final Decision
Issued 5/6/21 (AFR Pending)
AB1054 Final Decision 6/24/21 AB1054 Bond Issuance
2021 Wildfire
Submitted 2/5/21 Approval Expected Q3 2021
Mitigation Plan
Presentation end notes are included in appendix 9.
See the Forward-Looking Statements for factors that could cause actual results to differ materially from the guidance presented. 22®
Appendix 5: PG&E Catastrophic Wildfire Cost
Securitization
Assuming regulatory approval consistent with CPUC filings, PG&E plans to sponsor the issuance of up to $7.5
billion of recovery bonds (the “Recovery Bonds”) through securitization to reimburse certain wildfire costs.
Summary of Key Securitization Terms
PG&E Customers
Recovery Property: the right to impose, collect, and receive
from the electric customers (excluding CARE and FERA
customers) amounts necessary to pay principal and interest on
Collateral the securitization bonds, as well as the issuing entity’s other Customer Fixed
ongoing costs and expenses, timely and in full, and including Credits Recovery
the ability to adjust the securitization charges periodically Charges ($)
Reimbursement of
through a “true-up” mechanism Customer Credits
• Up to $7,500 million (may be issued in one or more Pacific Gas and Electric Company
Issuance Size Customer
transactions) (Seller & Servicer)
Credit Trust
PG&E Shareholder
To pay or reimburse catastrophic wildfire costs or expenses,
Asset Contribution
Purpose / Use of including:
Proceeds • Repay $6 billion of temporary utility debt
• To accelerate the final payment to certain wildfire victims Recovery
Property Fixed
Net Bond
(true Recovery
Structure • Multi-tranche Proceeds
sale) Charges ($)
Final Payment Bond Proceeds
Date • Approximately 30 Years after the issuance date
• Periodic True-Ups Principal & Interest(1)
Issuing Entity Bondholders
Bond Credit
Enhancement Pledge of
• Collection Account (including General, Excess Funds and Recovery Property
Capital Subaccounts)
While PG&E forecasts that the Customer Credit will equal fixed Bankruptcy-Remote Entity
recovery charges paid by customers in each billing period such
Payments of principal and interest will follow payment of certain fees and operating
(1)
that the transaction is anticipated to be rate-neutral for its
expenses
customers, failure to provide the Customer Credit for any
reason will not:
Customer Credit a. impact the customers’ unconditional obligation to pay
Trust the fixed recovery charges, or
b. allow the CPUC to (a) adjust, amend or modify the
fixed recovery charges, recovery costs, recovery
property or the Securitization authorized by the
Financing Order; or (b) rescind, alter or amend the
Financing Order
23®
Appendix 6: PG&E Wildfire Mitigation Capex
Securitization
PG&E plans to sponsor the issuance of up to $3.2 billion of recovery bonds (the “Recovery Bonds”) through
securitization to reimburse certain capital expenses associated with wildfire risk mitigation, with authority to
issue the first transaction of up to $1.2 billion in 2021.
Summary of Key Securitization Terms PG&E Customers
Recovery Property: the right to impose, collect, and receive
from the electric customers (excluding CARE and FERA
customers) amounts necessary to pay principal and interest on Fixed
Collateral the recovery bonds, as well as the issuing entity’s other Recovery
ongoing costs and expenses, timely and in full, and including Charges ($)
the ability to adjust the securitization charges periodically
through a “true-up” mechanism Pacific Gas and Electric Company
• A financing order for the 2021 transaction became final,
(Seller & Servicer)
Issuance Size non-appealable and irrevocable as of July 6, 2021,
authorizing an issuance to recover up to $1.2 billion
Recovery Net Bond Fixed
Purpose / Use of • To pay or reimburse PG&E for capital expenses associated Property Proceeds Recovery
Proceeds with catastrophic wildfire risk mitigation (true sale) Charges ($)
Bond Proceeds
Structure • Multi-tranche
Final Payment Principal & Interest(1)
• Approximately 30 Years after the issuance date PG&E Recovery Funding LLC Bondholders
Date
Pledge of
Recovery Property
• Periodic True-Ups
Bond Credit
Enhancement • Collection Account (including General, Excess Funds and Bankruptcy-Remote Entity
Capital Subaccounts)
Payments of principal and interest will follow payment of certain fees and operating
(1)
expenses
24®
Appendix 7: COVID-19 Impacts
Overall, PG&E’s key wildfire mitigation and safety work execution has not been impacted by COVID-19.
California's constructive regulatory framework minimizes potential earnings impacts from reduced load and
higher uncollectibles.
Key Areas Potential Business Impact Current Status
CapEx and OpEx ◦ No net earnings impact given ratemaking
◦ Focus on essential work
structure
◦ Delay in customer collections as a ◦ No anticipated earnings impact due to
Collection Delays and
Uncollectible Revenues result of shelter-in-place and COVID-19 Pandemic Protections
moratorium on service disconnections Memorandum Account (CPPMA)
◦ In 2021, decreased load/reduced billings
for 2020 will be collected through the
Electric and Gas ◦ Revenues decoupled from energy annual electric and gas true-up processes.
Demand usage and trued-up annually PG&E is no longer estimating a load
impact from COVID-19 after December 31,
2020.
◦ ~$3.2B of total liquidity at June 30, 2021:
◦ Net reduction in near-term monthly ▪ $233 million of Utility cash
Liquidity cash inflows with sufficient liquidity to ▪ $74 million of PG&E Corporation cash
fund ongoing operations ▪ $2.9 billion available under credit facilities
(includes Utility and Corp credit facilities)
Changes from prior quarter noted in blue
25®
Appendix 8: Expected Timelines of Selected
Regulatory Cases
Regulatory Case Docket # Key Dates
2023 General Rate Case (Phase I) A.18-11-009 June 30, 2021 – Application filed
July 15, 2021 – Public workshop on GRC Application
Aug 6, 2021 – Protests and responses to GRC application, pursuant to Rule 2.6(a)
Aug 16, 2021 – Reply to protest and responses
Aug 16, 2021 – Prehearing Conference
Aug 30, 2021 – PG&E’s supplemental testimony on real estate and gas transmission and storage.
Sept 28, 2021 – Scoping Memo of Assigned Commissioner
Jan 31, 2022 – Public Advocates Office and Intervenor Testimony
Mar 17, 2022 – Concurrent Rebuttal Testimony
TBD – Proposed Decision
TBD – Final Decision
Transmission Owner Rate Case ER16-2320 Jul 29, 2016 – PG&E filed TO18 rate case seeking an annual revenue requirement for 2017
(TO18)
Sep 30, 2016 – FERC accepted TO18 making rates effective Mar 1, 2017 and establishing settlement process
Oct 19, 2016 – FERC settlement conference
Oct 30, 2016 – CPUC seeks rehearing of FERC's grant of 50 bp ROE adder for CAISO participation
Feb 7-8, 2017 – FERC settlement conference
Mar 16, 2017 – Parties reached impasse in settlement discussions
Jan 2018 – Hearings
Oct 1, 2018 – Initial decision issued
Oct 31, 2018 – Brief on Exceptions (BOE) filed
Nov 20, 2018 – Reply to BOE filed
Oct 15, 2020- FERC issued an order (Opinion No. 572) on all issues except ROE.
Nov 14, 2020 – PG&E filed rehearing request on CGI Plant Allocation, Service Lives, Capital Additions and O&M Forecasts,
and STIP Allocation.
Dec 14, 2020 – Supplemental ROE Testimony filed.
Dec 15, 2020 – FERC denies rehearing requests on certain issues (non ROE) based on Operations of Law
Feb 11, 2021 – PG&E and Intervenors file appeal of the FERC decision denying rehearing followed by motions to hold
appeal in abeyance until June 29, 2021
Feb 12, 2021 – Supplemental ROE Testimony filed
Apr 15, 2021 – FERC issues further Order on Rehearing
TBD – Evaluation is undergoing on whether to further pursue appeal or rehearing.
26®
Appendix 8: Expected Timelines of Selected
Regulatory Cases
Regulatory Case Docket # Key Dates
Transmission Owner Rate Case (TO19) ER17-2154 Jul 26, 2017 – PG&E filed TO19 rate case seeking an annual revenue requirement for 2018
Sept 28, 2017 – FERC accepted TO19 making rates effective Mar 1, 2018, subject to refund, and establishing settlement process
Oct 2017 and May/July 2018 – FERC settlement conferences
Sept 21, 2018 – Offer of Settlement filed with FERC with motion for interim rates
Oct 9, 2018 – Chief ALJ granted motion for interim rates and authorized the implementation of the interim rates (Jul 1, 2018 for
Wholesale and Jan 1, 2019 for retail) pending Commission action on settlement
Dec 20, 2018 – FERC approved the all-party settlement
Transmission Owner Rate Case (TO20) ER19-13 Oct 1, 2018 – Application filed
Nov 30, 2018 – FERC accepted TO20 filing and set interim rates effective May 1, 2019
Dec 14, 2018 – FERC settlement conference
Mar 14, 2019 – FERC settlement conference
Jun 13-14, 2019 – FERC settlement conference
Aug 13-14, 2019 – FERC settlement conference
Oct 9, 2019 – First comprehensive settlement offer from Intervenors and Trial Staff
Oct 28-29, 2019 – FERC settlement conference
Nov 7, 2019 – FERC settlement phone conference - status update
Dec 12, 2019 – FERC settlement conference
Mar 31, 2020 – Partial settlement offer target filing date
May 2020 – Prehearing conference on litigation issues
August 17, 2020 – FERC approves Partial Settlement
Oct 15, 2020 - Filed Offer of Settlement to resolve all pending issues
December 2020 - Final Decision
Wildfire Mitigation and Catastrophic A.20-09-019 Sept 30, 2020 - Application Filed
Events Application Nov 2, 2020 - Protests or responses
Nov 12, 2020 - Reply to protests or responses
Dec 4, 2020 - Prehearing Conference
Apr 14, 2021 - Intervenor Testimony
Apr 30, 2021 Rebuttal Testimony
May 14, 2021- Update on Settlement
May 24-28, 2021 Evidentiary Hearing
Jun 11, 2021 Opening Briefs
Jun 25, 2021 Reply Briefs
27
Sep 2021 Proposed DecisionAppendix 8: Expected Timelines of Selected
®
Regulatory Cases
Regulatory Case Docket # Key Dates
Stress Test Securitization Application A.20-04-023 Apr 30, 2020 - Application filed
Oct 14, 2020 - Intervenors' Testimony
Nov 11, 2020 - PG&E Rebuttal Testimony
Dec 7-16, 2020 - Evidentiary Hearing
Jan 15, 2021 - Opening Briefs
Feb 1, 2021 - Reply Briefs
March 23, 2021 - Proposed Decision
April 21, 2021 - Revised Proposed Decision
April 22, 2021 - Final Decision
Rate Neutral Securitization Financing Order A.21-01-004 Jan 6, 2021 - Application filed
February 25, 2021 - Intervenors‘ proposed facts submitted
March 1, 2021 - Opening Briefs
March 12, 2021 - Reply Briefs
April 5, 2021 - Proposed Decision
May 6, 2021 - Final Decision
AB1054 Securitization A. 21-02-020 Feb 24, 2021 - Application filed
Apr 13, 2021 - All-party meeting to discuss application
May 7, 2021 - Reply Briefs
May 25, 2021 – Proposed Decision
Jun 24, 2021 - Final Decision
Jul 6, 2021 – AFRs from parties
28Appendix 8: Expected Timelines of Selected
®
Regulatory Cases
Regulatory Case Docket # Key Dates
Regionalization A.20-06-011 Jun 30, 2020 - Application Filed
Aug 17, 2020 PG&E Reply
Dec 16, 2020 – Comments
Feb 26, 2021 - Updated Proposal
Mar 3, 2021 - Second Workshop
Apr 2, 2021 - Comments on Updated Proposal
Apr 9, 2021 - Reply Comments
Jul 20, 2021 – Settlement progress report
Aug 2021 - Hearings
General Office Sale Section 851 A.20-09-018 Sept 30, 2020 - Application Filed
Dec 15, 2020 - Scoping Memo issued
Feb 26, 2021 - Intervenor Testimony Served
Mar 19, 2021 – PG&E’s Rebuttal Testimony Served
Apr 12, 2021 - Evidentiary Hearing scheduled [canceled by ALJ]
April 22, 2021 – Settlement Agreement Filed
May 7, 2021 - Opening Briefs (if needed)
May 21, 2021 - Reply Briefs (if needed)
July 2021 - PG&E submits Supplemental Testimony and executed Purchase and Sale Agreement
Jul 23, 2021 - Proposed Decision Issued
Aug 9, 2021 – Reply comments
Aug/Sept 2021 – Expected Final Decision
29®
Appendix 9: Presentation Footnotes
Slide 5:
1. Year to date progress, as of June 30, 2021.
2. 2019-2021 progress.
Slide 6:
1. Year to date progress, as of June 30, 2021.
Slide 10:
1. 2021 equity earning ratebase reflects 2020 GRC Final Decision, 2019 GT&S Final Decision, the April 15, 2021 FERC order denying the
Utility's request for rehearing related to TO18, and TO20 Formula Rate.
2. Base earnings plan assumes CPUC currently authorized return on equity and capital structure across the enterprise.
3. Net below the line and spend above authorized includes overspend in Electric and Gas Operations, including inspections costs and costs
related to gas pipeline replacements, respectively.
4. Unrecoverable interest expense reflects interest on $4.75 billion of PG&E Corporation debt, $2.45 billion Wildfire Fund contribution debt
financing, and other interest above authorized.
5. Refer to Exhibit A: Reconciliation of PG&E Corporation's Consolidated Earnings Available for Common Shareholders in Accordance with
Generally Accepted Accounting Principles to Non-GAAP Core Earnings.
Slide 12:
1. Low end of the range reflects authorized capital expenditures, including the full amount recoverable through a balancing account where
applicable. High end of the range includes capital spend above authorized and reflects the spending forecast from the 2023 GRC application.
2. CapEx forecast includes ~$3.2B of fire risk mitigation capital expenditures included in the Utility’s approved wildfire mitigation plans on which
PG&E Corporation and the Utility will not earn an equity return. The Utility has spent approximately $1.7 billion cumulatively towards this total
including approximately $200 million and $300 million during the three and six months ended June 30, 2021, respectively.
3. The Utility will enter into a lease, with an option to purchase in 2023, the Lakeside Building in Oakland, California, in accordance with its
application to sell its San Francisco General Office headquarters complex and as requested in the 2023 GRC.
30®
Appendix 9: Presentation Footnotes
Slide 14:
1. Includes amounts not yet filed for recovery less reserves and equity return that cannot be recognized for accounting purposes until approved
by the CPUC.
Slide 20:
1. Participation in the AB 1054 Wildfire Fund is subject to PG&E making the required annual contributions to the Fund and maintaining
reasonable insurance coverage.
2. The useful life of the Wildfire Fund is estimated based on various assumptions, including the number and severity of catastrophic fires within
the participating electric utilities’ service territories during the term of the Wildfire Fund, historical fire-loss data, the estimated cost of wildfires
caused by other electric utilities, the amount at which wildfire claims will be settled, the likely adjudication of the CPUC in cases of electric
utility-caused wildfires, the level of future insurance coverage held by the electric utilities, and the future transmission and distribution equity
rate base growth of other electric utilities. Significant changes in any of these estimates could materially impact the amortization period.
Slide 21:
1. Eligible claims are those exceeding the greater of $1 billion or the insurance coverage required to be in place pursuant to Cal. Pub. Util. Code
§ 3293. PG&E carried $900M of wildfire insurance coverage at June 30, 2021. PG&E can seek cost recovery of claims below the $1B fund
threshold but above insurance coverage levels through CPUC prudency review.
2. For utility caused fires deemed imprudent, the Fund is re-infused up to the liability cap, currently estimated at ~$2.9B (calculated based on
20% of PG&E Equity T&D rate base for 2021). Cap applies to aggregate reimbursements to the fund over a rolling three calendar year period.
Cap does not apply if Utility is found to have conscious or willful disregard of the rights and safety of others.
Slide 22:
1. The rate case timelines outlined above reflect expected filing and decision time frames; actual timing may differ.
2. Any potential trigger to the Annual Adjustment to the Cost of Capital Mechanism in 2021 could impact 2022 earnings.
3. The approved TO19 settlement will be 98.5% of TO18 rate case outcome.
4. Rate Neutral Securitization bonds may be issued in up to tree series on or prior to December 31, 2022.
31®
Appendix 10: Supplemental Earnings Materials
Reconciliation of PG&E Corporation's Consolidated Earnings Available for Common
Exhibit A: Shareholders in Accordance with Generally Accepted Accounting Principles ("GAAP") to Slides 33-36
Non-GAAP Core Earnings
Key Drivers of PG&E Corporation's Non-GAAP Core Earnings per Common
Exhibit B: Share ("EPS") Slide 37
Exhibit C: Operational Performance Metrics Slides 38-40
Exhibit D: Sales and Sources Summary Slide 41
Exhibit E: 2021 Earnings Guidance Slides 42-44
Exhibit F: General Earnings Sensitivities for 2021 Slide 45
Exhibit G: GAAP Net Income to Non-GAAP Adjusted EBITDA Reconciliation Slide 46
Exhibit H: Use of Non-GAAP Financial Measures Slide 47
32®
Exhibit A: Reconciliation of PG&E Corporation's Consolidated Earnings Available for
Common Shareholders in Accordance with Generally Accepted Accounting Principles
("GAAP") to Non-GAAP Core Earnings
Second Quarter, 2021 vs. 2020
(in millions, except per share amounts)
Three Months Ended Six Months Ended
June 30, June 30,
Earnings per Common Earnings per Common
Earnings Share (Diluted) Earnings Share (Diluted)
(in millions, except per share amounts) 2021 2020 2021 2020 2021 2020 2021 2020
PG&E Corporation's Earnings on a GAAP basis $ 397 $ (1,972) $ 0.18 $ (3.73) $ 517 $ (1,601) $ 0.24 $ (3.03)
Non-core items: (1)
Amortization of Wildfire Fund contribution (2) 85 125 0.04 0.24 171 125 0.08 0.24
Investigation remedies (3) 50 45 0.02 0.08 78 73 0.04 0.14
Bankruptcy and legal costs (4) 40 2,275 0.02 4.30 72 2,452 0.03 4.64
2019-2020 wildfire-related costs, net of insurance (5) 3 148 — 0.28 136 148 0.06 0.28
Prior period net regulatory recoveries (6) — (78) — (0.15) 88 (78) 0.04 (0.15)
PG&E Corporation’s Non-GAAP Core Earnings (7) $ 575 $ 542 $ 0.27 $ 1.03 $ 1,062 $ 1,119 $ 0.50 $ 2.11
All amounts presented in the table above and footnotes below are tax adjusted at PG&E Corporation’s statutory tax rate of 27.98% for 2021 and 2020, except for certain
costs that are not tax deductible. Amounts may not sum due to rounding.
(1) “Non-core items” include items that management does not consider representative of ongoing earnings and affect comparability of financial results between periods,
consisting of the items listed in the table above. See Exhibit H: Use of Non-GAAP Financial Measures.
33®
Exhibit A: Reconciliation of PG&E Corporation's Consolidated Earnings Available for
Common Shareholders in Accordance with Generally Accepted Accounting Principles
("GAAP") to Non-GAAP Core Earnings
Second Quarter, 2021 vs. 2020
(in millions, except per share amounts)
(2) The Utility recorded costs of $118 million (before the tax impact of $33 million) and $237 million (before the tax impact of $66 million) during the three and six months ended
June 30, 2021, respectively, associated with the amortization of Wildfire Fund contributions related to Assembly Bill ("AB") 1054.
(3) The Utility recorded costs of $60 million (before the tax impact of $11 million) and $97 million (before the tax impact of $19 million) during the three and six months ended
June 30, 2021, respectively, associated with investigation remedies. This includes $24 million (before the tax impact of $6 million) and $48 million (before the tax impact of
$13 million) during the three and six months ended June 30, 2021, respectively, related to the Order Instituting Investigation ("OII") into the 2017 Northern California Wildfires
and 2018 Camp Fire (the "Wildfires OII") settlement, as modified by the Decision Different dated April 20, 2020. The Utility also recorded an incremental charge of $20
million (before the tax impact of $1 million) during the three and six months ended June 30, 2021, associated with the May 26, 2021 Presiding Officer's Decision for the
Public Safety Power Shutoff (PSPS) Order to Show Cause for the Fall 2019 PSPS events. The Utility also incurred restoration and rebuild costs of $9 million (before the tax
impact of $3 million) and $14 million (before the tax impact of $4 million) during the three and six months ended June 30, 2021, respectively, associated with the town of
Paradise (2018 Camp Fire). The Utility also recorded costs of $8 million (before the tax impact of $0.1 million) and $15 million (before the tax impact of $0.4 million) during
the three and six months ended June 30, 2021, respectively, for system enhancements related to the Locate and Mark OII.
Three Months Ended Six Months Ended
(in millions, pre-tax) June 30, 2021 June 30, 2021
Wildfire OII disallowance and system enhancements $ 24 $ 48
Incremental PSPS charge 20 20
Paradise restoration and rebuild 9 14
Locate and Mark OII system enhancements 8 15
Investigation remedies $ 60 $ 97
(4) PG&E Corporation and the Utility recorded costs of $54 million (before the tax impact of $14 million) and $98 million (before the tax impact of $26 million) during the three
and six months ended June 30, 2021, respectively, associated with bankruptcy and legal costs. This includes $34 million (before the tax impact of $10 million) and $72
million (before the tax impact of $20 million) during the three and six months ended June 30, 2021, respectively, related to exit financing costs. PG&E Corporation and the
Utility also incurred legal and other costs of $19 million (before the tax impact of $4 million) and $26 million (before the tax impact of $6 million) during the three and six
months ended June 30, 2021, respectively.
Three Months Ended Six Months Ended
(in millions, pre-tax) June 30, 2021 June 30, 2021
Exit financing $ 34 $ 72
Legal and other costs 19 26
Bankruptcy and legal costs $ 54 $ 98
34®
Exhibit A: Reconciliation of PG&E Corporation's Consolidated Earnings Available for
Common Shareholders in Accordance with Generally Accepted Accounting Principles
("GAAP") to Non-GAAP Core Earnings
Second Quarter, 2021 vs. 2020
(in millions, except per share amounts)
(5) The Utility incurred costs, net of probable insurance recoveries, of $4 million (before the tax impact of $1 million) and $189 million (before the tax impact of $53 million)
during the three and six months ended June 30, 2021, respectively, associated with the 2019-2020 wildfires. This includes accrued charges for third-party claims of $175
million (before the tax impact of $49 million) during the six months ended June 30, 2021, related to the 2019 Kincade fire, and $75 million (before the tax impact of $21
million) and $100 million (before the tax impact of $28 million) during the three and six months ended June 30, 2021, respectively, related to the 2020 Zogg fire. In addition,
the Utility also incurred costs of $6 million (before the tax impact of $2 million) during the six months ended June 30, 2021, for clean-up and repair costs related to the 2020
Zogg fire. The Utility also incurred costs of $6 million (before the tax impact of $2 million) and $9 million (before the tax impact of $3 million) during the three and six months
ended June 30, 2021, respectively, for legal and other costs related to the 2019 Kincade fire, as well as $3 million (before the tax impact of $1 million) and $7 million (before
the tax impact of $2 million) during the three and six months ended June 30, 2021, respectively, related to the 2020 Zogg fire. These costs were partially offset by probable
insurance recoveries of $80 million (before the tax impact of $22 million) and $108 million (before the tax impact of $30 million) during the three and six months ended June
30, 2021, respectively, related to the 2020 Zogg fire.
Three Months Ended Six Months Ended
(in millions, pre-tax) June 30, 2021 June 30, 2021
2019 Kincade fire-related costs
Third-party claims $ — $ 175
Legal and other costs 6 9
2020 Zogg fire-related costs, net of insurance
Third-party claims 75 100
Utility clean-up and repairs — 6
Legal and other costs 3 7
Insurance recoveries (80) (108)
2019-2020 wildfire-related costs, net of insurance $ 4 $ 189
35®
Exhibit A: Reconciliation of PG&E Corporation's Consolidated Earnings Available for
Common Shareholders in Accordance with Generally Accepted Accounting Principles
("GAAP") to Non-GAAP Core Earnings
Second Quarter, 2021 vs. 2020
(in millions, except per share amounts)
(6) The Utility incurred $122 million (before the tax impact of $34 million) during the six months ended June 30, 2021, associated with prior period net regulatory recoveries,
reflecting the impact of the April 15, 2021 FERC order denying the Utility's request for rehearing on the Transmission Owner ("TO") 18, which rejected the Utility's direct
assignment of common plant to FERC, and impacted TO revenues recorded through December 31, 2020.
(7) "Non-GAAP core earnings" is a non-GAAP financial measure. See Exhibit H: Use of Non-GAAP Financial Measures.
36®
Exhibit B: Key Drivers of PG&E Corporation's Non-GAAP Core Earnings per
Common Share ("EPS")
Second Quarter, 2021 vs. 2020
(in millions, except per share amounts)
Second Quarter 2021 vs. 2020 Year to Date 2021 vs. 2020
Earnings per Earnings per
Earnings Common Share Earnings Common Share
(Diluted) (Diluted)
2020 Non-GAAP Core Earnings (1) $ 542 $ 1.03 $ 1,119 $ 2.11
Increase in shares outstanding (2) — (0.77) — (1.59)
Unrecoverable interest expense (3) (63) (0.03) (129) (0.06)
Timing of taxes (4) (17) (0.01) (33) (0.02)
Timing of nuclear refueling outages (5) (10) (0.01) (31) (0.01)
Growth in rate base earnings 76 0.04 145 0.07
Wildfire mitigation costs above authorized (6) 23 0.01 11 0.01
Miscellaneous 24 0.01 (20) (0.01)
2021 Non-GAAP Core Earnings (1) $ 575 $ 0.27 $ 1,062 $ 0.50
All amounts presented in the table above are tax adjusted at PG&E Corporation’s statutory tax rate of 27.98% for 2020 and 2021. Amounts may not sum due to rounding.
(1) See Exhibit A for reconciliations of (i) earnings on a GAAP basis to non-GAAP core earnings and (ii) EPS on a GAAP basis to non-GAAP core EPS.
(2) Reflects 2,146 million weighted average shares during the three and six months ended June 30, 2021.
(3) Unrecoverable interest expense reflects interest on $4.75 billion of PG&E Corporation debt and $2.45 billion Wildfire Fund contribution debt financing for the three months and six
months ended June 30, 2021.
(4) Represents the timing of taxes reportable in quarterly statements in accordance with Accounting Standards Codification 740, Income Taxes, and results from variances in the
percentage of quarterly earnings to annual earnings.
(5) Represents the timing of the Diablo Canyon Power Plant ("DCPP") refueling outage during the three and six months ended June 30, 2021, with no similar impact in 2020.
(6) Represents lower wildfire mitigation spend relative to authorized for microgrids and certain electric asset inspections during the three and six months ended June 30, 2021.
37®
Exhibit C: Operational Performance Metrics
2021 Performance Results YTD Actual 2021 Target Meets YTD
Target
Customer Welfare - prioritizing public and employee safety
Electric Operations
Wildfire Risk Reduction (1) 1 2 P
Wire-Down Events Due to Equipment Failure Rate 2.600 2.161
Gas Operations
Large Overpressure Events Rate 0.016 0.110 P
Total Dig-Ins Reduction 0.94 1.14 P
Generation
Safe Dam Operating Capacity (SDOC) 99.89% 99.00% P
DCPP Reliability and Safety Indicator 92.5 87.5 P
Operational Performance and Reliability
Gas Customer Emergency Response (minutes) 20.6 20.8 P
Electric 911 Emergency Response 97.48% 96.66% P
Customers Experiencing Multiple Interruptions (CEMI) 3.07% 2.63%
Average Speed of Answer - Emergencies (seconds) 8 10 P
Workforce Safety
Days Away, Restricted, & Transferred (DART) Rate 1.33 0.91
Serious Injuries - Actual 1 4 P
SIF Investigation Completed Within 30 Days 95% 70% P
SIF Corrective Actions Completed On Time 95% 92% P
Financial Stability
Non-GAAP Core Earnings per Share (2) $0.50 See note (3) See note (3)
See following pages for definitions of the operational performance metrics. The operational performance goals set under the PG&E Corporation 2021 Short-Term Incentive Plan
(“STIP”) are based on the same operational metrics and targets.
(1) The Reportable Fire Ignitions metric has been replaced with the Wildfire Risk Reduction metric for the 2021 STIP period, as approved by the People and Compensation Committee on June 2, 2021.
(2) Non-GAAP core earnings is not calculated in accordance with GAAP and excludes non-core items. See Appendix 10, Exhibit A for a reconciliation of EPS on a GAAP basis to non-GAAP core earnings per
share and Exhibit H for the use of non-GAAP financial measures.
(3) The 2021 target for non-GAAP core earnings per share is not publicly reported but is consistent with the guidance range provided for 2021 non-GAAP core earnings per share of $0.95 to $1.05. 38®
Definitions of 2021 Operational Performance Metrics from Exhibit C
Customer Welfare – prioritizing public and employee safety
Public and employee safety are measured in five areas: Electric Operations, Gas Operations, Generation, Reliability, and Workforce Safety.
The safety of the Utility’s electric operations is represented by:
• Wildfire Risk Reduction – The metric measures the count of Fire Ignitions that result in fires equal to or greater than 100 acres in PG&E’s High Fire
Threat District (HFTD) and reportable to the California Public Utilities Commission (CPUC) per Decision 14-02-015. A reportable fire incident per
Decision 14-02-015 is a fire event that meets the following criteria: 1) ignition is associated with PG&E power lines (both transmission and distribution),
2) something other than PG&E facilities burned, and 3) the resulting fire travelled more than one meter from the ignition point.
• Wire-Down Events Due to Equipment Failure Rate – Wire-Down Events Due to Equipment Failure are instances where a normally energized electric
primary distribution or transmission conductor experiences a component or asset failure (e.g., pole or splice) that results in a conductor falling from its
intended position and coming to rest on the ground or on a foreign object (e.g., a vehicle or tree).
The safety of the Utility’s gas operations is represented by:
• Large Overpressure Events Rate – Measures the number of large overpressure events year-over-year and reduction in the number of large
overpressure events.
• Total Dig-Ins Reduction – Tracks the number of gas dig-ins per 1,000 Underground Service Alert tickets received for gas. The dig-in component tracks
all dig-ins to PG&E gas subsurface installations. A gas dig-in refers to damage which occurs during excavation activities (impact or exposure) and
results in a repair or replacement of an underground gas facility.
The safety of the Utility’s generation operations is represented by:
• Safe Dam Operating Capacity (SDOC) – Measures operating capability of mechanical equipment used as the main control to reduce enterprise risk of
large uncontrolled water release.
• Diablo Canyon Power Plant (DCPP) Reliability and Safety Indicator – Based on 11 performance indicators for nuclear power generation developed by
the nuclear industry and applied to all U.S. nuclear power plants (measured for DCPP Unit 1 and Unit 2).
The safety of the Utility’s Reliability is represented by:
• Gas Customer Emergency Response – Measures the average response time in minutes for immediate response orders for the performance period.
The response time by PG&E is measured from the time PG&E is notified to the time a Gas Service Representative (or a qualified first responder)
arrives onsite to the emergency location (including business hours and after hours). 39®
Definitions of 2021 Operational Performance Metrics from Exhibit C
Customer Welfare – prioritizing public and employee safety (continued)
• Electric 911 Emergency Response – Measures the percentage of time that PG&E personnel respond (are on site) within 60 minutes after receiving a
911 call, with onsite defined as arriving at the premises where the 911 agency personnel are waiting.
• Customers Experiencing Multiple Interruptions (CEMI) – Measures the number of customers that experience multiple sustained outages (both
unplanned and planned).
• Average Speed of Answer for Emergencies – Measures the average speed of answer in seconds for emergency calls handled in Contact Center
Operations.
The safety of the Utility’s Workforce Safety is represented by:
• Days Away, Restricted, & Transferred (DART) Rate – Measures OSHA-recordable injuries that result in lost time or restricted duty per 200,000 hours
worked, or for approximately every 100 employees.
• Serious Injuries – Actual – A Serious Injury or Fatality (SIF) Actual is defined as any injury or illness resulting from work at/for PG&E that results in:
◦ A fatality – work-related fatal injury or illness;
◦ A life threatening injury or illness, that if not addressed could lead to a fatality or work-related injury or illness that required immediate life-
preserving rescue action, and if not applied immediately would likely have resulted in the death of that person; or
◦ A life altering injury or illness, one that results in the loss or permanent impairment of a limb, organ or body function – work-related injury or
illness that resulted in a permanent and significant loss of a major body part or organ function. For this metric, only SIF Actuals not resulting in
a fatality will be counted.
• % of SIF Investigations Completed within 30 days – Measures SIF Actual and SIF Potential investigations completed by 30 calendar days following
classification of incident as a SIF.
• % of SIF Corrective Actions Completed on Time – Measures the completion of corrective actions related to SIF Actual or SIF Potential cause
evaluations.
Financial
Non-GAAP Core Earnings per Share (shown in dollars per share) represents the financial performance from ongoing core operations. “Non-GAAP core earnings” is
a non-GAAP financial measure and is calculated as income available for common shareholders less non-core items. “Non-core items” include items that
management does not consider representative of ongoing earnings and affect comparability of financial results between periods, consisting of items listed in Exhibit
A. 40®
Exhibit D: Pacific Gas & Electric Company Sales and Sources Summary
Second Quarter, 2021 vs. 2020
Three Months Ended June 30, Six Months Ended June 30,
2021 2020 2021 2020
Sales from Energy Deliveries (in millions kWh) 18,292 17,908 36,186 36,171
Total Electric Customers at June 30 — 5,494,176 5,535,064 5,494,176
Total Gas Sales (in Bcf) 180 158 426 403
Total Gas Customers at June 30 — 4,539,513 4,560,410 4,539,513
Sources of Electric Energy Deliveries (in millions kWh):
Total Utility Generation 5,736 7,154 11,064 15,150
Total Utility Net Purchases/(Sales) (1,373) 1,368 1,015 1,109
Direct Access and Community Choice Aggregator
Purchases 10,507 9,835 21,180 20,375
Total Electric Energy Delivered (1) 18,292 17,908 36,186 36,171
Diablo Canyon Performance:
Overall Capacity Factor (including refuelings) 86 % 99 % 73 % 99 %
Refueling Outage Period 4/1/21-4/19/21 None 3/13/21-4/19/21 None
Refueling Outage Duration during the Period (days) 19 None 38 None
(1) Includes other sources/(uses) of electric energy totaling 3,422 million kWh and (449) million kWh for the three months ended June 30, 2021 and 2020,
respectively, and 2,927 million kWh and (463) million kWh for the six months ended June 30, 2021 and 2020, respectively.
Please see the 2020 Annual Report on Form 10-K for additional information about operating statistics. 41®
Exhibit E: PG&E Corporation's 2021 Earnings Guidance
2021
EPS Guidance Low High
Estimated Earnings on a GAAP basis $ 0.01 $ 0.15
Estimated Non-Core Items: (1)
Bankruptcy and legal costs (2) ~ 0.69 ~ 0.66
Amortization of Wildfire Fund contribution (3) ~ 0.16 ~ 0.16
2019-2020 wildfire-related costs (4) ~ 0.07 ~ 0.07
Investigation remedies (5) ~ 0.06 ~ 0.06
Prior period net regulatory recoveries(6) ~ 0.03 ~ 0.03
Net securitization impact (7) ~ (0.07) ~ (0.07)
Estimated EPS on a non-GAAP Core Earnings basis ~ $ 0.95 ~ $ 1.05
All amounts presented in the table above and footnotes below are tax adjusted at PG&E Corporation’s statutory tax rate of 27.98% for 2021, except for certain costs that are not
tax deductible. Amounts may not sum due to rounding.
(1) “Non-core items” include items that management does not consider representative of ongoing earnings and affect comparability of financial results between periods. See
Exhibit H: Use of Non-GAAP Financial Measures.
(2) “Bankruptcy and legal costs" consists of reversal of the tax benefit recorded for shares transferred to the Fire Victim Trust, exit financing costs including interest on temporary
Utility debt and write-off of unamortized fees related to the retirement of PG&E Corporation debt, and legal and other costs associated with PG&E Corporation and the Utility's
Chapter 11 filing. The total offsetting tax impact for the low and high non-core guidance range is $72 million and $47 million, respectively.
2021
Low guidance High guidance
(in millions, pre-tax) range range
Fire Victim Trust grantor trust benefit ~ $ 1,300 ~ $ 1,300
Exit financing ~ 135 ~ 95
Legal and other costs ~ 120 ~ 70
Bankruptcy and legal costs ~ $ 1,555 ~ $ 1,465
Actual financial results for 2021 may differ materially from the guidance provided. For a discussion of the factors that may affect future results, see the Forward-Looking Statements.
42You can also read