2021 Preliminary Budget - City of Mount Vernon
←
→
Page content transcription
If your browser does not render page correctly, please read the page content below
2021 Preliminary Budget
CITY OF MOUNT VERNON
                                                       2021 PRELIMINARY BUDGET
                                                                      Table of Contents

                                                                                                                                              Page No.

Mayor’s Budget Message ....................................................................................................................1

Preliminary Budget Summary ..............................................................................................................2

Economic Environment ........................................................................................................................3

Employees Deliver Services .................................................................................................................3

Strategic Goals
        Infrastructure ..........................................................................................................................4
        Healthy Neighborhoods ..........................................................................................................6
        A Good Place for Investment ..................................................................................................7
        Operations ..............................................................................................................................9

Budget Development .........................................................................................................................10

Revenue
      Property Tax..........................................................................................................................10
      Sales Tax................................................................................................................................11
      Special Revenue Funds .........................................................................................................11
      Reals Estate Excise Tax..........................................................................................................12

Capital Project Funds .........................................................................................................................12

Debt Service Funds ............................................................................................................................13

Proprietary Funds ..............................................................................................................................13

2021 Revenue Summary by Type ......................................................................................................14

2021 Revenue Estimates by Source ...................................................................................................14

Fund Balance Reconciliation ..............................................................................................................15

Conclusion..........................................................................................................................................16
2021 PRELIMINARY BUDGET
                                                                                    NOVEMBER 2, 2020

Mayor’s Budget Message
I present the 2021 preliminary (draft) budget for your consideration. The City of Mount Vernon adopts a highly
complex and balanced budget by December 31st of each year in accordance with RCW 35A.33.

In a year that has presented us with some of the most unique challenges, trials and obstacles in recent history;
most of us are more than eager to move on, and to look ahead to 2021 and recovery from the COVID-19 pandemic.
We have made difficult decisions this year: varying levels of staffing and services, how and when to scale back,
when to close, and when to open back up. We still have a long way to go toward full recovery. I believe it will be
another year before some “normalcy” returns. This budget was prepared with upmost caution for the City financial
position as the nation continues move forward. I believe that decisions made throughout 2020 have positioned our
city for strength coming out of this pandemic. Efficient staffing levels, a balanced budget, and with sights continually
set on potential growth opportunities—Mount Vernon will rise above this present uncertainty.

I’ve watched as Mount Vernon residents have rallied to support and sustain our local businesses and non-profits.
I’ve been humbled by how many have reached out to city hall to find out how to assist us in maintaining our city
services. Through a global pandemic, through national civil unrest, and through widening political division; I have
been proud of how the vast majority of Mount Vernon residents have demonstrated hope, tolerance and
perseverance through their actions.

Departmental budgets in many instances are prepared for vastly different services – some services are 24-hour
operations, while other Departments work 6 days a week, are on-call, or have a traditional 40-hour work schedule.
Our employees are the City’s greatest asset.

We budget for several unique services through 21 departmental budgets and a
                                                                                             “Budgeting is not just a
total of 40 different funds. The governmental operating fund budgets total
                                                                                          ‘math problem’. The process
$36,014,260, representing a 1.2% decrease compared to the 2020 final budget.
                                                                                            determines if services will
The 2021 preliminary budget for the City of Mount Vernon is $71,172,319,                  fulfill the goals and priorities
representing a 1.5% increase as compared to the                                                 of the community.”
2020 final budget. This increase is due mainly to
a new revenue source from the WA State Ground
Emergency Medical Transportation program with
an estimated amount of $1.5 million and the
inclusion of five new managerial funds that the
City is now required to report for a total of
$912,000.

It is a privilege to work for the City of Mount
Vernon; we are accountable for our City’s
success in good times and in bad. I believe this
preliminary budget is a transparent and detailed
document of the needs of each City department
to successfully fulfill the goals of our Community
in 2021.

                                                           1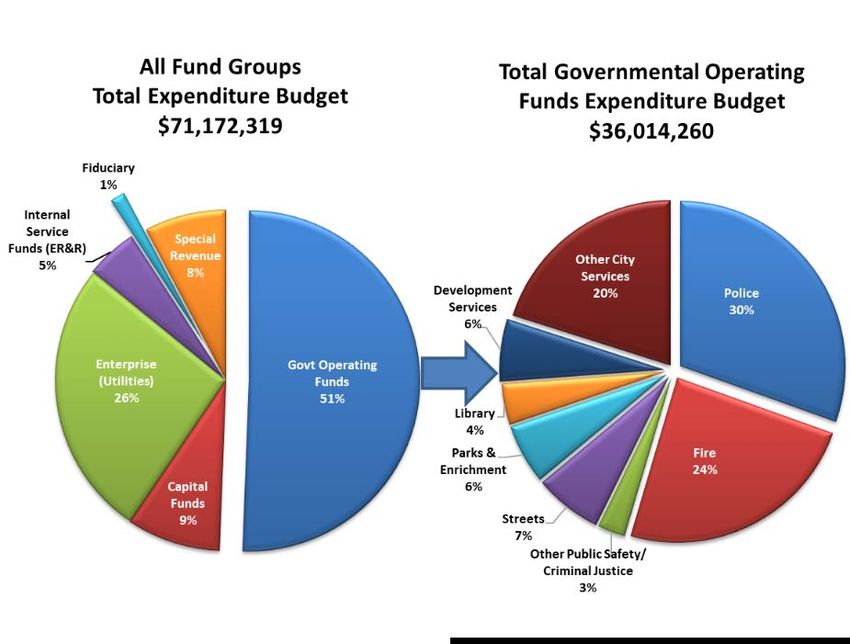
2021 Preliminary Expenditure Budget Summary
    Fund                                                 2020         2021         2020-2021      2020-2021
    Dept                                               Adopted      Proposed        Increase          %
     No.             Fund / Department                  Budget       Budget       (Decrease)       Change
    001    Current Expense Fund
     01     City Council                                  231,656      231,768            112           0.0%
     02     Municipal Court                               573,462      574,997          1,535           0.3%
     03     Mayor                                         441,403      461,589         20,186           4.6%
     04     Finance                                     1,004,946      974,301        (30,645)         -3.0%
     05     City Attorney                                 677,070      697,405         20,335           3.0%
     06     Human Resources                               711,243      750,858         39,615           5.6%
     07     General Facilities                            858,464      831,602        (26,862)         -3.1%
     08     Police Department                          10,664,949   10,975,076        310,127           2.9%
     09     Fire Department                             9,061,801    8,676,805       (384,996)         -4.2%
     11     Public Works/Engineering                      886,821      922,983         36,162           4.1%
     12     Development Services                        2,071,938    2,172,853        100,915           4.9%
     18     TV 10 - Public Access Cable                   235,578      228,925         (6,653)         -2.8%
     97     CDBG Entitlement Grant                        882,525      664,715       (217,810)        -24.7%
     98     Information Services                          873,260      894,950         21,690           2.5%
     99     Non-Departmental                              902,398      982,327         79,929           8.9%
           Total Current Expense Fund                  30,077,514    30,041,154        -36,360         -0.1%
    101    City Street Fund                             2,628,371     2,409,042      (219,329)         -8.3%
    103    Parks and Enrichment Services Fund           2,313,566     2,125,317      (188,249)         -8.1%
    104    Library Fund                                 1,439,366     1,438,747          (619)          0.0%
           Total Governmental Operating Funds          36,458,817    36,014,260       -444,557          -1.2%
    102    Arterial Street Fund                         2,896,525     2,551,000      (345,525)        -11.9%
    105    Paths and Trails Fund                                0             0              0            NA
    106    Tourism Promotion Fund                         367,700       269,950        (97,750)       -26.6%
    107    Little Mountain Improvements Reserve            46,500        46,000           (500)        -1.1%
    109    Crime Prevention Fund                           12,400        12,400              0           0.0%
    110    Government Access Fund                         110,719        84,219        (26,500)       -23.9%
    112    Criminal Justice Assistance Fund               150,000       158,000          8,000           5.3%
    113    Municipal Arts Fund                             13,000             0        (13,000)      -100.0%
    115    Parks Capital Improvements Reserve             178,862        85,362        (93,500)       -52.3%
    117    TBD Fund                                     2,315,000     1,749,065      (565,935)        -24.4%
    118    Fiber Optic Fund                               299,842       326,529         26,687           8.9%
    119    Critical Areas Enhancement Fund                 30,000        30,000              0           0.0%
    120    Lincoln Commercial Properties Fund              35,632       202,000       166,368         466.9%
    301    Library/Comm. Center/Parking Capital Fund      500,000       800,000       300,000          60.0%
    304    Capital Improvements Fund - REET I             786,770       876,195         89,425         11.4%
    306    Fire Station Projects Capital Fund             118,544       928,686       810,142         683.4%
    311    Parks Impact Fees                                    0        50,000         50,000            NA
    312    Fire Impact Fees                               133,500        25,000      (108,500)        -81.3%
    313    Transportation Impact Fees                           0       223,000       223,000             NA
    314    REET II - Streets Fund                         925,000       551,000      (374,000)        -40.4%
    328    Public Works Facility Capital Fund                   0             0              0            NA
    401    Wastewater Utility Fund                      9,523,998     9,551,637         27,639           0.3%
    402    Solid Waste Utility Fund                     7,107,597     6,532,326      (575,271)         -8.1%
    403    Surfacewater Utility Fund                    2,599,700     2,710,043       110,343            4.2%
    411    Sewer Facility Expansion Fund                  764,500       927,000       162,500          21.3%
    412    Sewer Capital Reserve                        1,537,500     1,925,000       387,500          25.2%
    501    Equipment Rental Fund                        2,936,181     3,195,647       259,466            8.8%
    502    Facility Renewal Fund                          100,000       285,000       185,000         185.0%
    512    Leoff I Long-term Healthcare Reserve            40,000        40,000              0           0.0%
    611    Firemen's Pension and Relief Fund              111,000       111,000              0           0.0%
    600    Managerial Funds                                     0       912,000       912,000             NA

           Total All Funds                             70,099,287   71,172,319      1,073,032           1.5%

                                                        2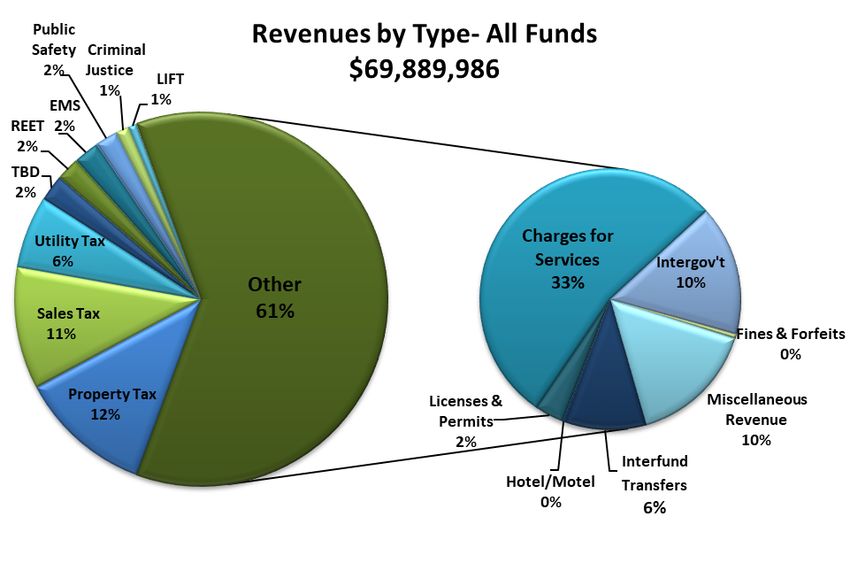
Primary Budget Guidelines:
 Fulfill Strategic Goals * Adhere to the City’s Financial Policy * Maintain the Current Level of Public Services

Economic Environment:
After several years of economic growth for the City, the COVID-19 pandemic struck and the United States saw the
steepest employment decline in history. The City of Mount Vernon was also directly impacted. Due to all of the
uncertainties of the economy, the City chose to take a proactive stance on counterbalancing the projected revenue
decline. The City decreased expenditures where possible by shutting down non-essential City services, reducing
travel and other operating costs, downsizing employees and implementing mandatory furlough hours where
possible. These reductions in expenditures and also more positive revenue collections than anticipated has
projected that the City will end the 2020 year within fiscal policy guidelines.
                                                                      Estimating revenues into the 2021 budget year
                                                                      is extremely challenging since the long-term
                                                                      effect of the COVID-19 pandemic is uncertain.
                                                                      However, if we translate the 2021 estimated
                                                                      tax revenues to constant dollars so that the
                                                                      impact of inflation is removed and present the
                                                                      results in a per capita format, the results show
                                                                      that the City has fewer resources available to
                                                                      serve our growing community. General
                                                                      government revenue per capita in constant
                                                                      dollars is shown in the graph to the left
                                                                      adjusted for inflation and population growth.

             Bottom line is that the City of Mount Vernon is spending less per capita to deliver essential
                     services and accomplish capital projects than it did almost a decade ago.

Employees Deliver Services:
The City is not requesting any new FTE for the 2021 budget. It will remain at 235 full-time and decrease part-
time employees down from 50 to 47. The Library eliminated three part-time employees while conducting a
reorganization of staffing.
Even though the FTE did not decrease in 2021, the City has made a decision not to fund four positions for the
year. This decision was made due to the
uncertainty of the effect of COVID-19, the
availability of full services and for the
reduction of budgeted expenditures. These
four positions, one in Finance, one in Library
and two in Parks and Enrichment Services,
will not be filled in 2021 and will be
reassessed for the 2022 budget year.
There were also two reclassification requests
that are included in the 2021 proposed budget
due to workload in the Development Services
Department and reorganizations done in the
Parks and Enrichment Services Department.

                                                          3
Strategic Goal #1
Infrastructure
Provide an adequate level of quality public facilities
in a fiscally prudent manner.
A City’s infrastructure is critical to the City’s health and safety as well as economic development and prosperity.
The City will make a $10.9 million investment in capital projects in 2021. In many respects, the City’s ability to
realize its competitive potential depends on making smart infrastructure choices.
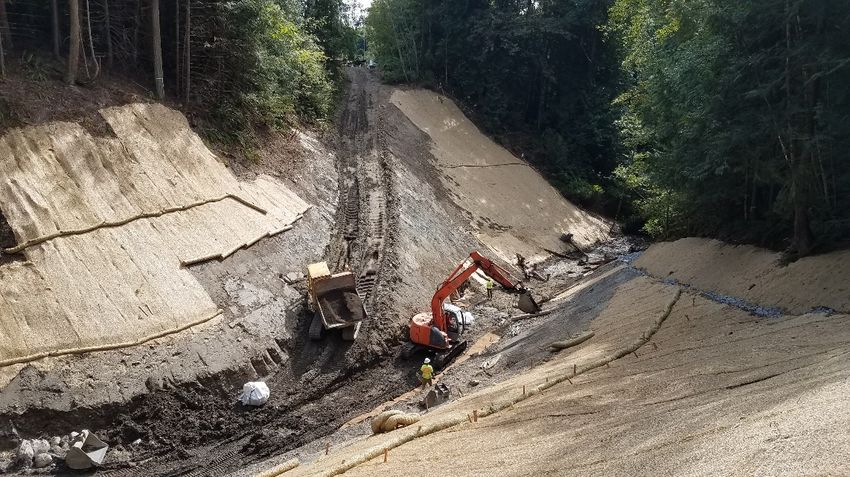
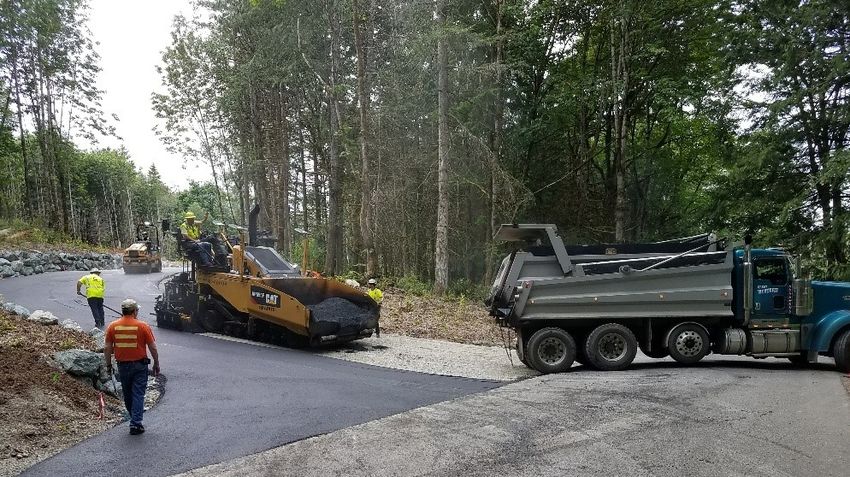
Capital Transportation Projects and the Transportation Benefit District
The Transportation division is made up of the Street Department, Arterial Street Fund, and the Transportation
Benefit District Fund. These divisions are responsible for the maintenance of the City’s 138 miles of road ways.
The passage of a Transportation Benefit District sales tax of .2% in 2016 is providing critical funding for the
maintenance of City streets that were delayed for many years during the recession. Examples of funded projects
for 2021 include:
• Freeway Drive (Cameron to College Way)
• 30th Street (College Way to Manito Drive)
• Riverside Drive Boulevard Improvement Project
• Hoag/Laventure Intersection Improvements
• Increased overlay pavement preservation program, add ADA program, fund sidewalk gap program
Fire Station 1 Replacement and Fire Stations 2 & 3 Remodels
The City is continuing the planning and funding options for the conceptual design for the Fire Station 1 replacement
and Fire Stations 2 & 3 remodels. The current Fire Station 1, built in 1964, is inadequate to provide life safety to
redevelopment planned in the entire downtown area while stations 2 and 3 are in need of remodels for efficiencies,
growth and safety measures.
A Future Library Space Re-Imagined
The City is continuing in the planning and funding options for the Mount Vernon Library Commons Project in
collaboration with Skagit County, the Library Board of Trustees and the Mount Vernon Library Foundation.
4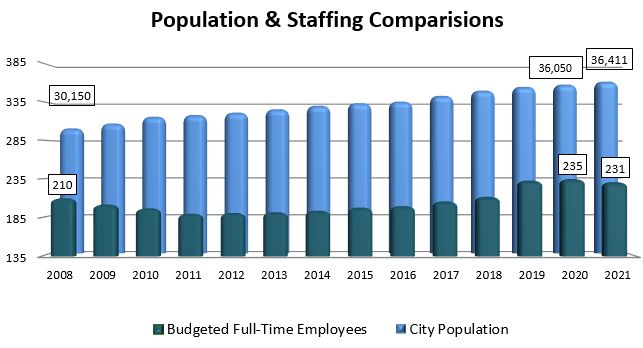
Parks Infrastructure
The 2021 budget allocates $181,362 for projects in our parks system to include continued funding for the
completion of the Little Mountain Park Bike Skills Center and Trailhead Project and for other recurring park projects.

Infrastructure Operations
Wastewater, Surfacewater and Collections services provide sewer services in our City and often are unnoticed to
our general public. These crucial departments invest significant money into compliance with Federal and State
Clean Water Act and other complex regulations. Included in $3.14 million funded projects for 2021 include:

    •   Sewer and Storm Water restoration programs (annual)
    •   Wastewater treatment upgrade
    •   Addition to the Wastewater administration building
    •   Supernatant Tank coating
    •   Rotary Drum
        Thickener
        Procurement
    •   Freeway Drive
        Drainage System
        Installation
    •   Hickox Road Culvert
        Replacement
    •   Freeway Drive storm
        water force main
        improvements

                                                          5
Strategic Goal #2
Healthy Neighborhoods
Create an action plan to address the health of our neighborhoods,
including public safety, public health and appearance.
Homelessness
The City continues to collaborate with partner agencies to address effects of homelessness and poverty on our City
streets. Many innovative programs have been adopted in the past few years including a full time social worker
position in 2017. The City has dedicated over $250,000 in efforts to address the impacts of homelessness.
Continued efforts funded in the 2021 preliminary budget include:
• Collaborate with Skagit County District Court to support the Mount Vernon Municipal Community Court –
providing a therapeutic court for those in poverty and/or homeless. This provides an alternative to jail and
offers services to prevent recidivism.
• Realize the groundbreaking for Catholic Community Services permanent supportive housing project located on
East College Way. This project will provide up to 70 units of housing for those who have been chronically
homeless.
• Continue engaging the local faith community in an effort to provide an opportunity for service and a partnership
in proposing solutions.
Housing
The City is funding continued work to update land use codes around multi-family housing as adopted in the 2016
Comprehensive Plan. In 2019, City Council adopted incentives for multi-family housing in the form of density
bonuses for a percentage of permanently affordable units Staff continues work to bring forward codes for City
Council to consider in a very thoughtful manner as to not affect the health of our existing neighborhoods. The focus
on ‘missing middle’ housing stock continues to be the logical and realistic way to increase affordable options in the
City of Mount Vernon.
Maintenance
The 2021 budget places emphasis in
funding to maintain our parks, trails
and public spaces to the level to
which our Community expects; which
encourages more users and reduces
crime and the perception of crime.
6Strategic Goal #3
A Good Place for Investment
Maintain a strong proactive position toward prosperity to promote a vibrant
business community, retain & recruit a talented workforce, a positive civic
image, and establish the City as a good place for investment.
Redevelopment
With the completion and certification of the waterfront flood protection project in 2019, the City stands at a critical
stage in the evolution of commercial and residential development in the downtown core. It is the responsibility of
City leadership to attract and work with potential development to realize the vision of our Community. To that end
the City will continue to work in the following areas:
• Advance the Mount Vernon Commons project which combines structured parking, public library and
community center.
• Work with property owners to realize benefits of FEMA Letter of Map Revision designation.
• Historic downtown revitalization development – residential, hotel and mixed use.
• Coordinate between historic downtown and south of Kincaid subarea opportunities.
• Opportunity zones – The City was awarded 3 census tracts for the Federal Government Program to incentivize
investment. The City is working with the Federal Government and Washington State Department of Commerce
to attract investment in our commercial corridor.
Fiber Optics
The Fiber Optic Network, managed by the City’s Information Services Department, has developed a fiber optic
system that encompasses over 135 public entities and more than 280 businesses in Mount Vernon, Burlington and
the Port of Skagit. The City manages the fiber and contracts with internet service providers to manage the service.
This encourages competition in the marketplace.
Now more than ever, connectivity is a vital necessity for everyday life. In the past, the fiber optic network has
successfully been marketed to technology companies as the place where they can have the technology they need
in a small city atmosphere where parking is free, office space is less expensive and yet it is in close proximity to
both Seattle and Vancouver, B.C. The ability to communicate and quickly transfer large amounts of data has been
crucial for attracting and keeping businesses and manufacturers in the area.
The City is currently expanding free Wi-Fi services through grant funds, and will continue to look for creative
solutions to close the digital divide for low income residents.
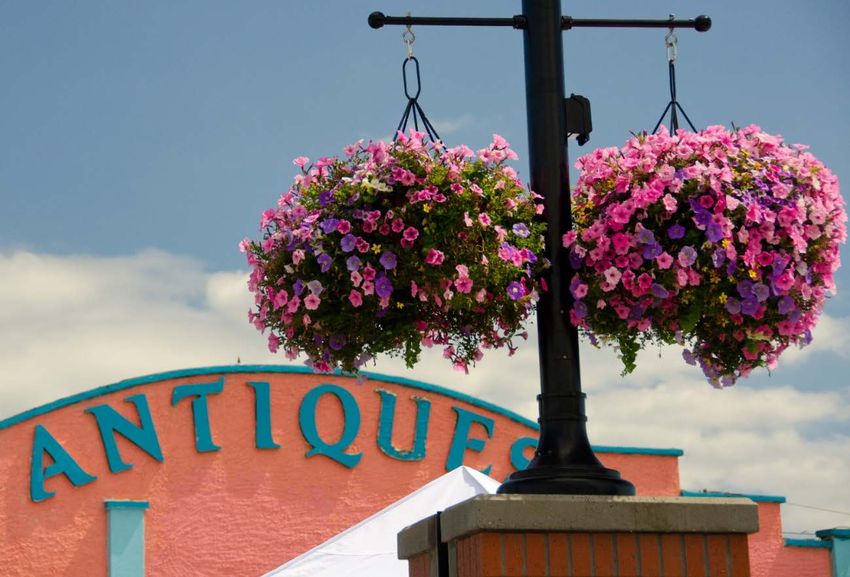
7Tourism Promotion
The Tourism Promotion funding is derived from a tax imposed on hotel/motel guests. During the course of a year,
applicants who have received funding are required to provide documentation that their activities brought tourists to
the area. The scope of activities that are funded include various items such as the Celtic Arts-Highland Games, 4th
of July Celebration, performing arts, festivals and of course the Tulip Festival.
The reduction in travel due to the COVID-10 pandemic has had a negative impact to revenues collected for this
program. The 2021 budget includes allocating most of the funding available to help with the economic recovery of
the City.
8Strategic Goal #4
Operations
Achieve efficiencies and professional services to meet our community’s
expectations through innovative management and governance.
The City staff works toward achieving efficiencies and professional services designed to meet our community
expectations through innovative management and governance. Focusing on operating strategically, not in a
reactionary manner. Each Department is expected to participate as a team in meeting the goals of the City and
community.
The City’s leadership aims to provide efficient and high-quality service to all customers and citizens by deploying
best practices in the management of personnel, finances and physical assets.
Any team accomplishes more when the goals and mission are clear and measured. Our community should expect
the most qualified employees to serve them. With the increasing competition for good talent, the City has been
working to improve employee wellness, competitive wages, streamline and standardize administrative processes
and engage with our public.
Professional Development
Administration encourages continuing professional development at all levels. The 2021 budget funds employee
skill building such as:
• Fire fighter on-going skills and emergency management leadership;
• Police training; and
• Professional organization membership for all Director level roles.
Union Groups
There are five union groups within the City of Mount Vernon’s 235 full time employees. Police commissioned
officers, Police non-commissioned staff, Fire Department Battalion Chiefs, Firefighters, and Teamsters (employees
of public works and parks). The City is committed to good working relationships with our union groups, and
engages in regular communication and relationship building.
City Shop
For the past decade the City has planned to update the city shop complex located on Cameron Way. This facility
hosts the Solid Waste Division, Streets Department, Yard Waste Facility and Equipment Department in addition to
storage of the flood wall components, salt and sand storage for inclement weather and miscellaneous public work
functions. The City will continue planning for a more consolidated shop to increase efficiencies in operations of this
facility. The 2021 budget includes funding to add 2 bays to the current shop that will accommodate larger vehicles
so city shop staff will no longer have to work outside on these vehicles.
Strategic Planning 2019 – 2021
City Council adopted broad strategic goals for 2019-2021 on October 10, 2018. Annual work plans are developed
each year by the Mayor and Department Directors. The public can view these strategic goals online at
www.mountvernonwa.gov.
9Budget Development:
At the beginning of the budget process, the departmental requests projected an operating deficit for 2021.
Subsequent revisions to the revenue forecast and cuts to the expenditures budget eliminated this deficit. The
General Fund’s preliminary budget still has a short fall and includes an estimated 1% fund reserve to balance the
budget.
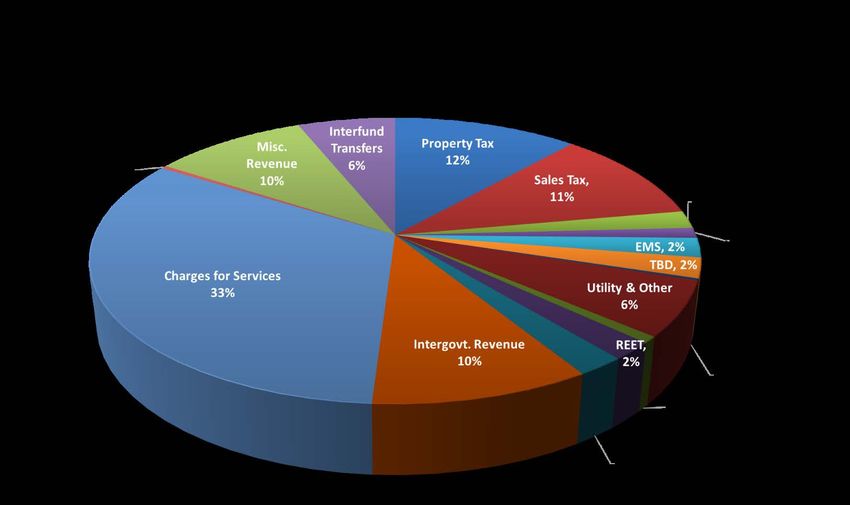
The City of Mount Vernon strives to maintain a diverse and stable revenue base to mitigate public services from
short term fluctuations in any one revenue source. The following graph depicts the composition of the general
government’s revenue sources.
Funding our Services:
Property Tax & Other Revenue
The City’s two largest sources of tax revenue are property tax and sales tax. Property tax increases are restricted
to the lesser of 1% or the rate of inflation, whichever is lower. Inflation means the percentage change in the implicit
price deflator (IPD) for the most recent 12-month period. The IPD is 0.602 this year. The City did not include this
percentage increase in the 2021 budget. $6.00
5.1000
2020 Property Tax
Property Tax $5.00
Distribution in
The City of Mount Vernon is one of 8 taxing $4.00 Mount Vernon
jurisdictions that assess taxes on our residents’ 2.9194
property tax bills. Each jurisdiction makes decisions $3.00
2.1059
on tax rates each year with some taxing jurisdictions $2.00
1.3004
requiring voter approval to establish revenue
$1.00 0.7257
amounts. The combination of these 8 taxing 0.3411 0.4197
0.0443
jurisdictions, of which Mount Vernon is one, account $0.00
for the total property taxes paid by an individual
property owner. Total aggregate tax in 2020 is
$12.96 per $1,000 of assessed valuation. The City
receives $2.1059 or 16% of that total.
10Sales Tax
During the past several years, the City has recovered from the down turn that occurred during the previous
recession. The City did finally surpass the 2007 collections in 2016 and has realized a steady increase since then.
Currently, it is unknown what the lasting effects of the COVID-19 pandemic might have on the City’s economy. The
City has chosen to take a more conservative estimate on 2021 sales tax revenues and have projected them to be
5% below the 2019 collections.
The chart below breaks out sales tax into major categories and shows variances in activity between 2018 and
2019, the most recent years with complete data. The largest percent dollar gain was in the wholesale category
while retail sales continue to represent the largest portion of sales tax revenue collected.
Sales Tax Revenue
Category as a % of % $ Change
Total Receipts 2018-2019
2018 2019
Retail 53.2% 53.6% 2.9%
Construction 12.7% 12.3% -0.9%
Food Services/Accommodations 8.4% 8.5% 2.9%
Wholesale 6.5% 7.4% 15.3%
Information 3.1% 3.0% 1.0%
All Other Categories 16.0% 15.1% -3.4%
100.0% 100.0% 2.2%
The Retail Sales category can be divided to assess the major sub-categories. Clothing showed the largest
percentage of gain from 2018 to 2019, but most categories, except Motor Vehicle & Parts, Non-Store Retailers and
Building Materials showed an overall increase in tax revenues for the same period.
Retail Sales Only
Category as a % of % $ Change
Total Receipts 2018-2019
2018 2019
Health & Personal Care 3.0% 3.1% 4.1%
Electronic & Appliances 3.7% 4.1% 15.2%
Gas Stations 2.3% 2.4% 8.3%
Clothing 1.1% 1.2% 21.4%
Non-Store Retailers 2.7% 2.5% -2.2%
Motor Vehicle & Parts 37.6% 34.5% -5.6%
Food & Beverage Stores 7.5% 7.6% 4.0%
Building Materials 13.0% 12.6% -0.3%
Furniture & Home Furnishings 2.4% 2.5% 9.7%
General Merchandise 26.8% 29.5% 13.0%
100.0% 100.0% 2.9%
Special Revenue Funds
The City has thirteen Special Revenue Funds which account for proceeds of revenue sources that are restricted for
specific expenditure purposes. These funds are related to General Government operations. Items of note include:
• The Hotel/Motel tax fund was negatively impacted by COVID-19 and available revenues were substantially
decreased. The City will make $269,950 in grants available to support and promote tourism within the City.
This is a $97,750 decrease from the 2020 budget and fund reserves will be utilized.
11• The Transportation Benefit District (TBD) Fund has a $1.7 million budget for 2021 to support transportation
projects. This is a decrease from the 2020 budget of $565,935.
• The Fiber Optics Fund has a $326,529 budget for 2021 to support the fiber needs of the City and
surrounding area. This is an increase of about $26,687 from the 2020 budget.
• The Arterial Street Fund has a budget of $2.6 million to fund various projects like the improvements at
Freeway Drive (Cameron to College), 30th St (College to Manito), Hoag/Laventure intersection
improvements and the Riverside Drive Boulevard Improvement project.
Real Estate Excise Tax Revenue
Monthly real estate excise tax (REET) receipts (0.5% of the value of real estate transactions) represent a vital
funding source for debt service, various road projects and other capital projects. The following chart illustrates the
impact of the previous recession on REET revenues, beginning with a precipitous drop in 2008 with 2011
representing the bottom of the decline. Collections began improving in 2012 and have continued through 2017.
Estimates for 2021 are estimated within a conservative range and do not account for any large sales that could
potentially happen.
Real Estate Excise Tax Revenue
2,000,000
1,794,496
1,800,000
1,600,000 1,455,195
1,373,270 1,400,000
1,400,000
1,153,308
1,200,000
1,000,000
790,094
800,000
600,000 416,642
400,000
200,000
-
2007 2008 2009 2010 2011 2012 2013 2014 2015 2016 2017 2018 2019 2020 2021
est. est.
Capital Project Funds
The total budgeted capital expenditures are $12.8 million for 2021. Major items include:
• Equipment Rental and Reserve Fund - $1.97 million to purchase capital equipment included in the City’s
equipment replacement schedule.
• Arterial Street Fund - $2.6 million to fund major transportation projects throughout the City.
• Transportation Benefit District (TBD) - $1.7M also to support major transportation projects.
• REET I - $876,195 budget includes debt service payments for the Riverside Bridge and $500,000 for the
Local Infrastructure Financing Tool (LIFT) program matching funds for the Library Commons project.
• REET II – includes $551,000 for City street improvements.
• Parks Capital Funds - $181,362 for parks related capital projects.
• Utility Capital Funds - $3.4 million for capital projects related to the City’s Wastewater, Solid Waste and
Surface Water utilities.
Debt Service Funds
The City does not have any active Debt Service Funds, although, it does make debt service payments for the
Wastewater Treatment Plant upgrade but these amounts are included in the Utilities operating budgets and are not
a separate debt service fund. The Riverside Bridge debt payments are allocated out of the revenue that the City
receives from REET I and have a remaining balance of $115,000 as of the end of 2020. The 2021 budget includes
the final payment for this loan.
12Proprietary Funds
The City has three enterprise funds and two capital sub-funds that are self-supporting and expected to operate like
private businesses, and two internal service fund that provides vehicle maintenance and repairs for the City’s fleet
and for the maintenance of City owned buildings. Items of note include:
• The Wastewater, Solid Waste and Surface Water Utilities budget had an overall decrease of $437,289 due
mainly to a decrease in Solid Waste’s recycling contract of $460,000. Equipment Rental and Reserve costs
decreased by $341,159. Their department’s salaries and benefits line items, driven by an increase for
healthcare insurance premiums as well as union negotiated wage and benefit increases.
• The Surface Water Utility Fund had a rate study analysis completed in 2017 which resulted in a recommended
rate increase in 2018, this represented the first rate increase since 1999. The previous rate of $10.00 per
equivalent service unit (ESU) per month was changed to $11.00 in 2019, and will be $12.00 in 2020 and then
annual CPI adjustments for 2021 and subsequent years.
• The two Wastewater Utility capital sub-funds have $2.9 million budgeted for 2021 Wastewater projects which
includes an $875,000 contribution for the addition to the Wastewater treatment plant administration building.
• The Equipment Rental and Reserve fund will purchase (replace) 19 vehicles or major pieces of equipment
per the equipment replacement schedule. This fund is also used to accumulate funds to purchase servers,
computers and work stations.
The Utility departments strive to preserve essential services for their customers and maintain regulatory
compliance, while minimizing the cost of service.
2021 Proprietary Fund Expense
$21,646,006
Debt
$2,151,444 Capital
$3,433,400
Interfund Charges Solid Waste
for Services $1,489,370
$3,679,628
Salaries
$3,893,096
Surface Water
Wastewater $507,221
$1,896,505
Operations & Supplies
$8,488,438
132021 Revenue Summary: Revenue by Type
Revenue 2019 2020 2021 2020 to 2021 2020 to 2021
Source Budget Budget Budget Change % Change
Property Tax 7,810,741 8,029,741 8,099,977 70,236 0.9%
Sales Tax 7,600,000 7,800,000 7,400,000 (400,000) -5.1%
Utility Tax 4,364,857 4,218,537 4,357,292 138,755 3.3%
Transportation Benefit District 1,600,000 1,800,000 1,600,000 (200,000) -11.1%
Real Estate Excise Tax 1,600,000 1,400,000 1,400,000 0 0.0%
EMS 1,446,000 1,489,380 1,534,061 44,681 N/A
Public Safety Sales Tax 1,394,000 1,394,000 1,394,000 0 0.0%
Criminal Justice 777,000 835,000 815,000 (20,000) -2.4%
LIFT 0 500,000 500,000 0 NA
Hotel/Motel 295,000 295,000 150,000 (145,000) -49.2%
Total Taxes 26,887,598 27,761,658 27,250,330 (511,328) -1.8%
Licenses & Permits 1,546,200 1,546,250 1,523,022 (23,228) -1.5%
Charges for Services 22,423,647 23,030,450 22,961,855 (68,595) -0.3%
Intergov't (State & Local Sources) 11,487,458 6,157,361 6,877,823 720,462 11.7%
Fines & Forfeits 281,800 289,300 245,950 (43,350) -15.0%
Miscellaneous Revenue 6,356,581 6,363,100 6,750,644 387,544 6.1%
Interfund Transfers 3,731,865 3,933,134 4,280,362 347,228 8.8%
Budgeted Totals 72,715,149 69,081,253 69,889,986 808,733 1.2%
Budgeted Fund Balance 2,506,156 1,018,034 1,282,333 264,299 26.0%
Total 75,221,305 70,099,287 71,172,319 1,073,032 1.5%
2021 Revenue Estimates - $69,889,986
Charges for Services include:
• Sewer, Garbage & Storm Water Utilities
• Ambulance Transports
• Zoning/Subdivision & Engineering Fees
• Overhead and Interfund Charges
14Fund Balance Reconciliation - Summary of All Funds
Estim ates Budget Fund Bal.
Fund Fund Balance 2020 2020 Est Fund Bal 2021 2021 Est. Balance Budgeted
Dept
No. City Fund Dec 31, 2019 Revenue Expenditures Dec 31, 2020 Revenue Expenditures Dec 31, 2021 in 2021
001 General Fund 4,277,025 30,555,903 29,364,528 5,468,400 29,670,924 30,041,154 5,098,170 370,230
101 City Street 429,569 2,536,268 2,544,591 421,246 2,373,692 2,409,042 385,896 35,350
103 Parks/Recreation 284,563 2,136,457 1,675,357 745,663 1,722,020 2,125,317 342,366 403,297
104 Library 249,419 1,314,858 1,064,090 500,187 1,168,479 1,438,747 229,919 270,268
Total Gov't Op. Funds 5,240,576 36,543,486 34,648,566 7,135,496 34,935,115 36,014,260 6,056,351 1,079,145
102 Arterial Street 984,403 3,165,075 3,290,299 859,179 2,586,000 2,551,000 894,179 (35,000)
105 Paths and Trails 101,526 4,287 - 105,813 4,319 - 110,132 (4,319)
106 Tourism Promotion 183,051 140,400 197,336 126,115 150,400 269,950 6,565 119,550
107 Little Mountain Cap Res 8,878 36,000 44,800 78 46,000 46,000 78 -
109 Crime Prevention 48,508 16,118 12,262 52,364 14,160 12,400 54,124 (1,760)
110 Government Access TV 310,591 70,000 115,219 265,372 70,000 84,219 251,153 14,219
112 Criminal Justice Assistance 7,890 153,125 150,000 11,015 157,176 158,000 10,191 824
113 Municipal Arts Fund 175 2,524 2,524 175 - - 175 -
115 Parks Capital Reserve 79,860 145,235 127,762 97,333 133,235 85,362 145,206 (47,873)
117 TBD Fund 270,890 2,152,645 2,277,115 146,420 1,602,645 1,749,065 (0) 146,420
118 Fiber Optics Fund 262,872 339,654 269,076 333,450 344,900 326,529 351,821 (18,371)
119 Critical Area Enhancement 117,327 1,679 - 119,006 5,300 30,000 94,306 24,700
120 Lincoln Commercial Block 129,970 60,230 23,000 167,200 60,200 202,000 25,400 141,800
301 Library/CC/Parking 799,104 1,104,018 301,000 1,602,122 1,003,000 800,000 1,805,122 (203,000)
304 REET I - Capital Improvement 667,820 756,010 786,770 637,060 705,800 876,195 466,665 170,395
306 Fire Station Projects 120,172 1,500 - 121,672 1,719,283 928,686 912,269 (790,597)
311 Park Impact Fees 189,406 106,200 70,000 225,606 91,000 50,000 266,606 (41,000)
312 Fire Impact Fees 227,769 70,754 76,185 222,338 60,500 25,000 257,838 (35,500)
313 Traffic Impact Fees 289,231 143,167 - 432,398 122,000 223,000 331,398 101,000
314 REET II - Streets (181,324) 750,000 565,000 3,676 701,000 551,000 153,676 (150,000)
328 PW Facility Fund 213,905 100,000 - 313,905 700,000 - 1,013,905 (700,000)
401 Wastewater Utility (WC) 4,246,981 9,100,302 9,099,711 4,247,572 9,124,992 9,551,637 3,820,927 426,645
402 Solid Waste Utility (WC) 1,452,921 6,202,337 7,048,559 606,699 5,947,150 6,532,326 21,523 585,176
403 Surface Water Utility (WC) 496,753 2,770,100 2,524,010 742,843 2,797,750 2,710,043 830,550 (87,707)
411 Sewer Facility Expansion 2,647,837 805,113 764,500 2,688,450 662,000 927,000 2,423,450 265,000
412 Sewer Capital Reserve 3,779,591 1,006,814 1,537,500 3,248,905 1,006,000 1,925,000 2,329,905 919,000
501 Equipment Rental (WC) 6,365,882 4,402,742 2,819,227 7,949,397 4,355,072 3,195,647 9,108,822 (1,159,425)
502 Facility Renewal Fund 88,232 100,000 100,000 88,232 200,000 285,000 3,232 85,000
512 LEOFF I Health Care Res 441,077 11,362 - 452,439 11,000 40,000 423,439 29,000
611 FR&P 341,495 55,044 84,000 312,539 61,989 111,000 263,528 49,011
600 Managerial Funds - 512,000 430,900 81,100 512,000 912,000 (318,900) 400,000
Totals 29,933,369 70,827,921 67,365,321 33,395,969 69,889,986 71,172,319 32,113,636 1,282,333
15Conclusion
Our City is grateful for residents’ support and excellent partnerships that help us achieve quality of life for our
region. Specific thank you to Skagit County Public Health for their role in leading our community through a global
pandemic.
You are encouraged to participate in the budget discussions to include attending the VIRTUAL Public Hearing at
the City Council Meeting:
• Thursday, November 12, 2020 at 6:00 pm with a formal public budget presentation. See published agenda
for how to participate.
As Mayor, I sincerely appreciate all of our City staff that have fulfilled our mission this past year. The extraordinary
circumstances of 2020 will continue in 2021. Not forever, but for now. Through it all, we believe that our example of
good government will influence others to join us in an attitude of integrity and vitality. I would like to extend special
gratitude to Mr. Doug Volesky, Finance Director, for his critical and professional guidance in the preparation of this
budget and accomplishments in the finance department during this past year with the City.
The phrase “we are in this together” gets thrown around a lot these days, but the sentiment could not be closer to
reality for us. Our hope is provide the residents of Mount Vernon with professional, efficient services to create a
lifetime positive difference for our community.
Be safe for yourselves and others,
Jill Boudreau, Mayor
mvmayor@mountvernonwa.gov
360-336-6211
16You can also read