2021 FULL YEAR RESULTS - MONDAY, FEBRUARY 21, 2022 - Icade
←
→
Page content transcription
If your browser does not render page correctly, please read the page content below
DESIGNING, BUILDING,
MANAGING AND INVESTING
in cities, neighbourhoods and buildings
that are innovative, diverse, inclusive and connected
with a reduced carbon footprint.
Desirable places to live and work.
This is our ambition. This is our goal.
This is our Purpose.
2021
FULL YEAR
RESULTS
MONDAY, FEBRUARY 21, 2022
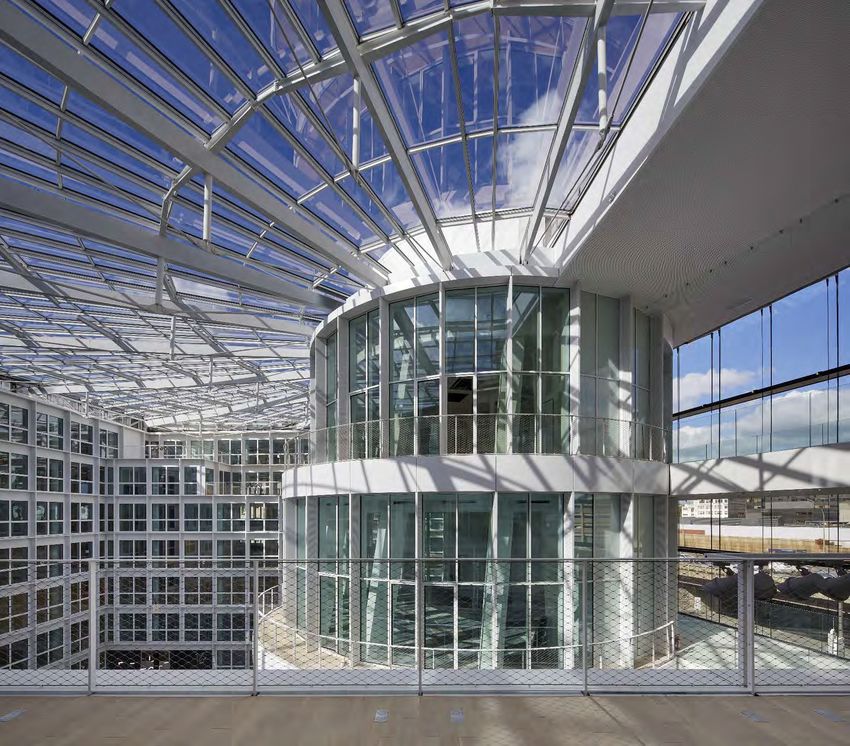
EDENN
La Défense, Hauts-de-Seine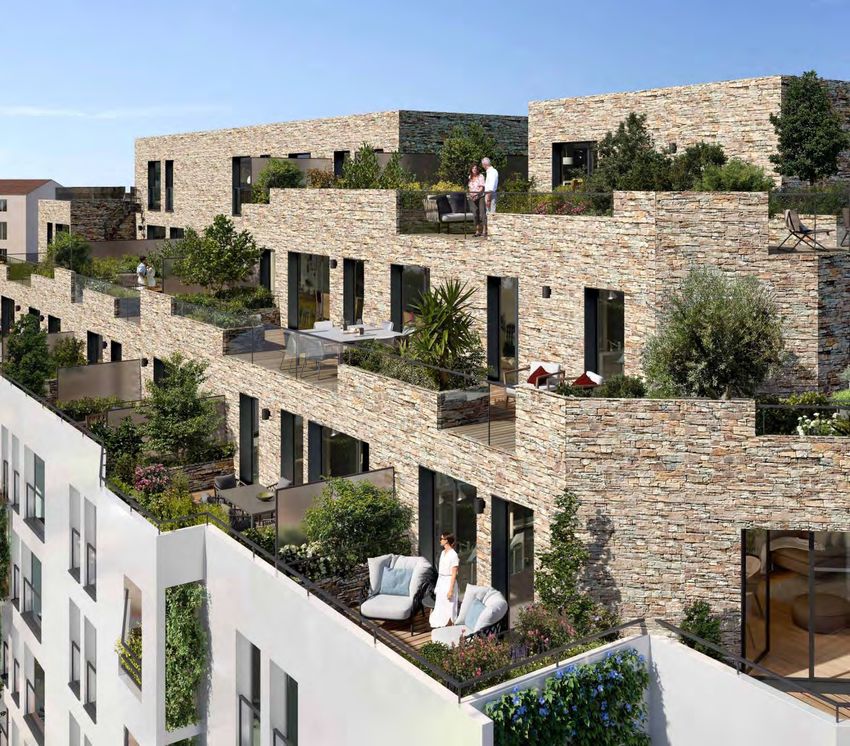
DISCLAIMER

This presentation is not an offer or an invitation to sell or exchange
securities, or a recommendation to subscribe, buy or sell Icade securities.

Distribution of this document may be restricted in certain countries
by legislation or regulations. As a result, any person who comes into
possession of this document should familiarise themselves and comply with
such restrictions. To the extent permitted by applicable law, Icade excludes
all liability and makes no representation regarding the violation of any such
restrictions by any person.

                                                                                  2021 FULL YEAR RESULTS
                                                                                MONDAY, FEBRUARY 21, 2022   2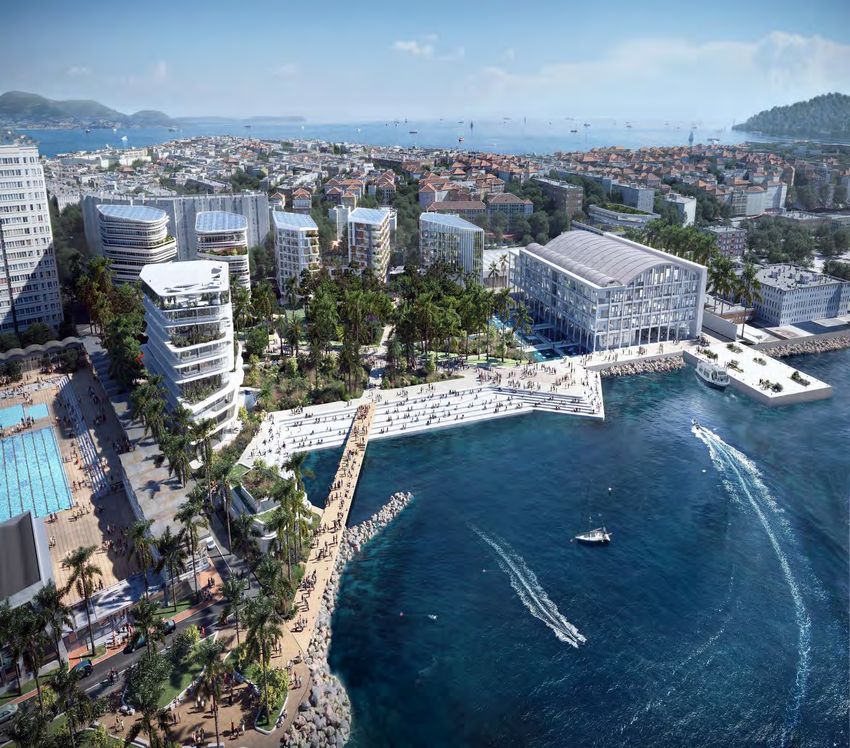
Introduction

         1   Key indicators & 2021 Highlights

         2   Performance of Business Lines

AGENDA
         3   2021 Financial Results

         4   CSR and European Taxonomy reporting

         5   Outlook & 2022 Priorities

             Appendices

                                                     2021 FULL YEAR RESULTS
                                                   MONDAY, FEBRUARY 21, 2022   3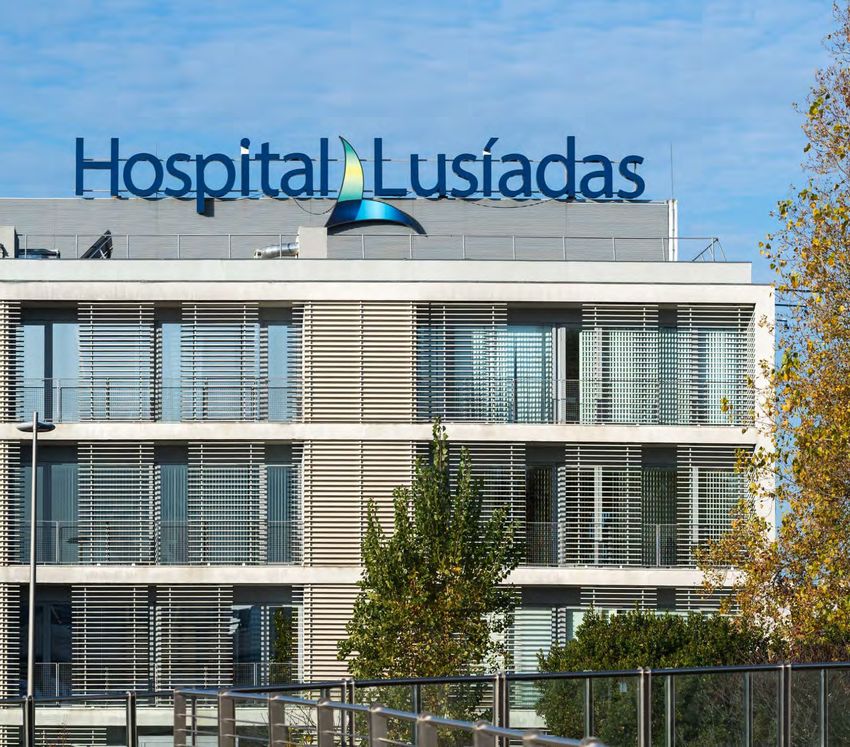
Introduction

ORIGINE                      2021 FULL YEAR RESULTS
Nanterre, Hauts-de-Seine   MONDAY, FEBRUARY 21, 2022   4
INTRODUCTION

                 CHAIRMAN’S INTRODUCTION

             Solid 2021 FY results, above expectations…

           Icade has coped with the Covid-19 crisis
                and its complex environment

      We stick to our strategic plan and our focus on ESG

The Board is fully committed and fully aligned with management

                                                                   2021 FULL YEAR RESULTS
                                                                 MONDAY, FEBRUARY 21, 2022   5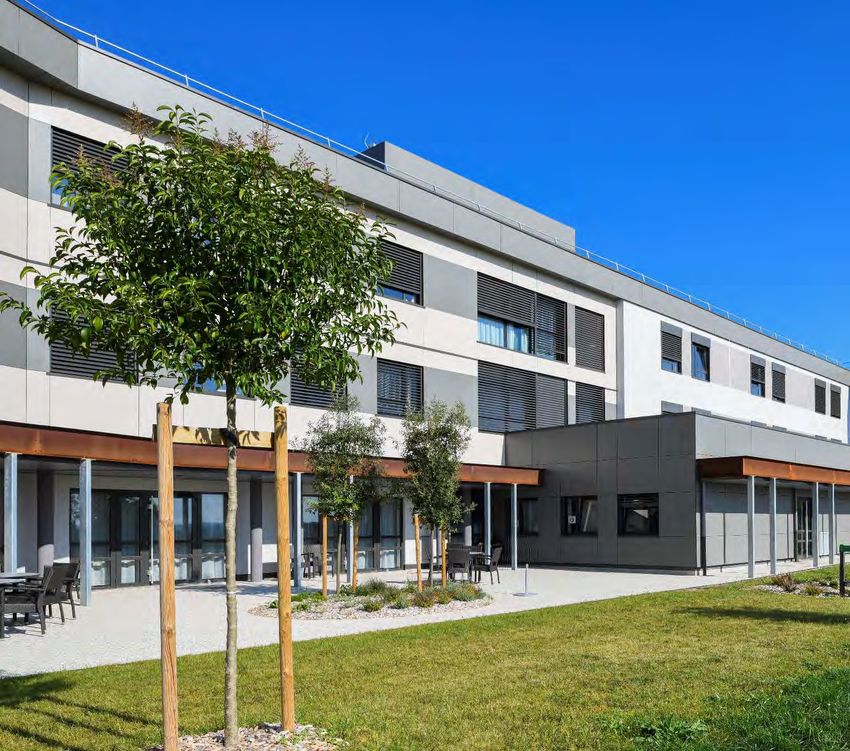
INTRODUCTION

            WHAT’S NEW IN THIS PRESENTATION?

1     2021 Financial Results prepared on a fair value basis

2         P&L also presented on a Group share basis

3   First European Taxonomy reporting: on eligible activities

                                                                  2021 FULL YEAR RESULTS
                                                                MONDAY, FEBRUARY 21, 2022   6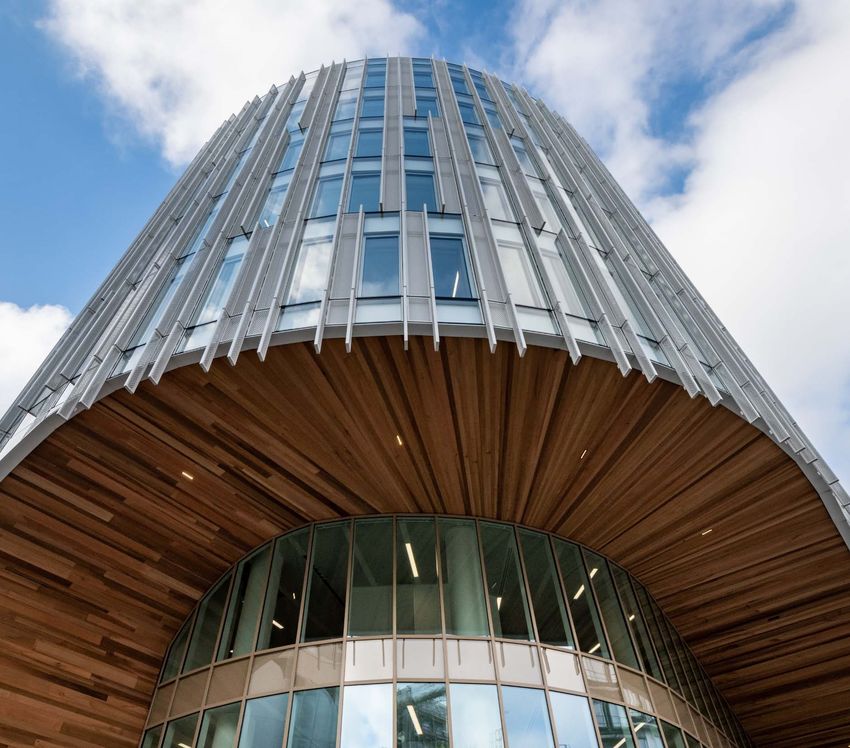
INTRODUCTION – KEY INDICATORS & 2021 HIGHLIGHTS

           2021 RESULTS WELL ABOVE GUIDANCE AND CONSENSUS

          2021 NCCF
                                                     NCCF significantly above guidance
  €390m          €5.19 per share                     Back to 2019 level
   +8.8%              +7.2%

EPRA NAV NDV as of December 2021                     Double digit NAV NDV TSR: c.11%
                                                     Back to pre crisis level
  €6.9bn         €90.6 per share                               +11.0%                        +10.8%
                                                                         +6.6%
   +8.6%              +6.1%
                                                                                    (1.1%)
                                                                2018      2019      2020       2021
                                                                        NNNAV TSR    NAV NDV TSR

                                                                                                        2021 FULL YEAR RESULTS
                                                                                                      MONDAY, FEBRUARY 21, 2022   7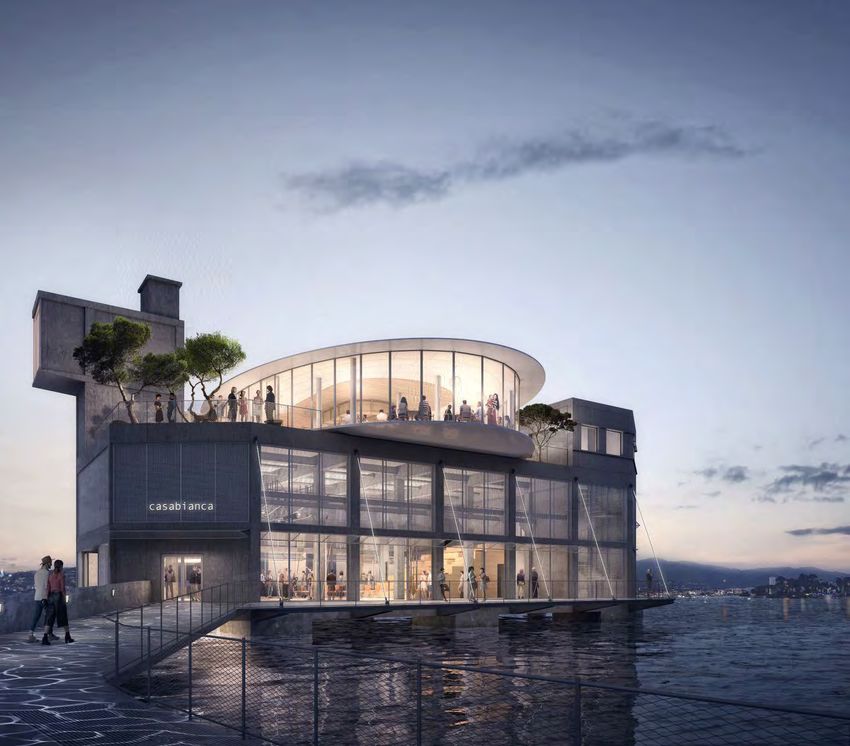
One of the most important
   urban transformation
  projects in Europe, in a
 former industrial area of
 Paris, which will host the
  University of Chicago’s
    new Centre in Paris.

                                                      1
                                       Key Indicators
                                      & 2021 Highlights

                              UNIVERSITY OF CHICAGO         2021 FULL YEAR RESULTS
                              Paris, 13th district        MONDAY, FEBRUARY 21, 2022   8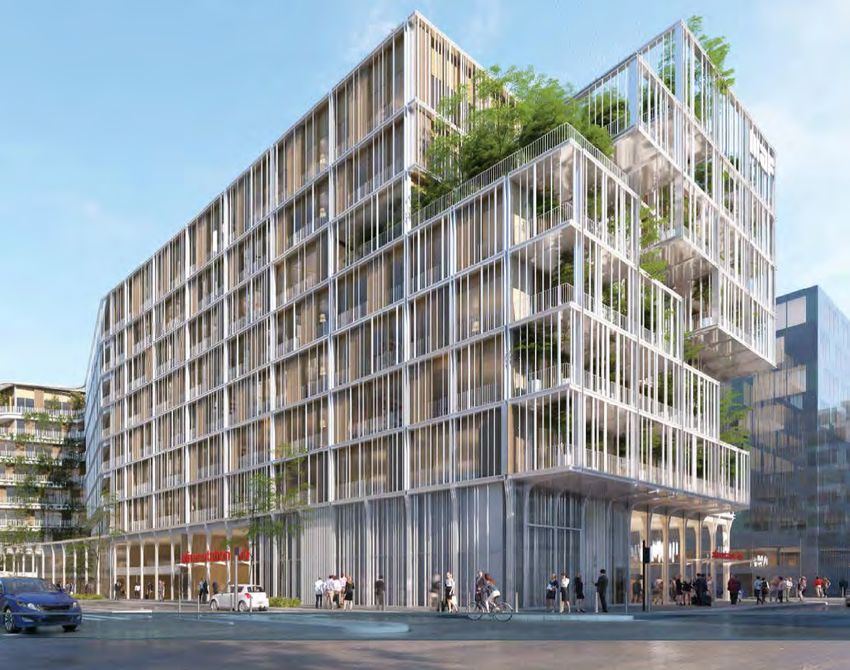
1. KEY INDICATORS & 2021 HIGHLIGHTS

   SOLID 2021 INDICATORS
                             +2.9%, -0.5% LFL(1)                                                                    +31.8%                                                -19 bps

                                                                                                                                                                                                     GROUP INDICATORS
PROPERTY INVESTMENT

                                                                                    PROPERTY DEVELOPMENT

                                                                                                                                                  LIABILITIES
                                 €551.2m                                                                       €985.1m                                                  1.29%                                                        +7.2%
                             vs. €535.9m as of 12/31/2020                                                  vs. €747.4m as of 12/31/2020                           vs. 1.48% as of 12/31/2020
                           GROSS RENTAL            INCOME(2)                                                        REVENUE(4)                                  AVERAGE COST OF DEBT                                      €5.19 per share
                                                                                                                                                                                                                        vs. €4.84 per share as of 12/31/2020
                                         +1.4%                                                                                                                                                                                     €389.7m
                                                                                                                    +€22m                                                 STABLE
                            €4.81 per share                                                                                                                                                                                      GROUP NCCF
                         vs. €4.74 per share as of 12/31/2020
                                         €361.1m
                                                                                                                €24.2m                                                5.9 years
                                                                                                            vs. €2.5m as of 12/31/2020                           vs. 5.9 years as of 12/31/2020
                                 EPRA EARNINGS
                                                                                                             NCCF (GROUP SHARE)                                 AVERAGE DEBT MATURITY                                                +6.1%
                              +3.8%, +0.7% LFL
                                                                                                                    +20.2%                                                STABLE                                           €90.6 per share
                                €12.2bn                   (3)
                                                                                                                 €1.7bn                                                 40.1%
                                                                                                                                                                                                                        vs. €85.4 per share as of 12/31/2020
                                                                                                                                                                                                                                     €6.9bn
                             vs. €11.8bn as of 12/31/2020
                                                                                                           vs. €1.4bn as of 12/31/2020                            vs. 40.1% as of 12/31/2020
                                                                                                                                                                                                                                   EPRA NDV
                                     PORTFOLIO                                                                     BACKLOG                                            LTV RATIO
                                                                                                                                                                 (VALUE INCL. DUTIES)
                      -350 bps LFL                      stable
                       88.1%                          100%                                                                                New: All P&L indicators presented on a Group share basis
                       vs. 92.5% as of               vs. 100% as of
                        12/31/2020                    12/31/2020
                           OFFICE                     HEALTHCARE
                        FINANCIAL OCCUPANCY RATE                                                                                     2021 NCCF at €389.7m, back to pre-crisis level
  (1)        LFL change for Offices, Business parks and Healthcare GRI
  (2)        Gross rental income presented on a Group share basis. Data on a 100% basis available in the appendices                                                                                                                  2021 FULL YEAR RESULTS
  (3)        Icade share, excluding duties. Portfolio value on a 100% basis: €15.5bn as of 12/31/2021 vs. €14.7bn as of 12/31/2020                                                                                                 MONDAY, FEBRUARY 21, 2022   9
  (4)        Economic revenue available in the appendices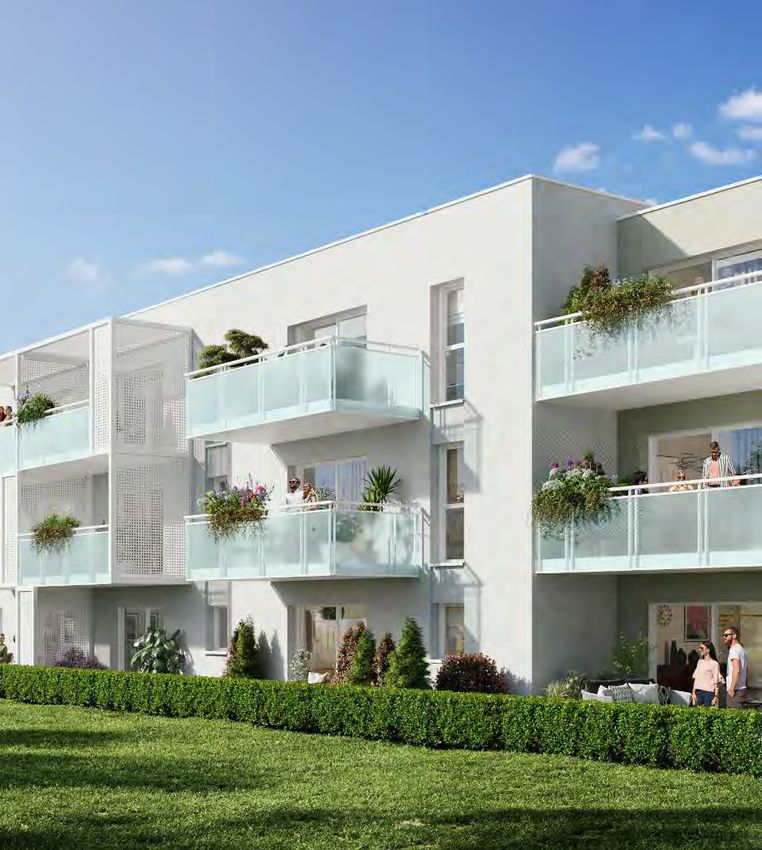
1. KEY INDICATORS & 2021 HIGHLIGHTS

2021 MAIN ACHIEVEMENTS 1/2

                                      Office Property Investment                                                                                                                        Healthcare Property Investment

      Leasing activity: a record year
      • 266,000 sq.m: total floor area of leases signed                                                                                                     Accelerated growth & diversification
          or renewed in 2021                                                                                                                                •   2021 investment volume: c.€910m(2) (cash out: €740m)
                                                                                                                                                            •   International portfolio x2 in a year (14%(3) of GAV)
      Dynamic asset rotation                                                                                                                                •   2 new countries: Spain and Portugal
      • 2021 disposal plan completed: €507m;                                                                                                                •   First investments in acute care in Europe (Italy, Portugal): c.€300m
        +10.8% premium to December 2020 GAV
      • Value add acquisitions: €243m                                                                                                                       WALB up +c.1 year
                                                                                                                                                            Significant renewals: 21 leases, representing c.€55m(4)
      Value creating pipeline                                                                                                                               and +1.3 year in WALB
      • 4 major completions
        o >115,000 sq.m; value creation: €232m(1)
                                                                                                                                                            IPO postponed
                                                                                                                                                            Allocable demand: c.€700m at €115 per share
        o Equity IRR at completion: 15.2%

                               We are more than resilient                                                                                                                        We are delivering the roadmap
(1)   Total value creation c. €100m generated in 2021
(2)   Including acquisitions and greenfield projects signed in 2021 + capex for extensions and refurbishments in 2021 + other capex in 2021. As a reminder, the amount of €880m previously reported for 2021 did not include any Q4 capex     2021 FULL YEAR RESULTS
(3)   Group share                                                                                                                                                                                                                           MONDAY, FEBRUARY 21, 2022   10
(4)   Headline rental income
1. KEY INDICATORS & 2021 HIGHLIGHTS
2021 MAIN ACHIEVEMENTS 2/2
Property Development CSR Financials
Strong business momentum New Green Financing Sound debt indicators
in 2021 Framework • Cost of debt at 1.29%
• Economic revenue(1) up c.+30% Office Property carbon footprint • Stable maturity at 5.9 years
to €1.1bn (+11% vs. 2019) reduction:
-30% in 2021 vs. 2015 January 2021 bond issue:
• New orders: a record year ahead of the 2025 target (-45%) €600m, 10 years, coupon: 0.625%
6,004, +12% vs. 2020; +18% vs. 2019 (reclassified as a Green bond in Q4)
outperforming the market Leading position confirmed in
(-12% vs. 2019) ESG rating agencies’ rankings
Hedging Policy:
• Forward indicators well Icade: 1st in the Le Point Active hedging management in 2021:
oriented: Backlog(2) at €1.7bn, ranking of the most responsible • Hedging rate as of December 2021: 97%
up 20% companies • Hedging rate >85% (over the next3 years)
We are gaining market share
2021 FULL YEAR RESULTS
(1) On 100% basis MONDAY, FEBRUARY 21, 2022 11
(2) Residential and officeIcade was selected to develop a
project that will have a very low
impact on the environment and
be energy self-sufficient during
the summer months.
2
Performance
of Business Lines
PIPADY, LOT 2 2021 FULL YEAR RESULTS
Toulon, Var MONDAY, FEBRUARY 21, 2022 122.1
Office Investment
Refurbishment project
completed in Q3 2021:
potential annual rental
income of €11.2m, +20%
vs. pre-refurbishment.
FRESK
Paris, 15th district 2021 FULL YEAR RESULTS
& Issy-les-Moulineaux MONDAY, FEBRUARY 21, 2022 132.1. PERFORMANCE OF BUSINESS LINES – OFFICE INVESTMENT
ICADE OFFICE LEASING ACTIVITY: A VERY STRONG 2021
A record year A tenant base that remains solid
266,000 sq.m above the 5-year average 72% 99%
Rent collection rate
Total floor area of leases signed CAC 40, SBF 120, other large companies as of December 31, 2021
or renewed since January 1 and government agencies
Securing >€72m i.e. 17% of the Office
Division’s annual rental
in annual rental income income
Park View financial
6 years Total WALB: +0.4 year
to 4.5 years
occupancy rate:
WALB for leases
signed or renewed
95.3%, +48 pps
since January 1 over 12 months
Strong asset management activity in 2021
PARK VIEW
Villeurbanne, Rhône
2021 FULL YEAR RESULTS
MONDAY, FEBRUARY 21, 2022 142.1. PERFORMANCE OF BUSINESS LINES – OFFICE INVESTMENT
ACTIVE DEVELOPMENT PIPELINE & ASSET ROTATION
A dynamic and value creating pipeline Active & successful asset rotation
2021 disposal plan completed Value-add acquisitions
4 major completions in 2021 (100% leased)
>115,000 €232m(1) €507m +10.8% €243m
sq.m value creation
to date
Total 2021 YTD disposals
4 assets
Average price above NAV
as of Dec. 2020
Floor area completed
Equity IRR at completion: 15.2% LATÉCOÈRE – Toulouse, Haute-Garonne
Millénaire Business Park(2):
Track record in creating value
5 new projects launched by converting our land bank
Equity IRR at completion: 10.3%
c.50,000 c.€450m Total value creation from the Millénaire
sq.m Total investment
€300m remaining
to be invested
1 to 4 buildings: €265m (based on
cumulative disposals of €735m)
Floor area launched
MFACTORY – Marseille, Bouches-du-Rhône
Focused on creating value through development and asset rotation
2021 FULL YEAR RESULTS
(1) Incl. €100m value creation generated in 2021 MONDAY, FEBRUARY 21, 2022 15
(2) Millénaire 2 and 3 buildings sold in 2015 - Millénaire 1 building sold in April 2021 – Millénaire 4: preliminary agreement signed in 20212.1. PERFORMANCE OF BUSINESS LINES – OFFICE INVESTMENT
OFFICE PORTFOLIO VALUED AT €8.4bn (GROUP SHARE), €8.9bn (100% BASIS)
2021 Change in fair value - Office Investment Very positive trends within the portfolio
(Group share / excluding duties / in €m)
• Nanterre-Préfecture area: +4% LFL
-1.7% • Portfolio in regional cities(3): +4% LFL
on a reported basis • Labs and small business premises
(20% of Rungis business park(3)): +11% LFL
8,498 400 8,350
(83)
(464)
-1.0%
LFL
(1) (2)
FV as of Disposals Investments LFL change FV as of
12/31/2020 & others 12/31/2021
Resilient office portfolio value
FRESK
Paris, 15th district, Issy-Les-Moulineaux
(1) Fair value as of 12/31/2020 of assets sold during the period 2021 FULL YEAR RESULTS
(2) Includes, among others, pipeline investments, acquisitions, works to operating assets and changes in ownership interests MONDAY, FEBRUARY 21, 2022 16
(3) Operating assetsSur Moreau PAC facility completed
in June 2021.
Icade Santé relied on the expertise of
Icade Promotion, which carried out the
construction under a property
development contract.
2.2
Healthcare Investment
SUR MOREAU PAC FACILITY 2021 FULL YEAR RESULTS
Saintes, Charente Maritime MONDAY, FEBRUARY 21, 2022 172.2. PERFORMANCE OF BUSINESS LINES – HEALTHCARE INVESTMENT
FURTHER GROWTH IN RENTAL INCOME
Rental income: steady growth, predominance of acute care facilities
€188.4m +8.2% 86%
Rental income Change in GRI Contribution of acute
(Group share) & post acute care
Continued tenant diversification, WALB up
2 new countries
Spain & Portugal
8.2 yearsWALB
100%
Financial occupancy rate
PRIVATE HOSPITAL – GRUPPO LA VILLA
Emilia-Romagna, Italy
4 new tenants (+0.8 year mainly due
to 2021 renewals)
(best-in-class acute care operators)
International exposure x2 at 14%
Contribution to GAV in Contribution to GAV in
Group share 2021 (%) 2020 (%)
France 86% 92%
International 14% 8%
AMBRUSSUM PAC FACILITY
Lunel, Clinipole - Hérault
• Robust and growing cash flows
• Increasing international exposure 2021 FULL YEAR RESULTS
MONDAY, FEBRUARY 21, 2022 182.2. PERFORMANCE OF BUSINESS LINES – HEALTHCARE INVESTMENT
A DYNAMIC YEAR: 2 NEW COUNTRIES (SPAIN & PORTUGAL) ADDED TO THE PORTFOLIO
2021 volume of investment at c.€910m, >60% abroad
(of which c.€740m cash out in 2021)
The remaining part consisting of preliminary agreements & greenfield developments
Acquisitions and greenfield projects
12 assets acquired 2 nursing homes
acquired
for €209m for €62m Strong partnerships Breakdown of 2021 investments
+ 2 facilities under with leading healthcare providers
+ 3 facilities under
development development
for €41m International France
for €55m
62% 38%
Long-term care Acute & post acute care
Ongoing diversification c.44% c.56%
16 assets acquired
4 acute for €191m • Tenant base
care facilities • First investments Acquisitions & capex Greenfield
+ 1 facility under
for €213m 3 nursing homes a preliminary in acute care abroad 81% 19%
under a preliminary agreement
agreement for €12m
for €32m
Nearly 30% of the €3bn investment plan (2021 – 2025) completed, ahead of our roadmap
2021 FULL YEAR RESULTS
MONDAY, FEBRUARY 21, 2022 19
On a 100% basis2.2. PERFORMANCE OF BUSINESS LINES – HEALTHCARE INVESTMENT
PORTFOLIO VALUED AT €3.9bn (GROUP SHARE), €6.7bn (100% BASIS)
2021 Change in fair value - Healthcare Investment
(Group share / excluding duties / in €m) • Portfolio value up +c.€600m (Group share)
+18.0% • LFL increase +5.0%, reflecting ongoing yield compression
on a reported basis 3,891 • Further continued investments in acute care facilities,
with first-ever investments in Italy and Portugal
164
434 637
3,298
(5)
458
+5.0% 3,254
2,839 LFL
FV as of Disposals
Disposals(1)
(1) Investment
Investments& Like-for-like
LFL change FV
FV as
as of
of
31/12/2020
12/31/2020 &Others
others(2)
(2) 31/12/2021
12/31/2021
PRIVATE HOSPITAL OPERATED BY HPA SAUDE IN LAGOS PRIVATE HOSPITAL OPERATED BY GVM
Acute and post acute care Nursing homes Portugal’s Algarve region Liguria, Italy
Valuations of healthcare assets: reflecting liquidity and strong appetite for the asset class
2021 FULL YEAR RESULTS
(1) Fair value as of 12/31/2020 of assets sold during the period MONDAY, FEBRUARY 21, 2022 20
(2) Includes, among others, pipeline investments, acquisitions, works to operating assets and changes in ownership interests2.3
Property Development
Icade was selected to develop
« The future of Toulon harbour »
projects, that will benefit from the
site’s many advantages by
developing a network using
renewable energy.
TOULON HARBOUR, 2021 FULL YEAR RESULTS
Provence-Alpes-Côte-d'Azur MONDAY, FEBRUARY 21, 2022 212.3. PERFORMANCE OF BUSINESS LINES – PROPERTY DEVELOPMENT
PROPERTY DEVELOPMENT: EXCELLENT BUSINESS MOMENTUM IN 2021
Strong business Significant new launches: 58 residential schemes
momentum in 2021 for more than 2,800 units (+13% vs. 2019)
Economic
revenue €1.1bn +30% +11%
Change Change
vs. 12/31/2020 vs. 12/31/2019 Launch of the Origine-trévoux
Project 84 units / to be completed
by Q3-2024
New
housing
6,004 +12% +18%
orders units Change Change
A record year vs. 12/31/2020 vs. 12/31/2019 ORIGINE-TREVOUX
Trévoux, Auvergne-Rhône-Alpes
New
office sale
c.€460m 115,000 x3.6 Launch of le Domaine de
sq.m vs. 12/31/2020 Visuel 2 spagnol Project / 39 units
agreements to be completed by Q4-2023
LE DOMAINE DE SPAGNOL
Nice, Provence-Alpes-Côte d’Azur
Continued business recovery, strong demand for residential 2021 FULL YEAR RESULTS
MONDAY, FEBRUARY 21, 2022 222.3. PERFORMANCE OF BUSINESS LINES – PROPERTY DEVELOPMENT
A GROWING SUPPLY TO SUPPORT ROADMAP EXECUTION ON RESIDENTIAL
Controlled
1 land
portfolio(1) +31% >15,000 units
Change vs. 2019
Obtained market trend:
2 building
permits +39%
Change vs. 2019
+5% vs. 2019
(7,300 units in 2021)
vs. a downward
Housing market evolution(2)
3 for sale
+13%
Change vs. 2019
-8.7%
JARDIN DU BLAVET – Pontivy, Morbihan
Icade Promotion: growing market share
On a 100% basis 2021 FULL YEAR RESULTS
(1) Land to be developed under a signed agreement (preliminary agreement or deed of sale) MONDAY, FEBRUARY 21, 2022 23
(2) Source ECLN2.3. PERFORMANCE OF BUSINESS LINES – PROPERTY DEVELOPMENT
PROPERTY DEVELOPMENT - LEADING INDICATORS STRONGLY UP
Growth potential confirmed
Backlog Revenue expected from the Medium-term
controlled residential land revenue potential
portfolio(1) (residential & office) (2)
€1.7bn €2.7bn €7.6bn
+20% vs. Dec. 2020
+10% for Residential
+90% for Office and others
2 significant projects in 2021
• Tolbiac: restructuration projet for
the construction of a 4,500 sq.m school
• Neuilly: conversion of a commercial
buiding into 164 housing units
TOLBIAC PROJECT (Paris, 13th district) NEUILLY PROJECT
Numerous appealing
opportunities available We are confident in our ability to deliver the roadmap
in the market
2021 FULL YEAR RESULTS
(1) Potential revenue that could be generated from land to be developed under a signed agreement (preliminary agreement or deed of sale) and not yet put in sales MONDAY, FEBRUARY 21, 2022 24
(2) On a Group share basis, excluding taxe3
2021 Financial Results
First investment
in acute care
in Portugal.
LUSIADAS PRIVATE HOSPITAL 2021 FULL YEAR RESULTS
Lisbon, Portugal MONDAY, FEBRUARY 21, 2022 253.1
Income statement
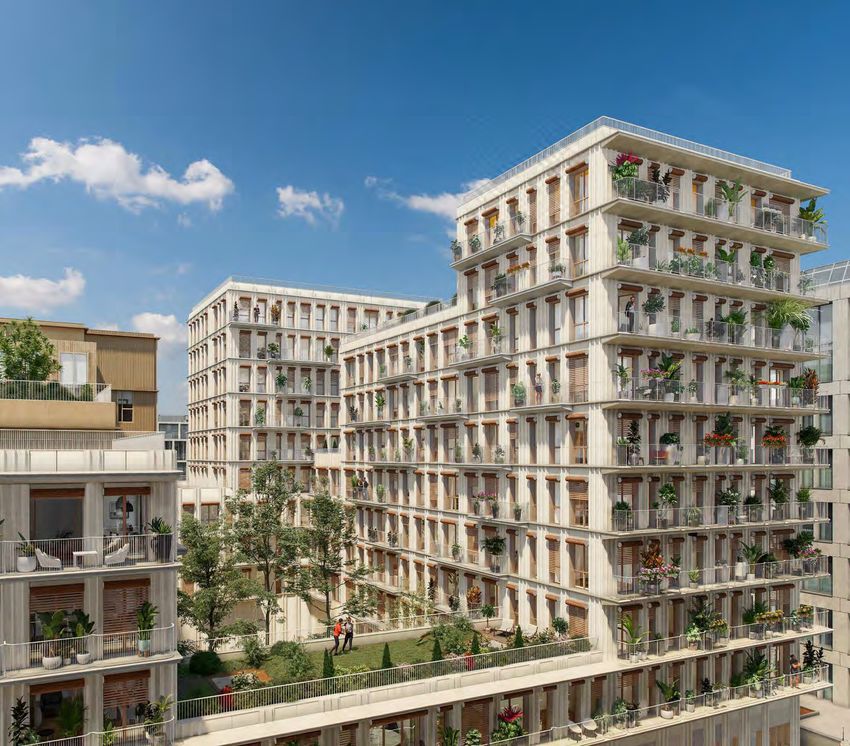
LE CARAT project, launched
by Icade Promotion, has a
characterful architecture,
enhanced by nature and high-
quality materials.
LE CARAT
Issy-les-Moulineaux, 2021 FULL YEAR RESULTS
Hauts-de-Seine MONDAY, FEBRUARY 21, 2022 263.1. 2021 FINANCIAL RESULTS – INCOME STATEMENT
CHANGES IN FINANCIAL PRESENTATION
Two changes in financial presentation made in 2021
Fair value • No impact on EPRA indicators
accounting method • Main impact on P&L: changes in fair value of assets in P&L
(vs. historical cost) • Balance sheet: real estate assets in fair value and reevalued equity
P&L(1) on Group share • Group share reflecting the economic contribution of each Icade business unit
basis (in addition to IFRS vs.
P&L) :
Economic view • IFRS: full consolidation or equity method
(1) The presentation in Group share consists of taking into account all the entities for Icade proportionate stake
(except for some non material entities)
2021 FULL YEAR RESULTS
MONDAY, FEBRUARY 21, 2022 273.1. 2021 FINANCIAL RESULTS – INCOME STATEMENT
EPRA EARNINGS GROUP SHARE UP AT €4.81 PER SHARE
Total Property Investment
Change vs.
Group share in €m 12/31/2021 12/31/2020 12/31/2020
Gross rental • Gross rental income up 2.9%
income
New: Group share 551.2 535.9 +2.9%
• A solid net to gross rental
Net to gross rental income ratio at c.95%
income ratio 94.9% 95.2% (30 bps)
• Contribution by activity
(1)
EPRA cost ratio 12.6% 11.7% +90 bps o Office: 58%
o Healthcare: 42%
EPRA earnings(2) from Property
Investment, Group share 361.1 351.0 +2.9%
EPRA earnings from Property
Investment per share, Group share 4.81 4.74 +1.4%
EPRA earnings up +2.9% vs. 2020; up vs. 2019, thanks to increased rental income
2021 FULL YEAR RESULTS
(1) Excluding vacancy costs MONDAY, FEBRUARY 21, 2022 28
(2) EPRA earnings (Group share) are equal to NCCF after taking into account the depreciation of operating assets3.1. 2021 FINANCIAL RESULTS – INCOME STATEMENT
RESILIENT OFFICE DIVISION, STRONG GROWTH FOR HEALTHCARE
Office Investment Healthcare Investment
(Group share in €m) Chg. vs. (Group share in €m) Chg. vs.
12/31/2021 12/31/2020 12/30/2020 12/31/2021 12/31/2020 12/30/2020
Gross rental income
(Offices and business parks) 343.9 339.9 +1.2% Gross rental income 188.4 174.1 +8.2%
Net to gross rental income Net to gross rental income
ratio (Offices and business parks) 92.0% 92.6% (60 bps) ratio 98.3% 98.1% +20 bps
EPRA earnings(2) EPRA earnings 150.7 136.7 +10.3%
246.5 240.0 +2.7%
(Offices and business parks)
EPRA earnings from Prop.
(3) Investment per share, Group share 2.01 1.85 +8.7%
EPRA earnings – Total 210.3 214.3 (1.9%)
New: Group share
● Gross rental income: +1.2%(1); (-1.0%(1) LFL) ● Gross rental income: +8.2%, driven by growth
new lettings and acquisitions largely offset impact in France and abroad (+0.4% LFL)
of disposals ● High net to gross rental income ratio (98.3%)
● Net to gross ratio slightly down due to significant asset among the highest in the sector
disposals and new completions ● EPRA earnings, 100% basis: €258.0m
● EPRA earnings of offices & business parks: +2.7%
Resilient 2021 results for the Office Division Strong growth in EPRA earnings of +10.3%
(1) Office & business parks 2021 FULL YEAR RESULTS
(2) Adjusted EPRA earnings (Group share) are equal to NCCF after taking into account the depreciation of operating assets MONDAY, FEBRUARY 21, 2022 29
(3) Incl. offices, business parks and other activities3.1. 2021 FINANCIAL RESULTS – INCOME STATEMENT
PROPERTY DEVELOPMENT: FINANCIAL INDICATORS CONTINUE TO BOUNCE BACK
12/31/2021 12/31/2020 YoY change
Total
(in €m) Residential Office TOTAL(2) TOTAL change Residential Office
Economic revenue(1) 911.1 161.5 1,074.4 825.4 30.2% 31.9% 34.8%
Revenue (Group share) 836.9 149.0 985.1 747.4 31.8% 34.5% 27.7%
Operating margin 5.0% 5.0% 5.0% 3.0% +1.9 pps
Current economic operating profit/(loss) 45.5 8.1 53.2 24.8 +114.5%
Net current cash flow (Group share) 22.0 3.3 24.2 2.5 NS
• Revenue at €1,074m, +30% vs. 2020 (+11% vs. 2019):
favourable base effect and solid business momentum
• No more impact of the Covid-19 crisis
• Residential business fuelled by strong demand: (shutdowns, exceptional costs) in 2021
€911m in revenue, i.e. 85% of total revenue
• Results fully in line with Icade
• Operating margin significantly improved at 5%, supported Promotion’s roadmap
by higher volume and appropriate management of higher
construction costs
• NCCF at c.€24m (vs. €2.5m in 2020)
2021 FULL YEAR RESULTS
(1) Economic revenue including entities accounted for using the equity method MONDAY, FEBRUARY 21, 2022 30
(2) The difference between the total and the sum of the two segments is due to urban development projects and long-term land holdings3.1. 2021 FINANCIAL RESULTS – INCOME STATEMENT
NCCF UP +8.8%, +7.2% PER SHARE, ABOVE GUIDANCE AND CONSENSUS
(in €m)
+8.8% (in €m)
€5.19 per share
+7.2% (per share)
€4.84 per share 2021 NCCF above 2019 level
22 389.7(1)
358.3(1) 14 • Office Investment Division: solid leasing momentum
6% and acquisitions offsetting impact of disposals
1% (4) • Healthcare Investment Division double digit growth
37% 38% driven by further expansion
• Property Development Division: strong business
momentum reflected in NCCF
Contribution(2)
Property Development NCCF above initial guidance
62% Healthcare Investment
56% • Stronger resilience in offices
Office Investment
• Better performance for IP, confirmed at year-end
• No dilution due to the postponed IPO
12/31/2020 Office Healthcare Property 12/31/2021
Investment Investment Development
NCCF increase: the strength of our diversified business model
2021 FULL YEAR RESULTS
(1) Includes NCCF from the “Other” segment MONDAY, FEBRUARY 21, 2022 31
(2) % of NCCF on a 100% basis3.2
Liabilities
This 8,500-sq.m office building
with panoramic views of the
neighbourhood and the Old Port,
was sold by Icade Promotion
to Office Investment.
GRAND CENTRAL 2021 FULL YEAR RESULTS
Marseille, Bouches-du-Rhône MONDAY, FEBRUARY 21, 2022 323.2. 2021 FINANCIAL RESULTS – LIABILITIES
A DYNAMIC MANAGEMENT OF LIABILITIES
Improved • Issuance of a €600m, 10-year bond at a historical low rate (0.625%)
cost of debt and
average maturity • Early redemption of bonds maturing in 2021 (2.25%) and 2022 (1.875%)
• Maintaining a robust short-term hedging policy: 97% at the end of 2021
Enhanced hedging • Adapting the hedging profile to the debt path
profile
➛ Hedging rate >85% over the next 3 years
• New Green Financing Framework with more ambitious
Higher goals for ESG criteria
green financial • Reclassification of the €600m 2021 bond as a Green bond
instruments • New Green bond issued in January 2022: €500m, 8 years,
1.0% coupon
LES QUARTIERS DE GALLY
Versailles, Yvelines
• A sound and sustainable financial structure to attractively finance our businesses
• Sustainable financial instruments (35% of total gross debt) aligned with our CSR strategy 2021 FULL YEAR RESULTS
MONDAY, FEBRUARY 21, 2022 333.2. 2021 FINANCIAL RESULTS – LIABILITIES
SOLID DEBT INDICATORS
Average debt maturity stable at 5.9 years Very attractive cost of debt (-19 bps vs. 12/31/2020)
7 1,60%
6
6.4 6.4 5.9 1,50%
1.55% 1.54%
5 5.9 1,40% 1.48%
4 1,30% 1.29%
3 1,20%
2 1,10%
2018 2019 2020 2021 2018 2019 2020 2021
Increasing ICR above 6x LTV ratio incl. duties stable at 40.1%
6,5x Bank covenant(1) (excl. duties) :3.2. 2021 FINANCIAL RESULTS – FINANCIAL ROADMAP
FINANCING & LTV: BREAKDOWN BY BUSINESS LINE
As of December 2021
(In €bn)
Icade Group Healthcare(2)
Property division
40.1% 33.2%
LTV(1)
by entity Debt 6.8 2.3
GAV (1) 17.1 7.0
Management of debt allocation:
1 Part of Icade’s debt dedicated to finance Icade
Healthcare Office Others(3) Santé equity (> €1.2bn since 2011, €0.6bn net
of dividends received from Icade Santé)
LTV(1) 42% 36.5% Not relevant 2 Property development debt
and miscellaneous
Economic Debt 1 3.0 3.4 2 0.4
allocation
GAV (1) 7.0 9.4 nd • LTV Office: c.36.5%
• LTV Icade Santé: c.42%
debt up due to significant investment plan
Current LTV ratios adapted to risk profile of each business line
Data on a 100% basis
(1) Including duties 2021 FULL YEAR RESULTS
(2) Healhtcare Property Investment Division: french and international combined figures available on the website MONDAY, FEBRUARY 21, 2022 35
(3) Including Property Development and holding company3.3
Value of the property
portfolio & NAV
This development project
recently launched by the Office
Property Investment Division is
located on the former site of a
building known for having
served to rescue British sailors
during the war.
MFACTORY 2021 FULL YEAR RESULTS
Marseille, Bouches-du-Rhônes MONDAY, FEBRUARY 21, 2022 363.3. 2021 FINANCIAL RESULTS – VALUE OF THE PROPERTY PORTFOLIO & NAV
PORTFOLIO VALUED AT €12.2bn (GROUP SHARE), €15.5bn (100% BASIS)
(Group share, excl. duties, in €bn)
+3.8%
+€446m 12.2
11.8 0.8 0.1
Healthcare
Investment 3.3
(0.5) 3.9 1 Value up +3.8% on a reported basis
driven by acquisitions in office
& healthcare
Office
2 Blended LFL increase: +0.7%
8.5 8.3
Investment +0.7% reflecting resilient office portfolio
LFL value & healthcare yield compression
12/31/2020 Disposals(1) Investments LFL change 12/31/2021
& others
A dynamic portfolio growth reflecting strong activities both in Healthcare and Offices
2021 FULL YEAR RESULTS
MONDAY, FEBRUARY 21, 2022 37
(1) Fair value as of 12/31/2020 of assets sold during the period3.3. 2021 FINANCIAL RESULTS – VALUE OF THE PROPERTY PORTFOLIO & NAV
GAV AND NAV: CONTRIBUTION OF OFFICE AND HEALTHCARE
GAV AT €12.2bn(1) (Group share) as of Dec. 31, 2021 EPRA NAV NDV OF €6.9bn (Group share)
as of Dec. 31, 2021, €90.6 per share
€8.4bn €3.9bn €4.5bn €2.4bn
December 31, 2021 December 31, 2021
Net initial yield(2) Net initial yield(2) €59.1 per share €31.8 per share
(incl. duties): 5.5% €12.2bn (incl. duties): 5.0% €6.9bn
65% 35%
68% 32%
Office Office Investment and
Investment Healthcare Investment Property Development Healthcare Investment
Healthcare Property Investment
Division – combined financial
statements:
NAV NDV €95.1 per share(3)
+11% vs. December 2020
Asset allocation in line with our strategic plan
(1) Excluding duties 2021 FULL YEAR RESULTS
(2) Annualised net rental income from leased space plus potential net rental income from vacant space at estimated rental value, divided by the appraised value of leasable space including duties MONDAY, FEBRUARY 21, 2022 38
(3) NAV NDV: €4,077.8m; 42,880,485 shares - Combined financial statements for the Healthcare Property Investment Division are available on the website3.3. 2021 FINANCIAL RESULTS – VALUE OF THE PROPERTY PORTFOLIO & NAV
EPRA NAV NDV: €90.6 PER SHARE, +10.8% CUM DIVIDEND
(€ per share)
+8.6% (in €m)
+6.1% (per share)
Strong operational performance
+10.8% of our 3 business lines:
3.2 NCCF up +€5.2 per share
94.6
2.2 (1.4) EPRA NAV NDV:
€6,864m: +8.6%
5.2 90.6 €90.6 per share: +6.1%
(4.0)
EPRA NAV NTA:
85.4 €7,160m: +4.6%
€94.5 per share: +2.2%
EPRA NAV NRV:
€7,725m: +4.5%
EPRA NDV
12/31/2020
Group NCCF Changes in
value
Fair value of
derivatives
Other
factors
EPRA NDV
12/31/2021
2020
dividend
EPRA NDV
12/31/2021
€101.9 per share: +2.1%
of assets and fixed rate (cum dividend)
debt
• A strong NAV reflecting solid business model
• 2021 NAV (NDV) TSR: c.11%, back to 2018 level
2021 FULL YEAR RESULTS
MONDAY, FEBRUARY 21, 2022 393.4
Dividend
Located in Icade’s Pont de Flandre
business park, the street-art
fresco "Dreaming of the horizon"
includes 9 works in an open-air
gallery of over 400 meters.
PONT DE FLANDRE BUSINESS PARK 2021 FULL YEAR RESULTS
Paris, 19th district MONDAY, FEBRUARY 21, 2022 403.4. 2020 FINANCIAL RESULTS – DIVIDEND
DIVIDEND ABOVE PRELIMINARY ANNOUNCEMENT REFLECTING STRONG NCCF GROWTH
Board of Directors’ proposal to the General Meeting
to be held on April 22, 2022 +4.7% Growth vs. 2020
Conservative 2021
81% payout ratio
2021 dividend at €4.20 per share
Dividend yield
6.7% (based on share price
as of 12/31/2021)
Dividend paid in two instalments:
early March and early July (no scrip dividend) 6.8% 2021 share price TSR
2021 dividend in line with dividend policy
2021 FULL YEAR RESULTS
MONDAY, FEBRUARY 21, 2022 414
CSR and European
Taxonomy reporting
At the gateway to Tours, Icade’s
“RIVE SUD” project at the heart
of a new district is ideally
located with shops, offices,
residential buildings and a future
tram station.
RIVE SUD 2021 FULL YEAR RESULTS
Tours, Indre-et-Loire MONDAY, FEBRUARY 21, 2022 424. CSR AND EUROPEAN TAXONOMY REPORTING – CSR
ICADE’S CSR POLICY: STRONG 2021 RESULTS
Icade strongly reduced its carbon Other strong CSR achievements in 2021
intensity in each business line between
2015 and 2021 (in kg CO2/sq.m)
100%
OFFICE INVESTMENT Of business parks & 46% of new builds
have a net positive impact on Biodiversity
-30%
100%
HEALTHCARE INVESTMENT Icade Santé’s new builds > 4,000 sq.m
-27% with an environmental certification(2)
475,000 sq.m
PROPERTY DEVELOPMENT(1)
Timber construction projects completed
-17% or under development
All our divisions fully committed to deliver on CSR goals
2021 FULL YEAR RESULTS
(1) For housing MONDAY, FEBRUARY 21, 2022 43
(2) With a minimum level of certification (HQE/ BREEAM Very Good, LEED/DGNB Silver)4. CSR AND EUROPEAN TAXONOMY REPORTING – CSR
LEADING POSITION CONFIRMED BY CSR RATING AGENCIES
CLIMATE CHANGE NON-SPECIALISED REAL ESTATE
Ranked 4th out of 445 listed
real estate companies worldwide “Sector leader” status
in the category of listed diversified
Score: 7.7/100 (inverted scale)
companies in Europe with properties
A- rating mainly operated by their tenants
in the top 20% worldwide
“Leadership” status Score: AA Score: 83/100
(on a scale ranging from CCC to AAA)
“Prime” status
in the top 10% of real estate
companies worldwide
“Gold” rating
for the quality of
Ranked 4th out of 94 companies non-financial reporting
since 2015
in Europe in the real estate sector
Score: 64/100
Icade improves its leading position in 2021 for ESG ratings
2021 FULL YEAR RESULTS
MONDAY, FEBRUARY 21, 2022 444. CSR AND EUROPEAN TAXONOMY REPORTING – EUROPEAN TAXONOMY REPORTING
FURTHER ALIGNMENT BETWEEN FINANCIAL AND NON-FINANCIAL REPORTING
Icade reporting based on 2021 data
« Eligible activities »
per European Taxonomy definition Total IFRS Eligible(1)
Scope (in €bn) (in €bn) %
Construction (new buildings)
Rental income from
investment property
Renovation (existing buildings) Revenue divisions & revenue 1.7 1.6 98.9%
from property development
Operation (acquisition Investment property
and ownership of buildings) Non-material impact in 2021, based
Opex divisions and property
development on the taxonomy’s current definition
Excludes project management
Investment property
Capex divisions 1.2 1.2 98.8%
Our 3 activities
are therefore eligible
Next step early 2023: reporting on “aligned activities”
2021 FULL YEAR RESULTS
MONDAY, FEBRUARY 21, 2022 45
(1) In line with taxonomy disclosure5
Outlook
& 2022 Priorities
First project under a land
lease which promotes
affordable home
ownership (Bail Réel
Solidaire or BRS).
« LOGEMENT POUR TOUS » PROJECT 2021 FULL YEAR RESULTS
Reignier-Esery - Haute-Savoie MONDAY, FEBRUARY 21, 2022 465. OUTLOOK & 2022 PRIORITIES – CONTINUED STRONG EXECUTION OF THE STRATEGIC PLAN, TARGETS TO 2025 WELL UNDERWAY
2022 OUTLOOK FOR OFFICE
Office Investment Division
• Letting market: towards the 10 year average (2.3 million sq.m)
Market trends
• Investment market: strong appetite for core assets
Icade roadmap • Icade’s disposal plan: ≈€500m/€600m per year
(2021-2025) o 2022 plan initiated with a preliminary agreement for €186m
o > 50% of the office portfolio: mature assets
Recycle capital & • 2021-2025 investment plan: ≈€[1.5-1.7]bn
value creation o Opportunistic acquisitions and investment in a secured pipeline
• Focus on letting and renewal activity
2022 Priorities • Disposal plan and opportunistic acquisitions
• Launch of selective new development projects
Solid mid-term outlook for the Office portfolio
2021 FULL YEAR RESULTS
MONDAY, FEBRUARY 21, 2022 475. OUTLOOK & 2022 PRIORITIES – CONTINUED STRONG EXECUTION OF THE STRATEGIC PLAN, TARGETS TO 2025 WELL UNDERWAY
REFUELED UP TO €1.7BN, ADAPTED TO NEW MARKET ENVIRONMENT
€2.5bn €2.4bn • A secured launched Pipeline:
Opportunistic €2.2bn
€2.2bn €400m
FY 2016 FY 2017 FY 2018 FY 2019 FY 2020 FY 2021
Confirmed +
Confirmed Opportunistic
Development pipeline: the volume and the value creation are there
2021 FULL YEAR RESULTS
MONDAY, FEBRUARY 21, 2022 48
Note: on a 100% basis5. OUTLOOK & 2022 PRIORITIES – CONTINUED STRONG EXECUTION OF THE STRATEGIC PLAN, TARGETS TO 2025 WELL UNDERWAY
THE NURSING HOME CONTROVERSY IN FRANCE: WHAT IS THE SITUATION FOR ICADE?
Acute
• Predominance in acute and post acute care: & post acute
84% of healthcare GAV; 86% of healthcare GRI 86% Nursing
• Nursing Homes in France: 36 facilities homes excl. France
8%
Exposure of Icade o 5% of healthcare GRI
to Nursing homes o 3% of total Icade Group GRI 2021 GRI:
Nursing homes
in France 5%,
(NH) in France €322m of which
o Orpea in France : 0.3% of healthcare GRI, on a 100% basis • Orpea: 0.3%
0.1% of total Icade Group GRI • Korian: 2.1%
o Korian in France : 2.1% of healthcare GRI,
1.0% of total Icade Group GRI
• Acute care in France is a more regulated and certified sector than the NH sector
o 99% of the acute care portfolio in France certified at the 2 highest levels
Differences by the French National Authority for Health (HAS)
between • Quality of life in NH: a priority of Icade
NH and acute o Internal rating framework developped with AFNOR(1) set up in 2020
care in France ■ > 100 criteria related to resident well-being, quality of life, safety and care
■ Used in all acquisition audits in France
■ Currently implemented abroad
2021 FULL YEAR RESULTS
MONDAY, FEBRUARY 21, 2022 49
(1) AFNOR : French standardisation Agency5. OUTLOOK & 2022 PRIORITIES – CONTINUED STRONG EXECUTION OF THE STRATEGIC PLAN, TARGETS TO 2025 WELL UNDERWAY
THE NURSING HOME CONTROVERSY IN FRANCE: WHAT COULD BE THE OUTCOME?
• Comparable to the acute care sector
Fair to expect an • More request for care assistants and nurses
increase in regulation
for NH • As a reminder: those employees are paid by Social Security
• More controls and audits
• More financial transparency (especially on use of public funding)
Improvement in quality
of service • Improvement of premises’ quality (incl. for public nursing homes)
• Specialised REITS: an active role to play in this environment
• Short-term newsflow impacts negatively NH sector…
• On mid & long-term: more regulation, more transparency, higher quality for services
and opportunities for healthcare REITS
2021 FULL YEAR RESULTS
MONDAY, FEBRUARY 21, 2022 505. OUTLOOK & 2022 PRIORITIES – CONTINUED STRONG EXECUTION OF THE STRATEGIC PLAN, TARGETS TO 2025 WELL UNDERWAY
2022 OUTLOOK FOR HEALTHCARE
Healthcare Investment Division
• Non-cyclical fundamentals: growing needs and favourable market trends
Market trends • Strong investment dynamics
• ESG growing considerations
• €3.0bn investment plan(1) Indicative allocation
Icade roadmap c. 30% already achieved end of 2021 France: €1.2bn (40%)
(2021-2025) €600m per year on average International: €1.8bn (60%)
• European leadership
2022 Priorities • Growth, expansion and continued tenant and geographic diversification
Icade Santé’s liquidity/listing: when market conditions allow
2021 FULL YEAR RESULTS
MONDAY, FEBRUARY 21, 2022 51
(1) On a 100% basis5. OUTLOOK & 2022 PRIORITIES – CONTINUED STRONG EXECUTION OF THE STRATEGIC PLAN, TARGETS TO 2025 WELL UNDERWAY
2022 OUTLOOK FOR ICADE PROMOTION
Property Development Division
A very strong demand:
• Demographic trends
Market trends • Institutional investor demand
• Still favourable loan interest rates
Icade Promotion • Revenue: €1.4bn An adapted offer
roadmap • Margin: 7%
(2021-2025) • Additional and growing NCCF
• Increase revenue
2022 Priorities • Achieve higher margins
• Accelerate low carbon construction
Icade Promotion well on track to meet its ambitious roadmap
2021 FULL YEAR RESULTS
MONDAY, FEBRUARY 21, 2022 525. OUTLOOK & 2022 PRIORITIES – CONTINUED STRONG EXECUTION OF THE STRATEGIC PLAN, TARGETS TO 2025 WELL UNDERWAY
LOW CARBON STRATEGY: FURTHER ACCELERATION IN 2022
New commitments: alignment of the 3 business units on a 1.5°C pathway
OFFICE PROPERTY INVESTMENT
-60%
New CO2 intensity targets HEALTHCARE PROPERTY INVESTMENT
2019-2030 (in kg CO2 / sq.m) -37%
DEVELOPMENT
-41%
Towards SBTI validation – Net Zero Standard
Mid-term investment plan on low carbon: €150m
Say on Climate & Biodiversity submitted to the General meeting (April 22, 2022)
2021 FULL YEAR RESULTS
MONDAY, FEBRUARY 21, 2022 535. OUTLOOK & 2022 PRIORITIES – CONTINUED STRONG EXECUTION OF THE STRATEGIC PLAN, TARGETS TO 2025 WELL UNDERWAY
IMPACT OF INFLATION ON ICADE
• 100% of leases indexed on CPI related indexes
Revenues
• Cap rate of Icade portfolio: Office 5.5%, Healthcare 5.0%
and
valuations ➛ Significant buffer (risk premiums) vs. long-term sovereign interest
rates to absorb interest rates increase
• Low cost of debt: 1.29% / average debt maturity: c. 6 years
Financing • Hedging rate 97% as of december 2021, >85% over the next 3 years
• Positive impact in NAV NDV (debt fair value)
• Limited, not to say positive impact for Icade
• As a reminder real estate is amongst the best hedges against inflation
2021 FULL YEAR RESULTS
MONDAY, FEBRUARY 21, 2022 545. OUTLOOK & 2022 PRIORITIES – CONTINUED STRONG EXECUTION OF THE STRATEGIC PLAN, TARGETS TO 2025 WELL UNDERWAY
2022 GUIDANCE (SUBJECT TO SANITARY SITUATION)
2022 Group
NCCF Up ≈+4%, excluding impact of 2022 disposals
per share
2022 Healthcare
Property NCCF(1) Up ≈+5/6%
2022 Dividend Up ≈+3/4% (Subject to General Meeting approval)
General Meeting: April 22, 2022
2021 FULL YEAR RESULTS
MONDAY, FEBRUARY 21, 2022 55
(1) NCCF = EPRA earnings / Icade Santé on a 100% basisQ&A
Most of the interiors proposed
by Tempo Nature benefit from
double exposures favouring
natural light, ventilation and
multiple views.
TEMPO NATURE 2021 FULL YEAR RESULTS
Amiens, Somme MONDAY, FEBRUARY 21, 2022 56Appendices
"AfterWork by Icade" is an approach
for redeveloping office investment
assets, led by Icade Promotion to
explore the various ways they can be
converted, particularly into housing.
INITIAL PRADO 2021 FULL YEAR RESULTS
Marseille, Bouches-du-Rhône MONDAY, FEBRUARY 21, 2022 57APPENDICES – ICADE AT A GLANCE
ONE OF THE LEADING FRENCH LISTED REITS
As of 12/31/2021
OFFICE INVESTMENT: Icade, the leading real estate player in Greater Paris €15.5bn property portfolio
€12.2bn property portfolio excl. duties, Group share
• Portfolio as of 12/31/2021: €8.9bn (100% basis)
• Average net initial yield (Group share, incl. duties)(1): 5.5%
• Development pipeline (100% basis)(2): €904m (for nearly 150,000 sq.m) Healthcare
Investment
• Situated mainly in the Paris region, close to major Greater Paris stations
FRESK • 877,000-sq.m land bank 32%
Issy-les-Moulineaux, Hauts-de-Seine Office
Investment
HEALTHCARE INVESTMENT: Icade, the leading player in France 68%
• Portfolio as of 12/31/2021: €6.7bn on a 100% basis, €3.9bn Group share
o 87% in France, 13% outside France
Icade shareholding structure
o 84% acute and post acute care (incl. 4% outside France) and 16% long-term care
(incl. 10% outside France) Crédit Agricole Free float(4)
L’UNION PRIVATE HOSPITAL • 206 healthcare facilities as of 12/31/2021 Assurances Group
41.7%
Toulouse, Haute-Garonne
• Average net initial yield (incl. duties)(1): 5.0% 19.1%
PROPERTY DEVELOPMENT: a leading property developer in France, Caisse des dépôts
a key player in low-carbon construction 39.2%
• Limited exposure (less than 10% of Group equity(3))
• A full-service developer (offices, homes, etc.)
with extensive national coverage (21 local offices) S&P rating for Icade & Icade Santé
EMBLEM - Lille, Nord BBB+, stable outlook
(1) Annualised net rental income from leased space plus potential net rental income from vacant space at estimated rental value, divided by the appraised value of leasable space including duties
(2) Inludes the fair value of the asset at project start, cost of works (incl. expenses, fees and tenant improvements) and carrying costs 2021 FULL YEAR RESULTS
(3) Property Development equity attributable to the Group (before elimination of investments in subsidiaries / consolidated equity attributable to the Group) MONDAY, FEBRUARY 21, 2022 58
(4) Including 0.71% of treasury shares, and 0.28% for Icade’s FCPE employee-shareholding fund (as of 12/31/2021)APPENDICES – OFFICE MARKET
A RECOVERING MARKET FAVOURABLE TO HIGH-QUALITY ASSETS…
2021 take-up is up Large transactions are back
Paris Region Office Market
1.85m sq.m 75% in new offices (sq.m)
Take-up is picking-up
with new standards +32% vs. 2020 56 41 outside of Paris
-18% vs. 10-year average transactions
>5,000 sqm
9,800 average size (sq.m)
(13,000 sq.m over 2016-2020)
in 2021
Stable headline rents for new office space despite rising vacancy rates across all markets
Lyon Aix/Marseille
+35% / +13% +6% €3.2bn
Regional Office Markets
Dynamic markets catching Lyon
the attention of investors 2021 take-up vs 2020
(+5% and +24% vs. 10-year average)
YoY increase for Prime rent
in La Part-Dieu & EuroMed
3rd best year in 2021
for investments in regional offices
(+23% YoY)
Marseille
Capital Markets
An attractive market with
€27bn 54 41%
Direct investments Transactions > €100m Share of foreign investors
fewer large transactions in Commercial real estate in 2021
-8% YoY / -5% vs. 10-year average
vs. 73 in 2020
and > 100 in 2019
+ 5 pps YoY
North-Americans at 19%
Return of Asian investors
… that will benefit Icade 2021 FULL YEAR RESULTS
MONDAY, FEBRUARY 21, 2022 59APPENDICES – OFFICE MARKET
TAKE-UP IS PICKING UP WITH NEW STANDARDS
A rebound in take-up backed
by enhanced macroeconomic perspectives Where is the office market most active so far?
TAKE-UP WAS BEYOND EXPECTATIONS IN 2021 LARGE TRANSACTIONS ARE BACK (ALBEIT A BIT SMALLER)
Take-up in million sq.m in the Paris region Number of transactions > 5,000 sq.m in the Paris region
1.85 Realized in 2021
1.4 2.3 23 65
in 2020 2.0 10-year
average
in 2020 56 10-year
average
2021 expectation expected in 2021
for 2022
EMPLOYMENT WILL CONTINUE TO INCREASE IN 2022 NEW OFFICES IN CENTRAL OR AFFORDABLE LOCATIONS
Market segments sorted by relative situation vs their 10-year-average
Total employment rate in the Paris region (yearly growth and in thousands of jobs)
2021 vs. 10-year Share of new Offices
2011 - 2019 2020 2021(1) 2022(1) 2023(1) Take-up average (vs. 10-year average)
(thsd sq.m) ▼
+0.8% -1.1%
-73
+1.4% +1.2% +0.9%
1 La Défense 205 + 20% 54% Very strong (35% usually)
+90 +82 +60
2 Northern Loop 37 + 20% 42% Strong (34% usually)
HIGH POST-PANDEMIC GROWTH
Annual GPD growth 3 Paris CBD 420 + 6% 25% A bit higher (20% usually)
2011 - 2019 2020 2021 2022(1) 2023(1) 4 North. Inner Ring 146 -5% 64% Very strong (49% usually)
+1.4% -7.9% +7.0% +3.7% +2.2% 5 Péri-défense 145 -27% 45% Lightly more (39% usually)
Sources: ImmoStat, JLL, Oxford Economics, CDC
Icade will benefit from the rising demand for new core offices 2021 FULL YEAR RESULTS
MONDAY, FEBRUARY 21, 2022 60
(1) Forecasts - based on Q3 2021 for 2021APPENDICES – OFFICE INVESTMENT
LA DÉFENSE AND PARIS CBD LEADING THE MARKET RECOVERY
Western Icade’s Office Investment portfolio
Paris CBD La Défense Crescent Inner Ring Outer Ring in the Paris region in year end 2021
Physical vacancy rate 3.1% ▼ 13.6% ▲ 13.6% ▲ 10.7% ▲ 5.1% ▼
(end of 2021 vs. a year earlier) GENEVILLIERS
23,520 sq.m SAINT-DENIS
67,960 sq.m
Take-up 421,000 sq.m 205,000 sq.m 390,000 sq.m 265,000 sq.m 201,000 sq.m
(2021 vs. 2020 / vs 10 year-average) (+54% / +1%) (+3% / +20%) (+40% / -26%) (+30% / -25%) (+5% / -36%) LE MAUVIN BUSINESS PARK
NANTERRE
LA DÉFENSE PORTES DE PARIS 21,980 sq.m
BUSINESS PARK
241,100 sq.m 119,320 sq.m
Transactions > 5,000 sq.m 17% 59% 36% 45% 27%
316,900 sq.m PONT DE FLANDRE
(% 2021) MILLÉNAIRE
115,580 sq.m 99,240 sq.m
Prime rent
(€/sq.m/year headline excl. taxes & service €910/sq.m ≈ €560/sq.m ▲ €635/sq.m ▲ €380/sq.m ▼ €260/sq.m ▼ RUEIL-MALMAISON NEUILLY-SUR-SEINE PARIS, 8th DISTRICT PARIS, 20th DISTRICT
charges at end 2021 vs. a year earlier) 21,730 sq.m 3,600 sq.m 9,880 sq.m 19,970 sq.m
Average rent for new space
(€/sq.m/year, headline rents excl. taxes €805/sq.m ▲ €515/sq.m ▲ €403/sq.m ▲ €329/sq.m ▼ €217/sq.m ≈
PARIS, 15th DISTRICT
& service charges at end 2021 vs. a year earlier)
33,400 sq.m
Lease incentives 19% ▲ 31% ▲ 27 % ≈ 25% ▲ 21% ▼
(average % for transactions in 2021)
ISSY-LES-MOULINEAUX GENTILLY
Price (incl. duties, all property ages) 20,590 sq.m 13,713 sq.m
€19,800/sq.m ▲ €9,500/sq.m ▲ €6,100/sq.m ▼ €6,000/sq.m ▲ €2,100/sq.m ▼ VILLEJUIF
(€ incl. duties/sq.m in 2021 vs. a year earlier)
9,970 sq.m
Supply under construction
to be completed within 3 years 99,000 sq.m ▼ 210,000 sq.m ▼ 269,000 sq.m ▼ 571,000 sq.m ▲ 57,000 sq.m ▲ LE PLESSIS-ROBINSON
64,700 sq.m
(in sq.m, end of Dec. 2021 vs. a year earlier)
Prime yield 2.70% ≈ 4.00% ≈ 3.20% ≈ 3.60% ≈ 4.85% ≈
(end of 2021 vs. a year earlier)
ORLY-RUNGIS BUSINESS PARK
€2,630m €1,200m €2,230m €2,950m €440m 388,366 sq.m
Office investments
(2021 vs. 2020) (-30%) (NS) (- 54%) (-1%) (+ 15%)
• Take-up focusing on higher quality offices in transport hubs
• Paris CBD above €800/sq.m making other markets attractive (cf. La Défense)
2021 FULL YEAR RESULTS
MONDAY, FEBRUARY 21, 2022 61
Sources: ImmoStat, JLL, BNP Paribas Real EstateAPPENDICES – OFFICE MARKET
LYON AND MARSEILLE: DYNAMIC MARKETS GAINING THE ATTENTION OF INVESTORS
Lyon
2% of annual rent
A swift return to the long-term level of
take-up for the main regional market
Marseille
2% of annual rent
A record year for the office market
facing limited new supply
• 3rd best year for the take-up – 80% in inner Lyon Lyon • Highest level of take-up in Aix/Marseille in 2021
Marseille
• Strong demand for new offices (stable supply in 2021) • Take-up of new offices at a record level (85,000 sq.m)
• Prime rent back to its highest level in La Part-Dieu • Limited completions in Euroméditerranée expected in 2022
Take-up in Lyon Metro Area Take-up in Aix-Marseille metropolitan area
Vacancy
500 rate 12,0 Vacancy rate
450 442
293k sq.m +5% 164k sq.m +24%
vs. 10-year 450 12,0 vs. 10-year
10,0 in 2021 average in 2021 average
400
400
10,0
350
8,0 54% of the take-up on new offices 350 52% of the take-up on new offices
300 10-year average: 280 293 80% in inner Lyon 300 8,0
61% in inner Marseille
250
5.3
217 5.6
6,0
5.6% +0.6 pp 250 6.7 6.4
6,0
5.4% -0.3 pp
200 Vacancy rate in 2021 Vacancy rate since the
at Q4 2021 200 5.4 at Q3 2021 end of 2020
4.0 4,0 156 156 146 164
150 10-year average: 130
€340 sq.m +6%
150 4,0
€280 sq.m +6%
100 Prime rent 100 Prime rent
2,0 in La Part-Dieu YoY in Euroméditerranée YoY
2,0
50 50
0 0,0 3.35% -15 bps 0 0,0 3.90% -40 bps
Prime yield in 2021 Prime Yield YoY
Markets offering value-creation opportunities 2021 FULL YEAR RESULTS
62
MONDAY, FEBRUARY 21, 2022
Sources: BNP Paribas Real Estate / JLL / FNAIMAPPENDICES – OFFICE MARKET
INVESTMENT VOLUMES ARE IN LINE WITH THEIR 10-YEAR AVERAGE
Direct real estate investments in France
Lower sizes leading to a lower volume (Commercial real estate, €bn)
1 €27bn invested in 2021 (-8% over a year) with 54 transactions over
€100m (73 in 2020 and more than 100 in 2019) Q1 Q2 Q3 Q4
50
43
Offices remain the main investment in France 45
2 59% of investments in offices with a dynamic regional market 40
35
(+19% with €3bn) and growing appetite for industrial assets (+55%) 35
€28bn 32 18
29
30 10- year average 27 27
26
France is attractive to foreign investors 25
3 Domestic investors slightly down to 59% of investments while
20 18 10
11
11
North Americans are up to 19% and Asian funds are back (5%) 15
15 6
6
10 10 5
Prime yields under pressure 5
4 Investors’ focus on core assets maintaining yields in the Paris region 5
6
8
5
and leading to compressions in regional markets and logistics 0
Investors are more and more selective with a focus on core offices and diversification opportunities
(urban logistics, healthcare, regional markets): Icade’s disposal plan will also benefit from these trends
2021 FULL YEAR RESULTS
MONDAY, FEBRUARY 21, 2022 63
Sources: BNP Paribas Real Estate / CBREAPPENDICES – OPERATIONAL PERFORMANCE OF BUSINESS LINES – OFFICE INVESTMENT
KEY FIGURES
12/31/2020 12/31/2021 1 Stable values in a context of active
resumption of office disposals
Portfolio value (100%, excl. duties) €9.0bn €8.9bn
Portfolio value (Group share, excl. duties) €8.5bn €8.4bn 2 Slight yield compression mainly driven
by new completions of prime assets
Average net initial yield(1) 5.7% 5.5%
(Group share, incl. duties)
3
WALB strongly up (+0.4 year)
Offices
Business parks
5.0%
7.5%
4.9%
7.3%
due to significant new leases
and renewals
7,300 7,000
Average price
Paris region offices 4 Financial occupancy rate temporarily
Offices ex Paris region 3,600 4,000
per sq.m(2)
Business parks
impacted by disposals and completions
2,300 2,300
Total floor area (in millions of sq.m) 1.85 1.92
WALB 4.1 years 4.5 years
Financial occupancy rate 92.5% 88.1%
Offices 94.9% 89.3%
Business parks 86.9% 84.6%
Resilient indicators for the office portfolio
ORIGINE
Nanterre, Hauts-de-Seine
On a 100% basis (unless otherwise specified) 2021 FULL YEAR RESULTS
(1) Annualised net rental income from leased space plus potential net rental income from vacant space at estimated rental value, divided by the appraised value of leasable space including duties MONDAY, FEBRUARY 21, 2022 64
(2) For operating properties / Group shareAPPENDICES – PORTFOLIO OVERVIEW – OFFICE INVESTMENT
Land bank
MOST INVESTMENTS ARE CONCENTRATED IN GREATER PARIS: c.91% 877,000 sq.m(2) – €0.1bn
OUR BUSINESS PARKS
Paris region portfolio AREAS (IMMOSTAT) ON THE DOORSTEP OF PARIS
1,665,740 sq.m – €7.5bn(1) 261,000 sq.m
ASSETS LAND BANK
Extended Paris CBD area
Left Bank
GRAND PARIS
Northeast Paris EXPRESS LINES
14
La Défense 15
Western Crescent 16,17
18 PORTE DE GENTILLY
Northern Inner Ring 18 Beyond 2030
6,000 sq.m
Southern Inner Ring
WEST PARK ORIGINE PULSE Eastern Inner Ring HIGH-SPEED TRAIN STATIONS
Nanterre Nanterre
GENEVILLIERS St-Denis – Portes de Paris business park ORLY-RUNGIS
23,520 sq.m SAINT-DENIS TGV Existing high-speed train station
BUSINESS PARK
67,960 sq.m Outer Ring TGV Planned high-speed train station
610,000 sq.m
LE MAUVIN BUSINESS PARK
NANTERRE
LA DÉFENSE PORTES DE PARIS 21,980 sq.m
BUSINESS PARK
241,100 sq.m 119,320 sq.m
316,900 sq.m
MILLÉNAIRE
115,580 sq.m
PONT DE FLANDRE
99,240 sq.m Portfolio outside the Paris region
RUEIL-MALMAISON NEUILLY-SUR-SEINE PARIS, 8th DISTRICT PARIS, 20th DISTRICT
257,600 sq.m – €0.8bn(1)
21,730 sq.m 3,600 sq.m 9,880 sq.m 19,970 sq.m GAMBETTA
Paris, 20th district
PARIS, 15th DISTRICT
33,400 sq.m
ISSY-LES-MOULINEAUX GENTILLY
20,590 sq.m 13,713 sq.m
VILLEJUIF
Lyon MFACTORY
9,970 sq.m Marseille
83,642 sq.m
Bordeaux
LE PLESSIS-ROBINSON
64,700 sq.m 48,540 sq.m
Marseille
Toulouse 42,620 sq.m
29,240 sq.m
FRESK QUAI RIVE NEUVE
Issy-les-Moulineaux ORLY-RUNGIS BUSINESS PARK MONACO Marseille
388,366 sq.m Rungis business park
(1) Valuations as of December 31, 2021 on a Group share basis (excl. residential) Selective positioning in the main French cities 2021 FULL YEAR RESULTS
MONDAY, FEBRUARY 21, 2022 65
(2) Balance net of demolition and constructionAPPENDICES – ICADE OFFICE INVESTMENT STRATEGY
DEVELOPMENT PIPELINE AS OF DECEMBER 31, 2021
Remaining to be
Cost on a Cost on a invested on a
Rental group share 100% 100% basis
Property Estimated date Floor area income basis(2) basis(2) > Q4 2021
(1)
Project name Location Type of works In progress type of completion (sq.m) (€m) YoC (€m) (€m) (€m) Pre-let
B034 th
Paris, 19 district Refurbishment ✓ Hotel Q4 2022 4,826 41 41 13 100%
JUMP (ex-ilot D) Portes de Paris Construction ✓ Office / Hotel Q1-Q3 2023 18,782 94 94 57 19%
Grand Central Marseille Construction / VEFA ✓ Office Q4 2023 8,479 35 35 23 -
MFACTORY Marseille Construction ✓ Office Q3 2023 6,000 27 27 19 -
PAT029 Paris, 19th district Refurbishment X Office Q2 2024 11,532 97 97 43 -
EDENN Nanterre Refurbishment X Office Q2 2025 30,587 225 225 168 59%
ATHLETES VILLAGE Saint-Ouen Construction / VEFA ✓ Office / Business premises Q1 2026 12,404 31 61 50 -
TOTAL PROJECTS STARTED 92,610 32.3 5.6% 551 581 373 30%
TOTAL UNCOMMITTED PROJECTS 57,082 17.1 5.3% 244 323 188 -
TOTAL PIPELINE 149,692 49.5 5.5% 794 904 561 -
POTENTIAL OPPORTUNISTIC DEVELOPMENTS 148,370 785 785 679 -
• A development pipeline with an attractive YoC of 5.5%
• 1 project to be completed by the end of 2022, 100% pre-let
• Pipeline of €1.7bn including potential opportunistic developments
Notes: On a 100% basis 2021 FULL YEAR RESULTS
(1) Fair value-based YoC = headline rental income / cost of the project. This cost includes the fair value of the asset at project start, cost of works (incl. expenses, fees and tenant improvements) and carrying costs MONDAY, FEBRUARY 21, 2022 66
(2) Includes the fair value of the asset at project start, cost of works (incl. expenses, fees and tenant improvements) and carrying costsYou can also read