2021 FULL YEAR RESULTS - 22ND FEBRUARY 2022 - INTERCONTINENTAL HOTELS GROUP
←
→
Page content transcription
If your browser does not render page correctly, please read the page content below
Holiday Inn Glendale, Arizona, United States

                                      2021 Full Year Results
                                               22nd February 2022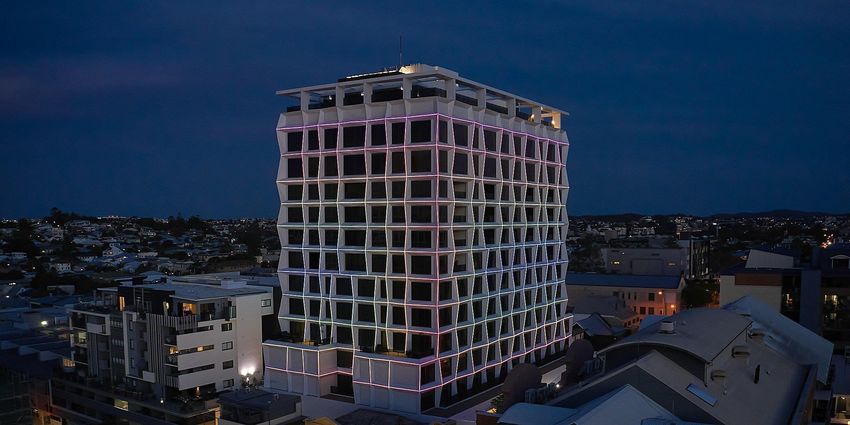
CAUTIONARY NOTE REGARDING FORWARD-LOOKING STATEMENTS

    This presentation may contain projections and forward looking-statements. The words “believe”, “expect”, “anticipate”,
    “intend” and “plan” and similar expressions identify forward-looking statements. All statements other than statements of
    historical facts included in this presentation, including, without limitation, those regarding the Company’s financial
    position, potential business strategy, potential plans and potential objectives, are forward-looking statements. Such
    forward-looking statements involve known and unknown risks, uncertainties and other factors which may cause the
    Company’s actual results, performance or achievements to be materially different from any future results, performance
    or achievements expressed or implied by such forward-looking statements. Such forward-looking statements are
    based on numerous assumptions regarding the Company’s present and future business strategies and the
    environment in which the Company will operate in the future. Further, certain forward-looking statements are based
    upon assumptions of future events which may not prove to be accurate. The forward-looking statements in this
    document speak only as at the date of this presentation and the Company assumes no obligation to update or provide
    any additional information in relation to such forward-looking statements.

    The merits or suitability of investing in any securities previously issued or issued in future by the Company for any
    investor’s particular situation should be independently determined by such investor. Any such determination should
    involve, inter alia, an assessment of the legal, tax, accounting, regulatory, financial, credit and other related aspects of
    the transaction in question.

2
Keith Barr
    Chief Executive Officer

3
2021: excellent progress

    RevPAR & Rooms                                                Results
          •   +46% Global RevPAR vs 2020; (29.8)% vs 2019, with            •    $534m operating profit from reportable segments,
              Q4 (17.1)%                                                        +144% vs 2020
          •   Further sequential improvement in US, with RevPAR            •    $75m of recurring cost savings delivered
              ahead of 2019 levels in December
                                                                           •    $571m adjusted free cash flow
          •   System 880k rooms (5,991 hotels); +5.0% gross
              openings; (0.6)% net YOY                                     •    Net debt:adjusted EBITDA 3.0x
          •   Opened 291 hotels; signed 437 hotels, +23%                   •    Dividend reinstatement: 85.9¢ proposed

    Laying the foundations for future growth                      Further brand developments
         •    Strengthened digital booking experience                  •       Launch of Vignette Collection brand

         •    Transforming our loyalty offer                           •       Recent brands rapidly reaching scale – voco >50; avid
                                                                               >200
         •    New mobile app to be launched in 2022
                                                                       •       Review of Holiday Inn and Crowne Plaza estate
         •    Ongoing operational support to our owners                        completed; lower removals going forward
         •    Underpinned by our commitment to operate a               •       Pipeline >30% of current system size; 40%+ under
              responsible business                                             construction

4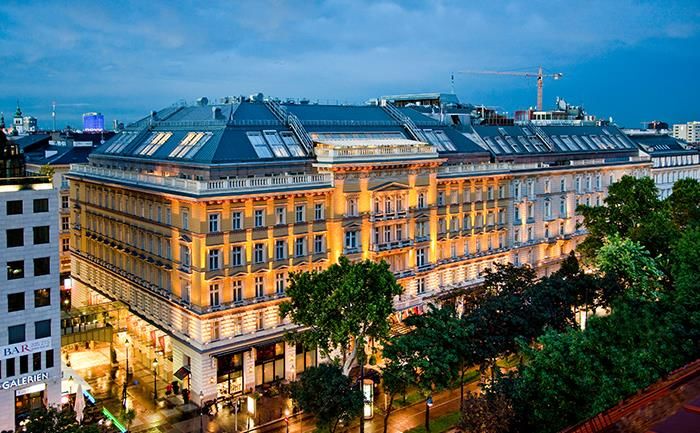
Emerging from the pandemic a better, stronger business

             Raised the quality and consistency of the estate

             Stronger and more efficient operating model

             More rounded brand portfolio, with increased focus on Premium and
             Luxury & Lifestyle

             Leading technology offering for guests and owners

             Significant investment in loyalty to drive further competitive advantage

             Launch of ambitious 2030 responsible business commitments

5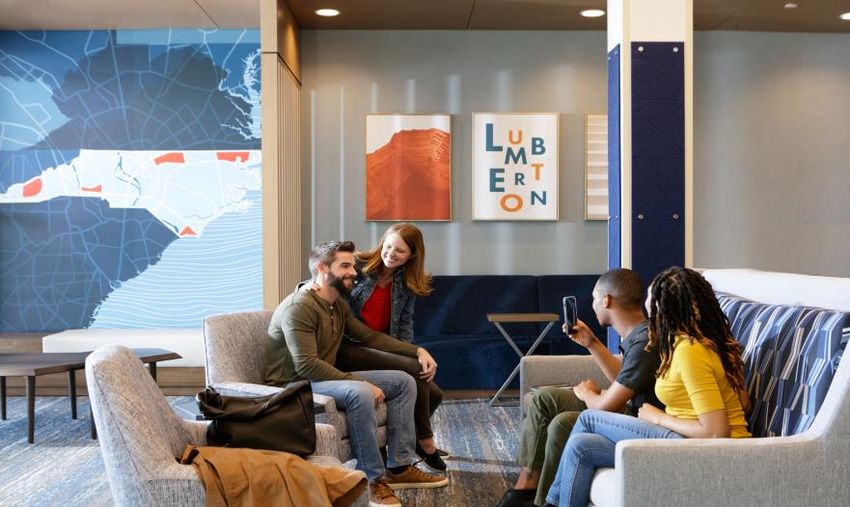
Paul Edgecliffe-Johnson
    Chief Financial Officer & Group Head of Strategy
    FY 2021 Financial Review
6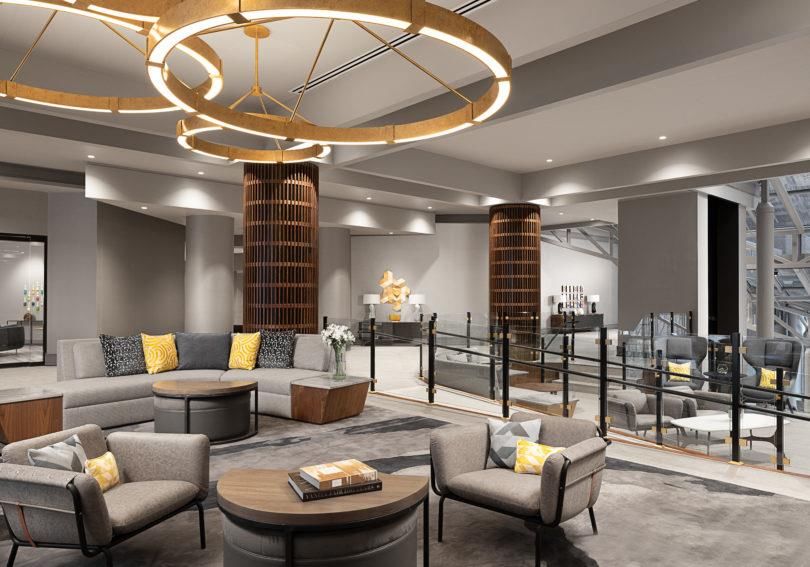
Financial performance overview
     Results from reportable segments1                                                                                            Reported                                                                           Underlying2

                                                                                       FY 2021                         FY 2020                                      FY 2019                                  FY 2020                 FY 2019

                                                                                                                                % change                                      % change
                                                                                           $m                   $m                                          $m                                             % change                 % change
                                                                                                                               vs FY 2021                                    vs FY 2021

     Revenue                                                                           $1,390m               $992m                 +40%                 $2,083m                  (33)%                         +39%                    (32)%

     Operating profit                                                                   $534m                $219m                +144%                  $865m                   (38)%                        +138%                    (38)%

     Revenue from fee business                                                         $1,153m               $823m                 +40%                 $1,510m                  (24)%                         +38%                    (23)%

     Operating profit from fee business                                                 $570m                $278m                +105%                  $813m                   (30)%                        +104%                    (30)%

     Fee margin3                                                                         49.6%               34.1%             +15.5%pts                  54.1%               (4.5)%pts

     Adjusted interest4                                                                $(142)m             $(130)m                  +9%                 $(133)m                   +7%

     Reported tax rate5                                                                  (31)%               (38)%               (7)%pts                  (24)%                 +7%pts

     Adjusted EPS6                                                                      147.0¢                31.3¢               +370%                  303.3¢                  (52)%

     Dividend for the year                                                               85.9¢                   -                   NM                   39.9¢                 +115%
    1 Reportable  segments excludes System Fund results, hotel cost reimbursements and exceptional items. 2 Reportable segment results excluding significant liquidated damages, current and prior year owned asset disposals and stated at constant FY 2021
    exchange rates (CER). 3 Excludes owned, leased and managed lease hotels, significant liquidated damages and the results of the Group’s captive insurance company. 4 Adjusted interest adds back $3m (FY 2020: $4m; FY 2019: $18m) of interest charges
    attributable to the System Fund and excludes exceptional items. 5 The Group’s reported effective tax rate, before exceptional items and System Fund results. 6 Calculated using results from Reportable Segments, adjusted interest, and related tax and
    excluding changes in fair value of contingent purchase consideration (and related tax) and earnings attributable to non-controlling interest

7
Fee-based business model shows relative resilience as
      demand returns
                                                                                          FY 2021 fee revenue: $1,153m, down 24%1 and 23% underlying2 (vs 2019)

                                                                                          FY 2021 Group comparable RevPAR growth                                                  FY 2021 Group system growth
                         RevPAR                                                                          (vs 2019)                                                                         (vs 2019)

                                 X                                                                                                                                                       9.4%
                                                                                                                                                                                                                          • 44.0k rooms opened in FY
                                                                                                    -8.0%                                                                                                                 • 49.7k rooms removed in FY
                          Rooms
                                                                                                                     -16.5%pts

                                 X
                                                                                                                                                                                                             -0.4%

                                                                                                                                          -29.8%
                   Royalty Rate
                                                                                                     ADR            Occupancy            RevPAR                                        Gross                  Net

                                                                                                       (31.8)% Total RevPAR decline3                                                  +5.9% growth in available rooms3

                                                                                 •     Underlying fee revenue benefitting from stronger performance in Franchise business (-24.2%4) than overall
                                                                                       Group RevPAR (-29.8%4), which includes weaker Owned, Leased and Managed Lease estate (-57.9%4)

    ¹ Growth stated at AER. ² Underlying fee revenue excludes current and prior year owned, leased and managed lease hotels, significant liquidated damages, owned asset disposals and stated at constant FY 2021 exchange rates (CER). 3 Growth stated for
    underlying fee business excluding the SVC portfolio termination of 16.7k rooms (102 hotels) in Q4 2020 (see appendix for more detail).4 RevPAR in comparable estate vs 2019, at CER.

8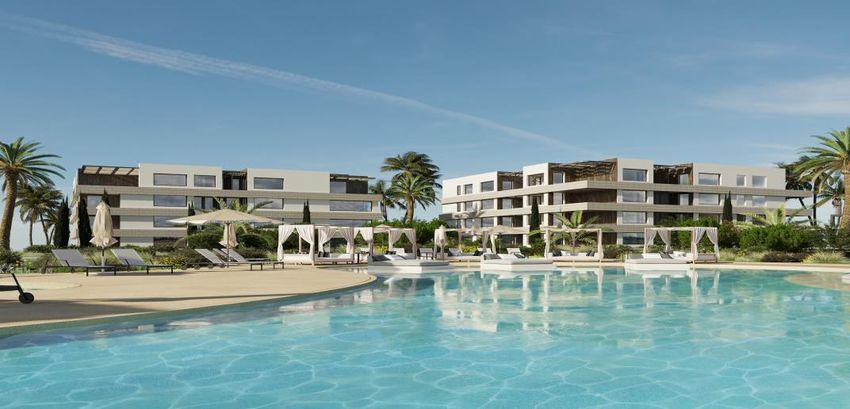
Regional variations in RevPAR with strong ADR recovery in all
    regions
           Americas monthly RevPAR, Occupancy and ADR (vs 2019)                                 EMEAA monthly RevPAR, Occupancy and ADR (vs 2019)
                                                                                  0

                                                -7                         -7
                                                      -12    -11    -11
                                         -20
                                  -28
                           -32                                                                                                                                     -30
                                                                                                                                                             -33
                    -39                                                                                                                    -38         -36
     -45     -45                                                                                                                                 -43
                                                                                                                                     -48

                                                                                                                               -59
                                                                                                                         -66
                                                                                               -71   -73    -71    -70

    Jan     Feb    Mar    Apr    May    Jun    Jul   Aug    Sep    Oct    Nov   Dec            Jan   Feb    Mar    Apr   May   Jun   Jul   Aug   Sep   Oct   Nov   Dec

    Greater China monthly RevPAR, Occupancy and ADR (vs 2019)                                  IHG Group monthly RevPAR, Occupancy and ADR (vs 2019)

                                               -6
                                 -12                                                                                                                               -12
                          -15                                                                                                        -18               -19   -19
                                        -22                                                                                                -23   -22
                   -23                                      -26    -25
                                                                                -28                                            -31
                                                                                                                         -37
    -42                                                                                                            -41
                                                                          -46                               -47
            -51                                                                                -53   -54
                                                     -55

                                                                           RevPAR (%)   Occupancy (% Pts)         ADR (%)

9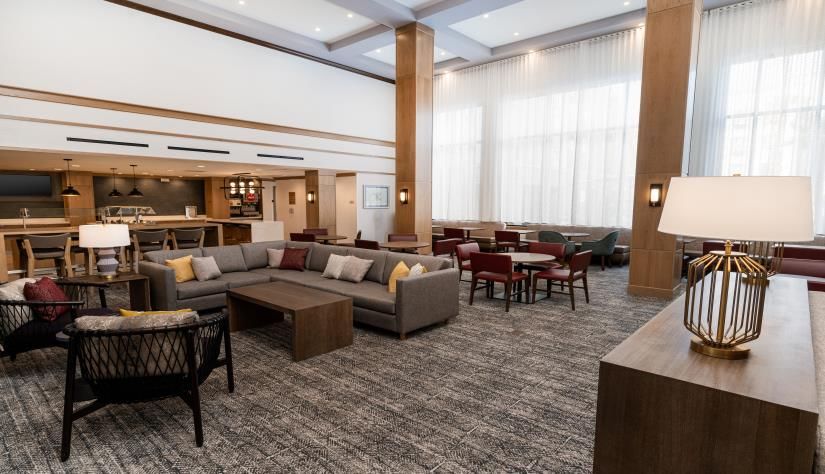
Americas
     Strength across US franchise estate in Q4
         •      FY RevPAR up 54% (down 20% vs 2019); US up 54% (down 17% vs 2019)                                                                                           FY 2021 growth in fee revenue drivers1
         •      Q4 US RevPAR up 76% (down 5% vs 2019)                                                                                                                                                     (vs 2019)
               -        Driven by demand in non-urban and leisure markets
               -        Franchised estate down 2% and Managed estate down 23% (vs 2019)
                                                                                                                                                                                                               -4.7%
               -        Midscale/Upper Midscale and Extended Stay most resilient segments

         • YoY net rooms down 2.9% (down 4.9% vs 2019); gross up 3.1% (up 6.2% vs 2019)
               -        Ground breaks accelerated to 30 in Q4, 79 for the year
                                                                                                                                                                                 -19.7%                                                  -18.6%
         • Underlying fee revenue1 up 51% to $691m (down 19% vs 2019)                                                                                                            RevPAR                     Net Rooms                Fee revenue
         • Underlying fee operating profit2 up 75% to $568m (down 14% vs 2019):
                     • vs 2020: benefit from improved demand
                     • vs 2019: impacted by $5m lower incentive management fees and continued
                                                                                                                                                                                   FY 2021 net rooms growth (‘000s)
                       tough trading in US-urban and non-US markets; partly offset by $11m payroll tax                                                                                                       (vs 2019)
                       credit benefit and delivery of sustainable cost savings                                                                                                       525

         • Owned, leased and managed lease operating profit up $18m to a loss of $9m (down                                                                                                                                                   499
             $46m vs 2019):                                                                                                                                                                             (58)
                     • vs 2019: impacted by weighting of distribution to US-urban and non-US markets                                                                                                                        32

         • Pipeline: 97k rooms; 17.6k signed in FY
         • Signings include 62 Holiday Inn Express, 30 Candlewood Suites and 13 avid hotels                                                                                       FY 2019              Exits          Openings            FY 2021

     1 Underlying   fee revenue excludes significant liquidated damages, current year disposals and stated at constant FY 2021 exchange rates (CER).   2 Underlying   fee operating profit excludes significant liquidated damages and current year disposals at CER.

10
Americas
Ongoing strength of Leisure with improvement in Business demand
IHG US estate 12m rolling revenue (vs 2019)
11% 17% 10%
7% 6% 5%
-2% -7% -2%
-4% -3%
-10% -10%
-13% -12% -13%
-21%
-24% -24%
-27%
-33%
-43% -42% -42%
-42% -37% -37% -37%
-50% -40%
-41% -42%
-44% -45% -46%
-56% -47% -46%
-48%
-51%
-54% -53%
-61%
-57% -65%
-72%
-76%
-88%
Jan'20 Feb'20 Mar'20 Apr'20 May'20 Jun'20 Jul'20 Aug'20 Sep'20 Oct'20 Nov'20 Dec'20 Jan'21 Feb'21 Mar'21 Apr'21 May'21 Jun'21 Jul'21 Aug'21 Sep'21 Oct'21 Nov'21 Dec'21
Business Leisure
11Europe, Middle East, Asia & Africa
Improved trading in markets where travel restrictions have lifted
FY 2021 growth in fee revenue drivers1
• FY RevPAR up 35% (down 52% vs 2019); Q4 up 118% (down 33% vs 2019) (vs 2019)
• Q4 impacted by differing levels of government-mandated lockdown measures, particularly 0.8%
Continental Europe (down 40% vs 2019); Japan (down 56% vs 2019) and South East
Asia and Korea (down 59% vs 2019); less restrictive markets such as UK (down 16% vs
2019) and Middle East performed better (down 10% vs 2019)
• YoY net rooms down 1.6% (up 0.4% vs 2019); gross up 4.5% (up 9.6% vs 2019) -51.6% -54.3%
• Underlying fee revenue1 up 37% to $149m (down 54% vs 2019) RevPAR Net Rooms Fee Revenue1
• Underlying fee operating profit2 up $51m to $32m (down 84% vs 2019):
• vs 2020: improved demand and $15m higher incentive management fees FY 2021 net rooms growth (‘000s)
• vs 2019: impacted by $61m lower incentive management fees and continued tough
(vs 2019)
trading in a number of markets, partly offset by cost savings 223 224
• Owned, leased and managed lease operating loss of $27m (up $5m vs 2020, down $42m
vs 2019)
(21) 21
• Impacted by weak demand where these hotels are located, predominately in urban
markets in Europe (FY RevPAR down 69% vs 2019)
• Pipeline: 81k rooms; 20.4k signed; significant pick up in signing pace in Q4
• Signings include 5 Six Senses, 15 InterContinental hotels, 6 Vignette Collection hotels
FY 2019 Exits Openings FY 2021
and 10 voco hotels
1 Underlying fee revenue excludes significant liquidated damages, current year disposals and stated at constant FY 2021 exchange rates (CER). 2 Underlying fee operating profit excludes significant liquidated damages and current year disposals at CER.
12Greater China
Impacted by localised lockdowns
FY 2021 growth in fee revenue drivers1
• FY RevPAR up 21% (down 29% vs 2019); Q4 down 17% (down 33% vs 2019)
(vs 2019)
• Mainland China up 20% (down 25% vs 2019); Q4 down 21% (down 33% vs 2019)
15.9%
• Tier 1 RevPAR up 26% (down 35% vs 2019); Q4 down 15% (down 40%
vs 2019)
• Tier 2-4 RevPAR up 17% (down 19% vs 2019); Q4 down 23% (down 29% vs 2019)
• Hong Kong SAR up 81% (down 61% vs 2019); Q4 up 84% (down 12% vs 2019) -19.1%
-28.7%
• YoY net rooms up 8.9% (up 15.9% vs 2019); gross 12.5% ( up 21.7% vs 2019) RevPAR Net Rooms Fee Revenue1
• Underlying fee revenue1 up 34% to $110m (down 19% vs 2019)
FY 2021 net rooms growth (‘000s)
• Underlying operating profit2 up 44% to $52m (down 32% vs 2019):
(vs 2019) 157
• vs 2020: driven by improved trading, $9m higher incentive management fees, and
$6m significant liquidated damages 136 29
• vs 2019: impacted by $23m lower incentive management fees (8)
• Pipeline: 93k rooms; 30.8k rooms signed
• 80 franchise agreements signed, including 50 for Holiday Inn Express
• Over 1,000 open and pipeline hotels FY 2019 Exits Openings FY 2021
1 Underlying fee revenue excludes significant liquidated damages, current year disposals and stated at constant FY 2021 exchange rates (CER). 2 Underlying fee operating profit excludes significant liquidated damages and current year disposals at CER.
13Delivered $75m of recurring fee business cost savings in FY 2021
Progression in fee margin1 Efficient cost base
Overheads cost base per hotel ($’000)
-4.5%pts
54.1%
160
0.1% 1.7% 2.7% 1.6% 3.4% 4.8% 3.1% 4.0% 4.8% 5.6%
0.3% -0.6%
10
53.3%
49.6% 140 0
-10
120
-20
100
34.1% -30
80 -40
60 -50
-60
40
-70
20
-80
0 -90
2010
2011
2012
2013
2014
2015
2016
2017
2018
2019
2020
2021
FY 18 FY 19 FY 20 FY 21
Net System Size growth Overheads cost base per hotel
• Fee margin down 4.5%pts at AER relative to FY19 with
RevPAR down 30% vs 2019 • A platform business with a well invested cost base
• $75m in recurring annual cost savings delivered • Limited increases in overheads required to support growth in
system size
• $25m of additional temporary cost savings in 2021 from
elevated vacancy rates and lower travel expenditure • Overheads cost base per hotel 27% lower than a decade ago
Continued strong focus on cost efficiency and operating leverage will drive further fee margin progression
1 Fee margin stated at AER
14Fee margin1 by region
Americas Europe, Middle East, Asia and Africa
FY 2021 82.2% FY 2021 21.5%
FY 2020 70.7% FY 2020 -17.9%
FY 2019 77.7% FY 2019 58.6%
Greater China Total IHG
FY 2021 47.3% FY 2021 49.6%
FY 2020 45.5% FY 2020 34.1%
FY 2019 54.1% FY 2019 54.1%
1 Fee margin excludes owned, leased and managed lease hotels, significant liquidated damages and the results of the Group’s captive insurance company; is stated at AER.
For Americas, consists of fee business revenue and operating profit of $691m (2020: $457m, 2019: $853m) and $568m (2020: $323m, 2019: $663m) respectively. For Europe, Middle East, Asia and Africa consists of fee business revenue and operating
profit (adjusted for significant liquidated damages) of $149m (2020: $106m, 2019: $326m) and $32m (2020: $(19)m, 2019: $192m) respectively. For Greater China, consists of fee business revenue and operating profit (adjusted for significant liquidated
damages) of $110m (2020: $77m, 2019: $135m) and $52m (2020: $35m, 2019: $73m) respectively.
15Conclusion of Holiday Inn and Crowne Plaza review
Addressed the consistency
151 hotels have left the system 83 hotels with significant investment commitment from owners
and quality of the estate
71 hotels retained2
• ~80% of removals in the
Americas were in the
bottom quartile for metrics
including RevPAR, RGI,
108 hotels exited1 Guest Love and quality
Pre-renovation lobby New lobby design scores
12 hotels retained2 • 66% of Holiday Inn
estate2 and 73% of
Crowne Plaza estate2 in
Americas will have
recently been updated or
due to undergo renovation
43 hotels exited1 Pre-renovation room New guest room design
1 Total removal across the global estate
2 Committed to improvement plans or scopes of work, reflecting significant investment by owners across Americas and EMEAA
16Delivering an industry leading level of net system size growth
Acceleration in gross openings… …will lead to stronger net system size growth
7.8% 5.6%
7.1% ~7%+ ~5%+
4.8%
6.3% ~6%+
5.4% 4.0% ~4%+
5.0%
4.5% 3.1%
0.3%
2016 2017 2018 2019 2020 2021 2022E 2023E
-0.6%
2016 2017 2018 2019 2020 2021 2022E 2023E
…combined with structurally lower removals Confidence underpinned by:
• >40% pipeline under construction
~-1.5% ~-1.5%
-2.3% -2.2% -2.2% -2.2% • Healthy volume of deal discussions across
regions
1.6% average removal
rate for estate excluding -4.2%1
Holiday Inn and Crowne • Compelling owner offer with a complete brand
Plaza
-5.6%2
portfolio across chainscales and global reach
1 2.3% excluding 1.9%pt impact from termination of certain hotels by SVC
2 1.7% excluding 3.9%pt impact from removal of Holiday Inn and Crowne Plaza hotels across the Group
17Improvement in development activity
IHG brands outperforming peers Increase in franchise applications…
113 2021 Guest Satisfaction Index Americas franchise applications
477
400
avid
All other brands
257
In line with 100
peers 158
avid Candle- voco Holiday Hotel Staybridge Inter- Kimpton Crowne Holiday Hualuxe Six Even Regent
wood Inn Indigo Continental Plaza Inn Senses
Express
2018 2019 2020 2021
…supporting an improvement in signings Further progression in gross openings
Global signings (rooms, k) Room openings (rooms, k)
98.8 97.8 65.2
56.3
68.9 44.0
56.1 39.4
2018 2019 2020 2021 2018 2019 2020 2021
18Targeted capital expenditure to drive growth
$m FY 2021 FY 2020 • Maintenance: relates to owned,
Maintenance capex, Maintenance capex (33) (43) leased and managed lease hotels and
key money and selective corporate infrastructure
Key money1 (42) (64)
investments • Key money: used to secure hotel
Total (75) (107) signings
$m FY 2021 FY 2020
• Investment behind growth initiatives
Gross out (5) (6)
Recyclable • Profile can vary year to year, but
investments Gross in 58 23 expected to be broadly neutral over
Net total 53 17 time
$m FY 2021 FY 2020
• Invested into projects that benefit our
Gross out (19) (35) hotel network
System Fund capital
investments Gross in2 91 58 • Repaid when depreciation charged to
Net total 72 23 System Fund e.g. GRS
Gross total3 (100) (148)
Total capital investments
Net total 50 (67)
1Key money presented net of repayments of $1m in FY 2021 (FY 2020: nil); 2 Consists of depreciation and amortisation of $94m in FY 2021 (FY 2020: $62m), adjusted to exclude depreciation for right of use assets of $3m (FY 2020: $4m). 3 Includes gross
key money payments of $43m in FY 2021 (FY 2020: $64m)
19Strong cash conversion
Cash flow FY 2021 ($m)
(12)
149
(212)
89
(75) (13) 56
(19) 53
632 648
571
Adjusted System Fund2 Working Exceptional Interest & tax Maintenance Adjusted free Gross System Net Recyclable Deferred Lease Decrease
EBITDA1 capital & other cash flow items capex and cash flow Fund capex capex purchase movements, in net debt
movements3 key money consideration FX and
paid other items4
• Increase in adjusted free cash flow to $571m (2020: $29m), driven by strong cash conversion and System Fund swing to inflow on improved
trading and higher depreciation
1 Before exceptional items and System Fund result. 2 System Fund inflow reflects $(11)m in-year deficit adding back $94m of depreciation and amortisation and $6m of other non-cash adjustments to System Fund result; working capital movements related to
the System Fund, including movements in deferred revenue, are included within the Group’s overall working capital & other movements. 3 Includes working capital and other adjustments ($110m), and other non-cash adjustments to operating profit/loss
($71m) less principal element of lease payments ($32m). 4 Includes principal element of lease repayments ($32m) and favourable exchange and other non-cash adjustments ($24m)
20Significant reduction in leverage
Bond maturity profile Leverage Shareholder returns
• 2022 maturity expected to be • Reduction in net debt : adjusted • 2021 final dividend of 85.9¢
funded through cash balances EBITDA driven by recovery in proposed, equivalent to the
• No significant bond maturity until profitability and strong cash withdrawn 2019 final dividend
2024 generation • Track record of strong shareholder
• Leverage within target of 2.5-3.0x returns with $13.6bn returned to
net debt/adjusted EBITDA shareholders since 2003
Bond maturity ($m) net debt : adjusted EBITDA (covenant basis)1 Shareholder returns 2003-2019 ($bn)
565 570
537 8.7x 13.6
473
408
5.8
Original 7.8
233 covenantOur strategy for uses of cash remains unchanged
Invest in the Sustainably grow Return surplus
business to the ordinary funds to
drive growth dividend shareholders
Objective of maintaining an investment grade credit rating
2.5x – 3.0x Net Debt : Adjusted EBITDA under normalised conditions
22Keith Barr
Chief Executive Officer
Update on strategic priorities
23An evolving and dynamic industry
Desire to travel Rapid return of demand
and experience; as vaccination rates
build connections increase and restrictions
are lifted
Independent hotels
Sustainability
looking for
informing guest
enterprise capability
preferences
of branded system
Technology becoming Combination of
more integral to the business and
guest journey leisure trips
24Focus on industry-leading net rooms growth, underpinned by our
strategic priorities
Our Purpose: True Hospitality for Good
Ambition: to deliver industry-leading net rooms growth
Our Priorities:
Build loved Customer centric Create digital Care for our people,
and trusted brands in all we do advantage communities and planet
• Strengthening positioning • Supporting our owners to • Enabling attribute pricing • Workstreams underway to
and further growth alleviate operational and selection of stay meet upgraded 2030
potential of existing brands challenges enhancements science-based target
• Accelerating scale and • Focusing marketing on • Simplification of room • Miniature bathroom
growth of newer brands key demographics to rates enhancing amenities being removed
drive more demand customer booking
• Launch of new Luxury & experience • Strengthened DE&I
Lifestyle collection brand • Supporting the return of programmes
business travel, groups • Next generation IHG
• Investment in development and events mobile app under • Human rights focus
resources development and piloting
• Enhancing our loyalty
offer
25Build loved and trusted brands
- More opportunities for guests and owners with IHG
Existing brands Newer brands Portfolio evolution
Luxury Six Senses and Regent: acquisitions to
& Lifestyle expand IHG’s luxury presence
Organic development of new Luxury &
Lifestyle collection brand
voco hotels: organic development
Premium targeting global conversion opportunity
avid hotels: organic development to
Essentials create additional midscale growth engine
Atwell Suites: organic development to
Suites capture further growth for longer stays
26Build loved and trusted brands - Breadth of brand portfolio enabling multi-property deals Grand Hotel Wien, Austria – signed as a Vignette Collection hotel Penina Resort & Golf, Portugal – signed as a Vignette Collection hotel 27 Dona Filipa Hotel, Portugal – signed as a Vignette Collection hotel voco Algarve, Portugal – Conversion of the Formosa Park Apartments
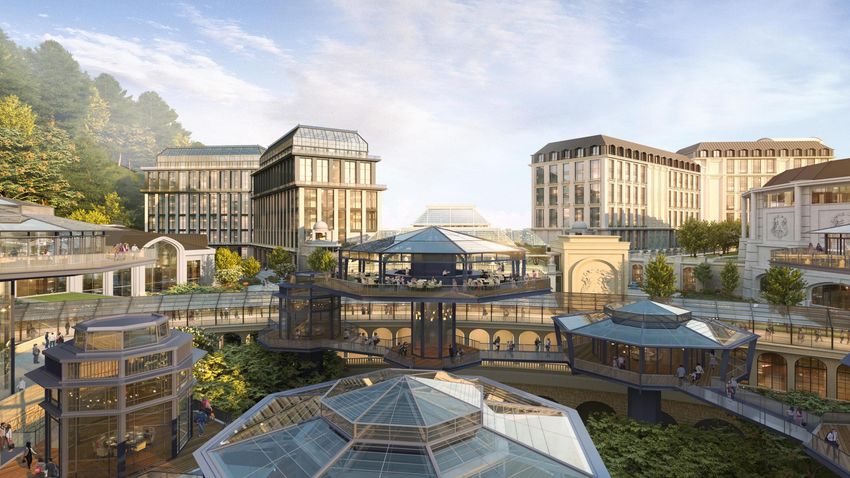
Build loved and trusted brands
- Portfolio of two Holiday Inn Resorts, a voco and a Crowne Plaza with strategic partner

28   28
Exterior view of Ba Na Hills Entertainment Complex (Phase Two) - due to open in 2026
Build loved and trusted brands
       - New brands offer significant fee growth opportunity

Date launched/
                                                      2019                             2017      2018     2018     2019     2021
   acquired
                                     Approx
                                      further           ~15
                                    required
   Targeting
                                                                                        ~225
annual fees of                                                                                   ~20
                                                                                                          ~130
 at least $50m
each; potential                     Pipeline             33
                                                                                                                   ~310     ~100
     to drive
   aggregate
  $300m+ in                                                                             164       8
  annual fee                                                                                               38
     income                             Open             21
                                                                                                  7        31
                                                                                         48                         23

      Average fee
                                                ~$750k-$1m                             ~$115k   ~$1.5m   ~$250k   ~$150k   ~$450k
     income/hotel1
1:   Represents average annualised fee income per hotel, once hotel reaches maturity

29
Build loved and trusted brands
- Early successes with avid and voco
avid hotels – delivering on guest and owner needs
• The basics done exceptionally well
• Clear and simple booking
• Focused high-quality breakfast
• Attractive owner returns enabled by an efficient build and operating model
• Significant outperformance of peers in Guest Satisfaction Index
voco hotels – broad appeal for owners and guests
• Strong traction in both urban and leisure markets with resort signings in Algarve,
Vietnam and Southern France
• Key flagship properties added in New York, Singapore and Dubai
• Provides owners with rapid access to IHG systems and revenue delivery
• Ranks at top of competitive set across Guest Satisfaction Index and named
“Leading Premium Brand” at World, Europe & Middle East level at the World
Travel Awards
30Build loved and trusted brands
- Places to interact and connect
• Key signature features of Atwell Suites • Open Lobby product now • Refreshed brand design, including
include spaces to connect and collaborate installed/committed across more than updated room layout and lobby design
90% of the estate in Europe conducive to co-working
• Guests can create personalised
environments with more flexible meeting • Driving uplifts in guest satisfaction and • Approximately 50% of global estate
spaces Food & Beverage revenue recently renovated or committed to
near-term renovation. This includes
• Attractive returns for owners in a fast • Attractive returns for owners, with two-thirds of hotels in the Americas region
growing segment, leading to accelerated typical payback in 3-5 years
signings pace in 2021 • Renovated hotels continue to see
improvement in financial performance and
guest satisfaction
31Build loved and trusted brands
- Holiday Inn Express: Category leadership
>3,000 Holiday Inn Express hotels; single largest global brand in the industry
Holiday Inn Express: Formula Blue
• Next generation hotel room and public area designs launched in 2014
• Have continually updated Formula Blue guestroom and public space designs
• On track for ~70% adoption across US and Canada by end of 2022
• Delivering ~10% cost saving for owners and 5%pt premium in Guest Satisfaction scores
Strong RevPAR recovery during 2021
Holiday Inn Express US RevPAR (vs 2019)
1% 0% 3% 2%
-11%
-18% -19% -15%
-30%
-34%
-38% -37%
-43% -41%
-64%
-67%
Q1 20 Q2 20 Q3 20 Q4 20 Q1 21 Q2 21 Q3 21 Q4 21
Holiday Inn Express Upper Midscale segment Source: STR
32Build loved and trusted brands
- Increased weight of Luxury & Lifestyle
IHG has developed a well balanced consumer offer Nearly 200 years of Luxury expertise Proportion of signings from higher value
across Luxury & Lifestyle across our brands Luxury & Lifestyle hotels is up by 2.5x
% of signings from Luxury & Lifestyle
• Built upon the heritage of 23%
Upper
Luxury InterContinental Hotels &
Resorts, the world’s single largest
luxury hotel brand
• Addition of Kimpton Hotels &
Restaurants brought luxury F&B
Traditional Lifestyle expertise
9%
• Sustainable tourism, Spa and
wellness capabilities enhanced
with Six Senses
Upper • Upper Luxury knowhow from
Upscale Regent 2017 2021
33Build loved and trusted brands
- Further developments in Luxury & Lifestyle
• Completed rebranding plan to reinvigorate Regent’s brand
identity, design aesthetic, service culture and visual image
• Transformation of InterContinental Hong Kong to Regent on
track to be completed in 2022
• Opening of Regent Phu Quoc, Vietnam in 2022
• 7 open Regent hotels and 8 in pipeline Regent Sanya Haitang Bay and Hotel Indigo Sanya Haitang Bay
(due to open in 2026)
• Continued international expansion of Kimpton after
first opening outside US in 2017
• Footprint rapidly grown with openings from Paris to Koh Samui,
signings in Australia; new resort locations include Mallorca
• First Kimpton hotel in Mainland China in Suzhou expected to
open in 2022
• 75 open Kimpton hotels and 35 in pipeline Kimpton Mallorca (due to open in 2022)
34Customer centric in all we do
- Supporting owners to maximise ROI
New cost effective prototype with a
15% reduction in building size
Focus on efficient
In its latest format, now achieving a
design and cost ~10% reduction in cost per key across
management furniture, fixtures and equipment
New prototypes with more efficient
and flexible base plans
Holiday Inn Express Lumberton, NC, US
• Upweighting commercial support through
opening process
Faster ramp up of • Provide broader procurement programmes to
new hotel openings owners
• Significant acceleration in ramp up time across a
number of brands through 2021
Staybridge Suites Temecula, CA, US
35Customer centric in all we do
– Transforming loyalty
100m+ ~50% 20% 9x ~15%
members of room nights more spend more likely less points
and growing consumed by members than non-members to book direct required to book1
1 achieved through Reward Night Dynamic pricing
36Create digital advantage
- Leveraging technology to drive profits and performance
• Completed room inventory reset across ~95%1 hotels
• Carried out rate simplification and rate parity initiatives,
including centralisation of wholesale distribution Attribute
• Enables the ability of attribute pricing, allowing guests to choice
choose rooms based on specific characteristics
• Addition of non-room stay enhancements gives even greater
opportunity for upsell and cross-sell
• Owners can unlock value through optimising dynamic pricing F&B Late/early Bonus
for most desirable attributes and enhancements offers vheck-in/out points
• Guests fully able to customise their stay
• Initial results from our pilot have been positive in
delivering improved guest experience and bringing valuable
Stay
hotel stay options to life enhancements
Other examples
• Full options only available to guests who book direct through • Rollaway beds
IHG channels • Club access
• Spa offers
• Further functionality to be rolled out in 2022 with launch of • Attractions
• Local curated experiences
next generation IHG mobile app
Parking Amenities
1: As at February 2022 in room
37Care for our people, communities and planet
- 2030 Responsible Business ambitions and commitments
Champion a diverse Improve the lives of 30 Reduce our energy use and Pioneer the transformation Conserve water and help
culture where everyone million people in our carbon emissions in line with to a minimal waste secure water access in those
can thrive communities around the climate science hospitality industry areas at greatest risk
world
• Corporate employees • Further evolved our IHG • Upgraded our 2030 • Bulk bathroom amenities • Completed hotel level risk
completed >10,000 hours of Academy programme with science-based target to in place or agreed for all mapping to inform future
Conscious Inclusion training the launch of IHG Skills 1.5oC that delivers: brands and markets strategy
that will be extended to hotel Academy - 46% absolute reduction globally • Water stewardship projects
leadership in 2022 • 40,000 colleagues in CO2 from our owned, • Targeting elimination of underway including in
• Expanded Employee volunteered to help more leased, managed and single use-items across Greater China and Australia
Networks with more than than 350,000 people during franchise hotels the guest stay • WASH: pilots to support
1,300 members globally; IHG’s Giving for Good • Every single hotel globally • Global food waste training water.org projects helping to
represent groups including month in September 2021 has its own energy metric reach 15,000 people gain
• Pilot project with WRAP in
ethnic minorities and LGBT+ • Supported multiple relief access to clean water in
• Maximise / optimise the the UK, allowing learnings
• Named a Global Best efforts role of renewable energy to be rolled out globally India, Indonesia and Mexico
Employer by Kincentric
38Our multi-year journey to a better, stronger company
- Supporting confidence in industry-leading net system growth
Rounded out brand ladder Enhancing established brands and global reach
Number of hotel brands • Creating an industry leading Luxury & Lifestyle offer (13% of system
+6 17 size and 19% of pipeline)
11 • Over 1,200 hotels with Holiday Inn Express next generation guest room
designs across North America estate since launch in 2014
• New Holiday Inn public space and guest rooms designs in the US now
present or committed to in >250 hotels since 2017
• Extended lead in China; highly successful internationalisation of brands
2016 2021
Delivering a stronger connection with guests Driving returns for owners
• Improved booking experience: development of easy to book stay • Superior technology platforms: IHG Concerto recognised as the
enhancements and next generation mobile app industry leader in supporting how owners assess property performance
through real time insights and analytics
• Loyalty: transforming the IHG Rewards programme
• Increased enterprise capability: cost effective distribution for owners
• Journey to Tomorrow: launch of ambitious 2030 Responsible
Business Commitments • Strengthened procurement: delivered net year-on-year savings of
more than 10% for owners across the $1.3bn of spend managed by
• Guest Satisfaction: outperforming peers with index at or above 100 IHG
for all brands while driving quality and consistency of estate
39Conclusions
- Confident on future growth prospects and our strategic priorities
• Strong financial performance with operating profit from reportable segments more than doubling and net debt
substantially reducing
• Emerging from the pandemic a stronger and more agile business
• Hotel development environment strengthening: 291 hotel openings and 437 signings, a sizeable increase
• Executing against our strategic priorities and well placed to achieve our ambition of industry-leading net rooms growth
in the years ahead
• Actions taken over last two years position us well to exceed pre-pandemic levels of growth and profitability
• Confidence in the strength of IHG’s enterprise, market positioning and ability to drive attractive levels of long-term,
sustainable growth
402021 Full Year Results
Q&A
41Hotel X, Vignette Collection, Brisbane, Australia
AppendicesStrong portfolio of preferred brands, geographically diverse and
asset light
Suites Essentials Premium Luxury & Lifestyle
Strong portfolio
of brands
Owned, Leased Luxury
& Managed 157k 10%
Managed Leases 18% Midscale/Upper 93k
28% 1% Midscale 34% 97k
Asset light and Total 68%
Total Total Pipeline 36%
geographically rooms: rooms: Upscale
rooms: rooms:
22%
diverse 880k1 224k 880k1 880k1 271k1
25%
499k
Franchised 57% 81k
71% 30%
~90% of profits from fee business fees Americas
High quality fee
~80% of fee revenue linked to hotel revenues EMEAA
stream
~10% of fee revenue linked to hotel profits
Greater China
1 Rooms as at 31 December 2021
43Build loved and trusted brands
- Continued resilience across Essentials and Suites
Essentials Suites
System1 3,016 1,190 48 315 361 -
Pipeline1 645 244 164 156 93 23
Chain
Upper Midscale Upper Midscale Midscale Upscale Midscale Midscale
scale2
• ~60% occupancy in • Two-thirds of • Outperformance • >70% occupancy in Q4 across Extended Stay brands; ahead of
Q4 Americas estate across Guest 2019 levels
recently/ Satisfaction Index
• Outperformance on committed to (GSI) • Signed 68 properties across Suites brands in FY21
Guest Satisfaction renovation
Index and up YoY • 105 hotels under • New prototype design with lower cost-to-build; open/committed in
• Open Lobby construction or >170 Candlewood Suites and >160 Staybridge Suites
• Formula Blue 2.0 in adopted in with plans
Americas delivering nearly entire approved/
• Construction underway for 3 Atwell Suites with first property in
~10% cost savings estate in Europe submitted
Miami on track to open in Q1; continued positive response from
for owners owners and interest in conversion opportunities
1 Hotels as at 31 December 2021; 2 STR classification
44Build loved and trusted brands
- Expanding our Premium and Luxury & Lifestyle offerings
Premium Luxury & Lifestyle
System1 31 404 21 16 21 7 204 1 75 130
Pipeline1 38 96 29 23 33 8 79 5 35 114
Chain Upper Upper
Upscale Upscale Upscale Upscale Luxury Luxury Luxury Luxury
scale2 Upscale Upscale
• Strong momentum across Premium brands • Guest Satisfaction Index at 100 or above across all brands
• voco hotels: good momentum with ~70 hotels signed since • Six Senses Hotels Resorts Spas: iconic openings in Brazil, Ibiza and Israel
launch; open hotels delivering strong commercial performance
• Regent: development of the Regent Spa; Regent Hong Kong on track for
• Crowne Plaza Hotels & Resorts: review completed; three- opening in 2022
quarters of Americas estate updated, committed or undergoing • InterContinental Hotels: 23 signings in the year; significant capital outlay on
renovation renovation by owners to further elevate brand
• EVEN hotels: seven further signings in Greater China, taking • Vignette Collection: six hotels signed following launch in August
pipeline in the region to 19
• Kimpton Hotels & Restaurants: continued internationalisation of brand;
• HUALUXE: eleven openings and signings during 2021 including New resort properties expected to open in Bali and Mallorca during 2022
Hualuxe Suzhou Bay Hot Spring Resort
• Hotel Indigo: on track to double estate over next 3-5 years
1 Hotels as at 31 December 2021; 2 STR classification
45Care for our people, communities and planet
- 2030 Responsible Business ambitions and commitments
Champion a diverse Improve the lives of 30 Reduce our energy use and Pioneer the transformation Conserve water and help
culture where everyone million people in our carbon emissions in line with to a minimal waste secure water access in those
can thrive communities around the climate science hospitality industry areas at greatest risk
world
• Drive gender balance • Drive economic and social • Implement a 2030 science • Eliminate single use • Implement tools to reduce
and a doubling of under- change through skills based target that delivers: items, or move to the water footprint of our
represented groups training and innovation - 46% absolution reusable or recyclable hotels
across our leadership • Support our communities reduction in GHG alternatives across the • Mitigate water risk through
• Cultivate an inclusive when natural disasters emissions across scope guest stay stakeholder collaboration to
culture for our strike 1, 2, and scope 3 from • Minimise food going to deliver water stewardship at
colleagues, owners and • Collaborate to aid those a 2019 base year waste through a “prevent, basin level
suppliers facing food poverty • Target 100% new build donate, divert” plan • Collaborate to ensure
• Support all colleagues to hotels to operate at very • Collaborate to achieve adequate water, sanitation,
prioritise their wellbeing low / zero carbon circular solutions for major and hygiene (WASH)
and the wellbeing of emissions by 2030 hotel commodity items conditions for our operating
others • Maximise / optimise the communities
• Drive respect for and role of renewable energy
advance human rights
46Revenue and operating profit FY 2019-21
1
Total revenue Total operating profit
Actual US$ (m) Full Year Full Year
2021 2020 2019 2021 2020 2019
Franchise and base management fees 683 452 840 - - -
Incentive management fees 8 5 13 - - -
Fee Business 691 457 853 568 323 663
Owned, Leased & Managed Leases 83 55 187 (9) (27) 37
Total Americas 774 512 1,040 559 296 700
Franchise and base management fees 120 93 247 - - -
Incentive management fees 29 14 90 - - -
Fee Business 149 107 337 32 (18) 202
Owned, Leased & Managed Leases 154 114 386 (27) (32) 15
Total EMEAA 303 221 723 5 (50) 217
Franchise and base management fees 91 61 87 - - -
Incentive management fees 25 16 48 - - -
Fee Business 116 77 135 58 35 73
Total Greater China 116 77 135 58 35 73
Central Results 197 182 185 (88) (62) (125)
Total Reportable Segments 1,390 992 2,083 534 219 865
Reimbursement of Costs 589 637 1,171 - - -
System Fund 928 765 1,373 (11) (102) (49)
Total IHG 2,907 2,394 4,627 523 117 816
1 Before exceptional items
47Fee Business growth rate analysis vs 2020
RevPAR growth % Net rooms growth %
Underlying Fee
Comments
Revenue1 Growth %
FY 2021 Comparable Total2 YoY Available2
All hotels Aggregate
Hotels that have
that were open number of
traded in all
in FY 2021 and 31 December rooms available
months being
FY 2020 (incl 2021 vs 2020 for sale in
compared (i.e.
hotels that are FY 2021 vs
steady state)
ramping up) FY 2020
Americas 53.8% 55.3% (2.8)% 0.1% 51.2%
EMEAA 34.8% 35.4% 1.5% 1.6% 36.7%
Greater • Fee revenue growth benefited from higher levels of incentive
20.6% 18.4% 8.9% 8.8% 34.1%
China management fee income
Total Fee • Group Fee revenue growth impacted by lower rate of growth
45.9% 45.6% (0.6)% 1.9% 37.7%
Business in Central revenues
1 Underlying fee revenue and excludes owned, leased and managed lease hotels, significant liquidated damages, current year disposals, System Fund results and hotel cost reimbursements at constant FY 2021 exchange rates (CER).
2 Underlying fee business total RevPAR and available rooms excluding the SVC portfolio termination of 16.7k rooms (102 hotels) in Q4 2020
48Fee Business growth rate analysis vs 2019
RevPAR growth % Net rooms growth %
Underlying Fee
Comments
Revenue1 Growth %
FY 2021 Comparable Total2 YoY Available2
All hotels Aggregate
Hotels that have
that were open number of
traded in all
in FY 2021 and 31 December rooms available
months being
FY 2019 (incl 2021 vs 2019 for sale in
compared (i.e.
hotels that are FY 2021 vs
steady state)
ramping up) FY 2019
Americas (19.7)% (20.0)% (4.7)% 2.6% (18.6)%
EMEAA (51.6)% (52.9)% 0.8% 4.7% (54.3)%
Greater • Fee revenue growth impacted by lower levels of incentive
(28.7)% (32.8)% 15.9% 21.3% (19.1)%
China management fee income
Total Fee • Fee revenue growth impacted by lower levels of incentive
(29.6)% (31.8)% (0.2)% 5.9% (23.3)%
Business management fee income
1 Underlying fee revenue and excludes owned, leased and managed lease hotels, significant liquidated damages, current year disposals, System Fund results and hotel cost reimbursements at constant FY 2021 exchange rates (CER).
2 Underlying fee business Total RevPAR and available rooms excluding the SVC portfolio termination of 16.7k rooms (102 hotels) in Q4 2020
492021 notable items
Significant items FY 2021 FY 2022
Payroll tax credit Americas $11m $1m
Operating loss from three disposed Owned hotels1 Americas $(3)m $-
Individually significant Liquidated Damages Greater China $6m -
1 In 2019, the results of three disposed owned hotels were $2m of income
50Currency translation
Reportable Segments Reportable Segments
Reported FY 2021 vs FY 2020 at FY 2020 rates2 FY 2021 at average Jan 2022 rate vs reported FY 20213
Region1
Revenue EBIT Revenue EBIT
Americas - $2m - -
EMEAA $8m $(1)m $(4)m $1m
Greater China $5m $1m $2m $1m
Central Overheads $3m $(2)m - $2m
Total IHG $16m - $(2)m $5m
1Major non-USD currency exposure by region (Americas: Canadian Dollar, Mexican Peso; EMEAA: British Pound, Euro, Russian Rouble, Japanese Yen, Singapore Dollar; Greater China: Chinese Renminbi; Central: British Pound). 2 Based on
monthly average exchange rates each year. 3 Based on Jan 22 average rates: 0.74 USD:GBP; 0.88 USD:EUR.
51FY 2019 underlying fee business revenue and operating profit non-GAAP
reconciliations
Americas EMEAA Greater China Central Total IHG
Operating Operating Operating Operating Operating
Revenue Revenue Revenue Revenue Revenue
Profit Profit Profit Loss Profit
$m $m $m $m $m $m $m $m $m $m
Per FY 2019 financial statements
1,040 700 723 217 135 73 185 (125) 2,083 865
Reportable segments analysed as:
Fee business 853 663 337 202 135 73 185 (125) 1,510 813
Owned, leased and managed lease 187 37 386 15 - - - - 573 52
1,040 700 723 217 135 73 185 (125) 2,083 865
Reportable segments (see above) 1,040 700 723 217 135 73 185 (125) 2,083 865
Significant liquidated damages - - (11) (11) - - - - (11) (11)
Owned asset disposal1 (41) (6) (25) (1) - - - - (66) (7)
Currency impact2 (5) - 5 7 1 4 (1) (6) - 5
Underlying revenue and underlying operating profit
994 694 692 212 136 77 184 (131) 2006 852
Owned, leased and managed lease included in the
above (145) (31) (366) (14) - - - - (511) (45)
Underlying fee business 849 663 326 198 136 77 184 (131) 1,495 807
1 Americas: The revenue and operating profit/loss of InterContinental San Juan has been removed in 2019 (disposed in 2020) along with the operating profit/loss of three EVEN hotels (disposed in 2021) to determine underlying growth; EMEAA: The
results of InterContinental Nairobi (disposed 2021) and Holiday Inn Melbourne Airport (disposed 2020) have been removed to determine underlying growth. 2 Stated at constant FY 2021 exchange rates (CER).
52Ordinary shares
Number of shares At 31 December 2021 At 31 December 2020
Opening balance at 1 January 187.7 187.7
Closing balance at 31 December 187.7 187.7
Basic weighted average shares 183.0 182.5
Dilutive potential ordinary shares1 1.1 -
Basic diluted average shares 184.1 182.5
1. The effect of the notional exercise of outstanding ordinary share awards was anti-dilutive in 2020 and therefore was not included in the diluted earnings per share calculation.
Note: The total number of shares held as treasury shares at 31 December 2021 was 3.7m (2020 5.1m).
53CAUTIONARY NOTE REGARDING FORWARD-LOOKING STATEMENTS
This presentation may contain projections and forward looking-statements. The words “believe”, “expect”, “anticipate”,
“intend” and “plan” and similar expressions identify forward-looking statements. All statements other than statements of
historical facts included in this presentation, including, without limitation, those regarding the Company’s financial
position, potential business strategy, potential plans and potential objectives, are forward-looking statements. Such
forward-looking statements involve known and unknown risks, uncertainties and other factors which may cause the
Company’s actual results, performance or achievements to be materially different from any future results, performance
or achievements expressed or implied by such forward-looking statements. Such forward-looking statements are
based on numerous assumptions regarding the Company’s present and future business strategies and the
environment in which the Company will operate in the future. Further, certain forward-looking statements are based
upon assumptions of future events which may not prove to be accurate. The forward-looking statements in this
document speak only as at the date of this presentation and the Company assumes no obligation to update or provide
any additional information in relation to such forward-looking statements.
The merits or suitability of investing in any securities previously issued or issued in future by the Company for any
investor’s particular situation should be independently determined by such investor. Any such determination should
involve, inter alia, an assessment of the legal, tax, accounting, regulatory, financial, credit and other related aspects of
the transaction in question.
54You can also read