INVESTOR UPDATE FOURTH QUARTER 2021
←
→
Page content transcription
If your browser does not render page correctly, please read the page content below

INVESTOR UPDATE
                                                                     FOURTH QUARTER 2021

U N L E S S O T H E RW I S E I NDI C A T E D, ALL RPT F I NA NCIA L I NF O R MA T I O N IS P R E S E N T E D ON A C O NS O L I DA T E D B A SI S A ND I NCL UDI NG I T S P RO - RA T A S HARE
O F UNCO NS O L I DA T E D J O I NT V E NT URE S AND IS AS OF OR FOR THE Q UA RT E R E NDE D DE CE MB E R 3 1 , 2 0 2 1 . UNL E S S O T HE R W IS E I NDI CA T E D, A L L
DE MO G RA P HI C DA T A I S S O URCE D F RO M E S RI . RECO NCI LI AT IO NS OF NO N-G AA P MET RI CS CAN BE FO UND ON T HE CO MP ANY’S W EBSIT E AT
I NV ES TO RS .RPT RE A LT Y. CO M O R BY F O L L OW ING THI S LI NK : 4 Q 2 0 2 1 INVE ST OR PRES ENTAT IO N RECO NCI L IAT IO N O F NON- GA AP F INANCI A L MEA SURES.
FOR IMPORTANT INFORMATION REGARDING FORWARD-LOOKING STATEMENTS IN THIS PRESENTATION, SEE SLIDE 2.
The impact COVID-19 has, and will continue to have, on the Company and its

    F O R WA R D
                                                                                              tenants is highly uncertain, cannot be predicted and will vary based upon the
                                                                                              duration, magnitude and scope of the COVID-19 pandemic, including any related
                                                                                              variants, the short-term and long-term effect of COVID-19 on consumer

    LO O K I N G                                                                              behaviors, the effectiveness and availability of vaccines or cures for COVID-19
                                                                                              and the willingness of people to take available vaccines, as well as the actions

    S TAT E M E N T S                                                                         taken by federal, state and local governments to mitigate the impact of COVID-
                                                                                              19, including social distancing protocols and restrictions on business activities,
                                                                                              and the effect of any relaxation or revocation of current restrictions. Additional
                                                                                              factors which may cause actual results to differ materially from current
                                                                                              expectations include, but are not limited to: our success or failure in
                                                                                              implementing our business strategy; economic conditions generally and in the
                                                                                              commercial real estate and finance markets such as the inability to obtain equity,
    This presentation contains forward-looking statements within the meaning of               debt or other sources of funding or refinancing on favorable terms to the
    Section 27A of the Securities Act of 1933, as amended, and Section 21E of the             Company and the costs and availability of capital, which depends in part on our
    Securities Exchange Act of 1934, as amended. These forward-looking statements             asset quality and our relationships with lenders and other capital providers;
    represent our expectations, plans or beliefs concerning future events and may be          changes in the interest rate and/or other changes in the interest rate
    identified by terminology such as “may,” “will,” “should,” “believe,” “expect,”           environment; the discontinuance of London Interbank Offered Rate (“LIBOR”);
    “estimate,” “anticipate,” “continue,” “predict” or similar terms. Although the forward-   risks associated with bankruptcies or insolvencies or general downturn in the
    looking statements made in this document are based on our good faith beliefs,             businesses of tenants; the potential adverse impact from tenant defaults
    reasonable assumptions and our best judgment based upon current information,              generally or from the unpredictability of the business plans and financial
    certain factors could cause actual results to differ materially from those in the         condition of the Company's tenants; the execution of deferral or rent concession
    forward-looking statements. The ongoing impact of the novel coronavirus (“COVID-          agreements by tenants; our business prospects and outlook; acquisition,
    19”), or the impact of any future pandemic, epidemic or outbreak of any other highly      disposition, development and joint venture risks; our insurance costs and
    infectious disease, has, and could continue to cause adverse effects on the               coverages; increases in the cost of operations; risks related to cybersecurity and
    financial condition, results of operations, cash flows and performance of the             loss of confidential information and other business interruptions; changes in
    Company and our tenants (including their ability to timely make rent payments), the       governmental regulations, tax rates and similar matters; our continuing to qualify
    real estate market (including the local markets where our properties are located),        as a REIT; and other factors detailed from time to time in our filings with the
    the financial markets and general global economy as well as on our ability to enter       Securities and Exchange Commission ("SEC"), including in particular those set
    into new leases or renew leases with existing tenants on favorable terms or at all.       forth under “Risk Factors” in our latest annual report on Form 10-K. Given these
                                                                                              uncertainties, you should not place undue reliance on any forward-looking
                                                                                              statements. Except as required by law, we assume no obligation to update these
                                                                                              forward-looking statements, even if new information becomes available in the
                                                                                              future.
FOURTH QUARTER 2021 INVESTOR UPDATE                                                                                                                                                2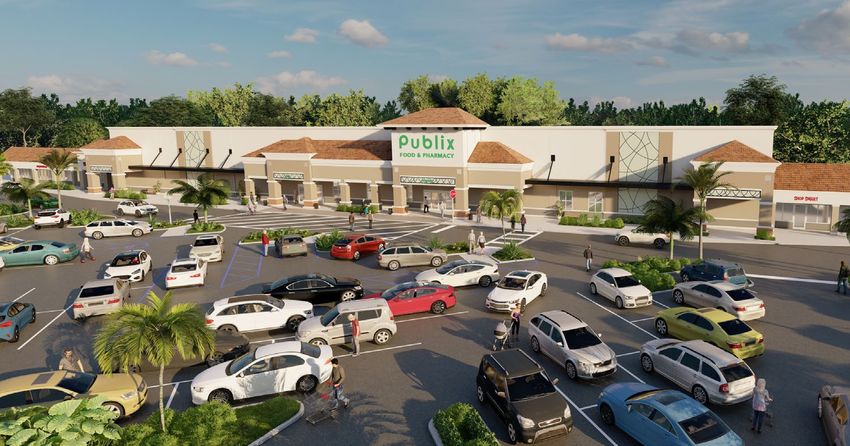
K E Y M E S S AG E S
RPT believes it offers investors a strong return potential of over 30%, given an
above average earnings growth and dividend, as well as multiple expansion
potential, resulting from the material improvements to RPT’s underlying
cashflows.1
Transforming Portfolio and Increasing Cash Flow Strength
RPT was the most active shopping center retail buyer in the U.S. in 2021, acquiring $732 million of gross assets on our balance
sheet, as well as through our grocery anchored and net lease joint venture platforms
Improved exposure in Boston, Atlanta, Tampa and Nashville and reduced exposure to Detroit, Chicago and Cincinnati
Signed four grocer leases throughout the year, materially compressing cap rates at several of our centers
Accelerating Leasing Activity Positioning RPT for Strong Future Growth
Initiated 2022 operating FFO per diluted share guidance of $1.00 to $1.05 per diluted share, representing an 8% increase at the
midpoint over last year, and including expected same property NOI growth of 3.0% to 5.0%2
Signed not open ABR and estimated recovery income of $6.9 million as of December 31, 2021, with an additional $3.3 million in
advanced lease negotiation, in total representing $0.11 of Operating FFO per share
Comparable new lease spreads of 72.8% and 32.5% during the fourth quarter 2021 and on a trailing twelve-month basis,
respectively, demonstrating the mark-to-market opportunity in the portfolio
Focused On External Growth Opportunities
Secured an additional $500 million of commitment from GIC to our core grocery-anchored R2G platform, providing additional upside
in management fee income
Closed on $791 million of investment activity in 2021, significantly improving the quality of the portfolio by increasing exposure by
annualized base rent ("ABR") to high-growth markets such as Boston, Tampa, Atlanta, and Nashville by 12% while reducing
exposure to non-core markets like Detroit, Chicago and Cincinnati by 8% versus 2020
We expect to remain active on the investment front, in both large and small opportunities where we can allocate assets to one or all
of our three strategic platforms
FOURTH QUARTER 2021 INVESTOR UPDATE 3
Why Invest
                                                       in RPT?

   01
    Compelling Total
                                      02
                                      Marked Improvement
                                                             03
                                                             Strong Internal Growth
    Return Potential                  In Portfolio Quality   Potential

   04
   Differentiated
                                      05
                                      Enhanced External
                                                             06
                                                             Flexible Balance Sheet
   Business Model                     Growth Opportunities   to Support Growth
                                                             Initiatives
FOURTH QUARTER 2021 INVESTOR UPDATE                                                   4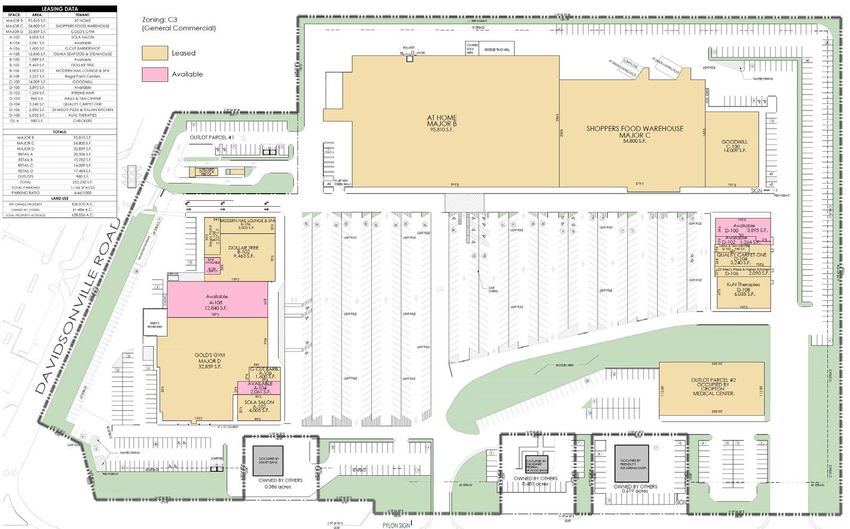
01
                                      RPT trades at a relative value discount
                                      despite having refreshed its business
                                      through both external investment
                                      activity and internal leasing success
                                      that has significantly improved the
                                      durability of our cash flows.
                                      • Strong relative total return potential

                                      • Attractive absolute total return potential

Compelling
Total Return
Potential
FOURTH QUARTER 2021 INVESTOR UPDATE                                                  5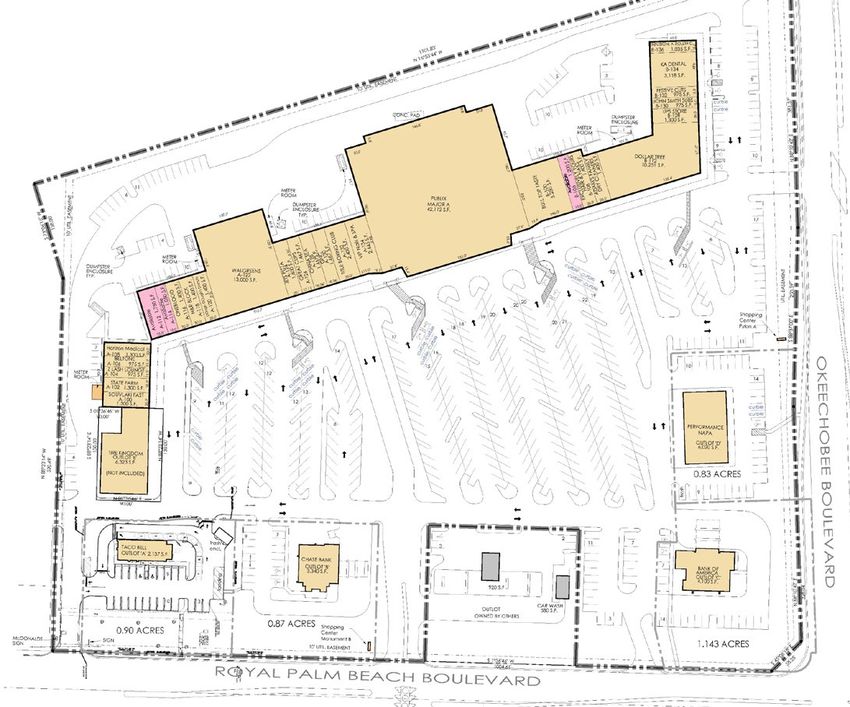
Strong Relative Total Return Potential
                    RPT screens well versus peers on dividend yield, expected growth and on a
                    relative value basis despite material improvements to portfolio quality, tenant
                    credit and geographic mix.

                           Higher Dividend Yield                  +                                 Higher Expected Growth                 +                                     Higher Multiple
                                                                                                                                                                               Expansion Potential

                                  Higher Dividend Yield                                                  Higher Growth Expectations                                             Higher Potential for Multiple Expansion
                   4.4%                                                                          9.0%           8.4%                                                    18.0
                                       4.2%                                                                                                                                                                    15.3
                                                                   2022 FFO per share growth 2

                                                                                                                                         Price to 2022 FFO multiple 3
                                                                                                 8.0%                                                                   16.0
                   4.2%
                                                                                                 7.0%                                                                   14.0                 12.0
Dividend Yield 1

                   4.0%                                                                          6.0%                                                                   12.0
                                                                                                 5.0%                                                                   10.0
                   3.8%
                                                                                                 4.0%                                                                    8.0
                                                         3.6%                                                                     2.7%
                   3.6%                                                                          3.0%                                                                    6.0
                                                                                                 2.0%                                                                    4.0
                   3.4%
                                                                                                 1.0%                                                                    2.0
                   3.2%                                                                          0.0%                                                                    0.0

                                      RPT     Peer Avg                                                          RPT    Peer Avg                                                              RPT    Peer Avg

                   Peer average includes: BRX, KIM, KRG, SITC, REG, PECO, FRT.

                   FOURTH QUARTER 2021 INVESTOR UPDATE                                                                                                                                                                    6
Attractive Absolute Total Return Potential
 Prior to COVID-19 and BEFORE the portfolio quality, tenant credit and geographic mix
 improvements achieved since the pandemic started, RPT’s multiple was almost in-line with
 peers providing the potential for significant multiple expansion from current levels that RPT
 believes could result in over a 30% total shareholder return.

                 Potential Drivers of Multiple Expansion
                 • Higher expected 2022 SP NOI growth versus peers
                 • Higher expected 2022 FFO growth versus peers
                 • Increasing grocery anchored exposure
                 • Improving tenant credit
                 • Better market mix

                                        1                        2    3

Peer average includes: BRX, KIM, KRG, SITC, REG, PECO and FRT.

FOURTH QUARTER 2021 INVESTOR UPDATE                                                              7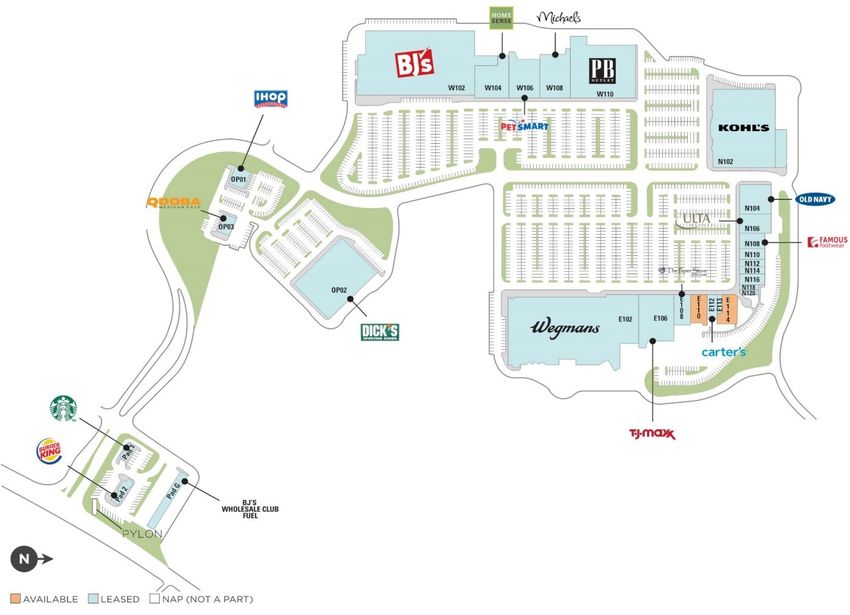
C O M PA N Y S N A P S H O T
Our Size is Our Advantage
   RPT’s smaller portfolio size should allow us to adapt to a rapidly evolving retail landscape
   more quickly than larger peers.

                                Peer Average: 210 Assets1   90

                     210
                                         CARGO SHIP

                                                                                 572

FOURTH QUARTER 2021 INVESTOR UPDATE                                                               9
RPT At-a-Glance
    RPT is an open-air shopping center REIT with enough size to matter to retailers but small enough to quickly respond
    to changing market dynamics.

             Financial                  Operating                 Balance Sheet                          Corporate
             Snapshot                   Snapshot                   Snapshot1                             Snapshot

              12.4%                     93.1%                             6.8x                           $2.2B
               SAME PROPERTY              LEASED RATE
                                                                   NET DEBT TO ANNUALIZED           TOTAL MARKET CAPITALIZATION
                 NOI GROWTH
                                                                      ADJUSTED EBITDA

                3.4%                    90.7%                           $14M                                56%
             SAME PROPERTY BASE           OCCUPANCY                       TOTAL   CASH 2               % FEMALE EMPLOYEES
                RENT GROWTH

              90.6%                     32.5%                            0.0%                               50%
                                                                        DEBT MATURING
         SAME PROPERTY OPERATING      NEW-COMPARABLE RENT                                             % FEMALE INDEPENDENT
                                                                              IN 2022
          EXPENSE RECOVERY RATIO          SPREAD (TTM)                                                      TRUSTEES
                                                                   (excl. principal amortization)

              $0.25                       9.0%                           9.6%                                 24
                                         BLENDED RENT
            OPERATING FFO/SHARE                                         DEBT MATURING                    AVERAGE YEARS OF
                                         SPREADS (TTM)
                                                                          THROUGH 2023                 EXPERIENCE OF NAMED
                                                                   (excl. principal amortization)       EXECUTIVE OFFICERS

FOURTH QUARTER 2021 INVESTOR UPDATE                                                                                               10
Geographically 100% 100% 86%
Diversified with a OPEN-AIR CENTERS
(Based on annualized base rent “ABR”)
SUBURBAN MIX
(Based on ABR)
NATIONAL & REGIONAL TENANTS
(Based on ABR)
National Tenant
Focus and Suburban 70% 57
Orientation GROCERY/GROCER
COMPONENT ANCHORED
(Based on ABR)
# OF TOTAL MULTI-TENANT
RETAIL PROPERTIES
Boston
Milwaukee
Minneapolis
Detroit
Tri-State Area
Chicago
Columbus
Salt Lake Indianapolis
City Baltimore
Denver
St. Louis
Cincinnati
Charlotte
Nashville
Phoenix
Atlanta
Austin Jacksonville
Accelerated flight to the suburbs Orlando
fueled by COVID-19 positions
RPT’s portfolio for growth.
Tampa
Miami
Expand in existing markets
Expand in new markets
Not looking to expand
FOURTH QUARTER 2021 INVESTOR UPDATE 11Initial 2022 Outlook
At the midpoint of $1.03 per diluted share, 2022 operating FFO is projected to
increase by 8% at the midpoint and 11% at the high-end.
2022
Guidance1
$1.00 $1.05
Operating FFO per
diluted share
Selected Expectations
Same Property NOI Growth2 Acquisitions Dispositions
3.0% 5.0% +/- $125M +/- $100M
FOURTH QUARTER 2021 INVESTOR UPDATE 12ESG Progress and Recent Awards
Published our first Corporate Sustainability Report in December 2021
Improved GRESB score by 20% in 2021 versus our inaugural assessment in 2020
2021 Diversity & Inclusion Initiatives include: developing effective strategies to recruit and
attract a more diverse talent pool, providing unconscious bias training for all employees,
supporting community outreach efforts at targeted RPT centers, working with vendors and
subcontractors to further our diversity goals and partnering with third parties to help level the
playing field for underrepresented groups within the commercial real estate industry
Since 2018 RPT has significantly improved the Board of Trustees’ diversity of tenure, skills,
experience, gender and ethnicity through the addition of three new trustees
2022 Focus: Vendor Monitoring, Technical Building Assessments, Green Lease Execution,
and Building Certifications
8TH
YEAR IN
A ROW!
Obtained RPT’s first-time
investment grade credit rating Best Investment Transaction
Portfolio category for our joint venture with GIC
FOURTH QUARTER 2021 INVESTOR UPDATE 1302
The durability of our cashflows
has been greatly enhanced
over the past few years with a
strengthened and healthier
tenant base, increased grocer
exposure, and significant
improvements in both our
geographic mix and household
income.
• Rapid expansion in target markets
• Rising grocer exposure
Marked • Upgrading tenancy
Improvement In
Portfolio Quality
FOURTH QUARTER 2021 INVESTOR UPDATE 14Rapid Expansion into Target Markets
Boston moved from no exposure to our third largest market in 2021.
• Power of the Platform facilitates rapid growth in target Increasing Market Exposure
and expansion markets, while shrinking non-expansion
markets
• Target markets are university-adjacent, high-growth
markets with an outsized tech presence
• First time entrant into the Boston market, which is now
RPT’s #3 largest market; Atlanta jumped to #4 from #12
• Decreased our market exposure in Detroit, Cincinnati,
Boston Atlanta
and Chicago by 8.8%
0.0% to 7.4% 3.7% to 6.9%
Rank at MSA Exposure as MSA Exposure as
MSA Change
4Q21 of 12/31/2019 of 12/31/2021
1 Detroit 19.8% 16.1% (3.7%)
Tampa Nashville
5.7% to 6.8% 5.0% to 5.2%
2 Cincinnati 11.3% 10.0% (1.3%)
3 Boston 0.0% 7.4% 7.4% Decreasing Market Exposure
4 Atlanta 3.7% 6.9% 3.2% Chicago (3.8%)
5 Tampa 5.7% 6.8% 1.1% Detroit (3.7%)
Cincinnati (1.3%)
FOURTH QUARTER 2021 INVESTOR UPDATE 15Rising Grocer Exposure
Since 2019, RPT has made material improvements to its portfolio through proactive asset recycling and
through the Power of the Platforms created in 2019 and 2021 that enabled RPT to transform its portfolio
through the acquisition of $541 million of multi-tenant shopping centers in 2021.
Centers Anchored by Grocer or Grocer Component by ABR
72.0%
+5.7% 71.0%
71.0%
70.0% 69.5%
69.0%
68.0%
% of ABR
67.0%
66.0%
65.3%
65.0%
64.0%
63.0%
62.0%
4Q19 4Q21 4Q21 with SNO
FOURTH QUARTER 2021 INVESTOR UPDATE 16Upgrading Tenancy
We are replacing lower quality tenants with national grocers and retailers, upgrading the
credit profile and compressing the cap rates on our centers, while also enhancing the
customer experience.
Former Tenant New Tenant
Troy Marketplace AA/A1 Rated Grocer
Crofton Centre
Town & Country Crossing
Winchester Center
Highland Lakes AA/A1 Rated Grocer
Front Range Village
Woodbury Lakes
Providence Marketplace
Total NOI: $2.4M Total NOI: $4.5M
FOURTH QUARTER 2021 INVESTOR UPDATE 1703 RPT has significant organic
upside that is being fueled by
below market in-place rents and
occupancy upside. We are using
the opportunities that COVID-19
has presented to enhance the
value of our properties through
the strategic remerchandising
and re-tenanting of our portfolio.
• Accelerating signed not open backlog
• Embedded mark-to-market opportunity
• Enhancing value through leasing
Troy Marketplace
Town & Country Crossing
The Crossroads
Crofton Centre
Strong Internal • COVID-19 has highlighted the importance of
Growth Potential
bricks and mortar
• Our retailers are expanding
FOURTH QUARTER 2021 INVESTOR UPDATE 18Accelerating Leasing Backlog
Signed not opened ABR and estimated recovery income (gross rent) was $6.9 million as of
December 31, 2021, with another $3.3 million in advanced lease negotiation, totaling $0.11 of
annual incremental operating FFO per share by 2024.
Signed Not Commenced Backlog
Total
$5.0 $4.7
$4.5
Pro-rata share of gross rent (in millions)
$4.0 Total $1.7
$3.5
$3.5
$0.4
$3.0
$2.5 $0.05 Total
per share $2.0
$2.0
$0.04
$1.5 $3.1 per share
$3.0 $1.1
$0.02
$1.0
per share
$0.5 $0.9
$0.0
2022 2023 2024
Signed, not commenced - at 12/31/2021 In advanced negotiation
Tenants signed
over the past year AA/A1 Rated
Grocer
FOURTH QUARTER 2021 INVESTOR UPDATE 19Embedded • Fourth quarter 2021 TTM new leases-comparable re-
leasing spread of 32.5%
Mark-to-Market • Since the second quarter of 2018, new leases-
comparable re-leasing spreads have averaged 30%
Opportunity • New leases-comparable rent per square foot has
averaged about $18 since mid-2018 which is significantly
above the current portfolio average rent per square foot
RPT’s low in-place rents and of $15
decentralized leasing platform is • New leases signed since 2Q18 have an average
driving strong re-leasing spreads. embedded rent escalator of 1.8% and 1.7% on a trailing-
twelve-month basis
$20 $17
$16.31
30% average $18.07 $16 33% TTM new
New Comparable ABR per SF - TTM
$18 new re-leasing re-leasing
New Leases-Comparable ABR PSF1
spread $15 spread
$16
$14
$13.93 $13
$14
$12.31
$12
$12
$11
$10 $10
2Q18 - 4Q21 Average 4Q21 TTM
Prior Rent PSF New Rent PSF Prior Rent PSF New Rent PSF
FOURTH QUARTER 2021 INVESTOR UPDATE 20Key points:
Enhancing Value 1. Remerchandising projects consist of re-demising, expanding or
combining spaces similar to the 18 targeted remerchandising
Through Leasing opportunities that we completed in 2019 at high teens yields
2. COVID-19 has fueled renewed demand from grocers and RPT is
currently in various stages of negotiation on several new grocer deals
Active remerchandising and outlot
3. Grocery-anchored centers typically trade at cap rate premiums to
opportunities of $26 million are non-grocery-anchored centers and to power centers driving potential
expected to earn an attractive return NAV accretion
on capital in the low double-digit 4. COVID-19 has created opportunities to accretively remerchandise
range. our properties that did not exist pre-pandemic
Reducing Potential New Tenants
AA/A1
Rated Grocer
FOURTH QUARTER 2021 INVESTOR UPDATE 21Remerchandising
Troy Marketplace
Troy, MI
At our Troy Marketplace asset in the Detroit,
MI market (#14 MSA), COVID-19 impacts
allowed us to take back a recreation tenant
without a buyout, facilitating the signing of a
premier, first-to-state grocer with investment
grade credit at this non-grocery-anchored
credit center which should significantly
enhance the value of the entire property
while positioning the property for success for
years to come.
Value Creation
Favorable Cap Rate
Compression
230 bps
Est. Cap Rate Compression1
Unrated AA/A1
Credit Credit
Rating Rating
Strong Growth 4.6%
Profile 5-YR NOI CAGR
2022 -2027
Signed Grocer
FOURTH QUARTER 2021 INVESTOR UPDATE 22Remerchandising
Town & Country Crossing
We plan to re-demise, expand and Town & Country, MO
combine spaces to attract new types of
tenants at our Town & Country Crossing Old Tenant
center, in the St. Louis, MO market (#20
MSA). We have already signed a lease
with coveted national outdoor and sporting
retailer, REI, whose addition to the center
is expected to enhance the overall tenancy.
Value Creation
EXISTING SITE PLAN – TOWN & COUNTRY
Favorable Cap Rate
Compression
190 bps
Est. Cap Rate
Compression1
Strong Growth 4.5% Signed national outdoor
and sporting retailer
Profile 5-YR NOI CAGR
2022 -2027
PROPOSED SITE PLAN – TOWN & COUNTRY
FOURTH QUARTER 2021 INVESTOR UPDATE 23Remerchandising
The Crossroads
Royal Palm Beach, FL
The Crossroads, located in the Miami, FL
market (#7 MSA) is home to a high
performing Publix that has decided to invest
significant capital to upgrade and expand the
store. As a condition of completing this
project, we have signed Publix to a fresh 20-
year lease at a healthy spread. The new and
improved store is expected to attract even
more customers and should compress the
cap rate on the entire center.
PROPOSED SITE PLAN – PUBLIX
REBUILD & EXPANSION
Property & 3-Mile Market Statistics
Favorable Cap Rate 80 bps
Compression Est. Cap Rate
Compression1
Strong Growth 15.8%
Profile 5-YR NOI CAGR
2022 - 2027
FOURTH QUARTER 2021 INVESTOR UPDATE 24Upgrading Tenancy
Crofton Centre
We are replacing a non-credit rated Crofton, MD
and low sales grocer with investment
grade grocer Giant at Crofton Centre
in the Baltimore, MD market (#21
MSA). This deal brings a high-end
grocer into the center, with projected
weekly sales volume of $780K.
Value Creation
Favorable Cap Rate 200 bps
Compression Est. Cap Rate
Compression1
B+ BBB
Strong Growth 7.3% Credit
Rating
Credit
Rating
Profile 5-YR NOI CAGR
2022 - 2027
FOURTH QUARTER 2021 INVESTOR UPDATE 25COVID-19 has Highlighted the Importance of Bricks and Mortar1
BOPIS and curbside pickup now available at all
The year-over-year growth rate of online
stores and next day local delivery from store
grocery sales continued to accelerate in Q3,
now available at 70% of locations.5”
and pickup is now available from all
Whole Foods market stores.2” –#23 tenant
–#15 tenant
In addition, we leveraged our stores to drive fast
and convenient fulfillment of online orders. In Q2,
80% of GAP and Banana Republic revenue is we continued to see about 60% of our online
expected to be driven by off-mall locations revenue fulfilled by stores, including in-store or
by 2023.3” curbside pickup, ship from store, or Best Buy
employees who are delivering product to customers
–#9 tenant out of more than 450 of our stores6”
–#17 tenant
Our stores continue to be an operational strength
to Bed Bath & Beyond during the quarter. In Q1, During Q2, our stores enabled over 90% of our total
31% of our digital demand was fulfilled from sales, and we fulfilled more than 70% of our online sales,
stores, with BOPIS representing 14% and ship either through ship-from-store, in-store pickup or curbside.
Most importantly, we continue to drive significant
from store and the same-day delivery accounting
improvement in the profitability of our eCommerce
for 17%. Our footprint plays a vital role in our
channel, by leveraging fixed costs, sustaining athlete
digital-first, omni-always strategy.4” adoption of in-store pickup and curbside, as well as fewer
–#4 tenant and targeted promotions.7”
–#2 tenant
FOURTH QUARTER 2021 INVESTOR UPDATE 26Our Retailers Are Expanding1
600 new store openings and 1,250 store
Aldi has 450 planned openings. It has renovations planned in fiscal 20215”
2,052 stores and wants to get to 2,500 by
2022.2” –#16 tenant
–#48 tenant
Starbucks plans 850 new openings in 2021
Burlington has long-term plans to open and announced that it plans to add 22,000
1,000 stores, though it plans to reduce the stores to its portfolio by 2030, for a total of
average store’s footprint. It opened 38 55,000. This will include a mix of new store formats,
locations in fall 2020 and plans a total of 51 to including Drive-Thru, Starbucks Pickup and
54 stores in 2021.3” curbside pickup.6”
–#13 tenant
–#91 tenant
Old Navy and Athleta opened 25 and 13
stores, respectively, year-to-date, on a Looking ahead, we remain confident in our
path toward 30 to 40 openings at Old expansion plans and continue to see plenty of
Navy and 20 to 30 openings at opportunity to grow to at least 2,400 Ross Dress
Athleta.4” for Less and 600 dd's DISCOUNTS locations
over time.7”
–#9 tenant
–#8 tenant
FOURTH QUARTER 2021 INVESTOR UPDATE 2704
We are using our size to our
advantage by innovating and
responding quickly to a rapidly
shifting retail landscape. We have a
differentiated business model that
utilizes unique and strategic joint
ventures to capitalize on
dislocations across the retail real
estate landscape.
• Three differentiated, but complementary
external growth platforms
• Power of the platforms
Differentiated
Business Model
FOURTH QUARTER 2021 INVESTOR UPDATE 28Three Differentiated, but Complementary
External Growth Platforms
Three different investment strategies with tailored capital structures to drive scale and outsized growth.
R2G RGMZ
(Balance Sheet) (Existing GIC Joint Venture) (New Net Lease Platform)
RPT Ownership 100.0% 51.5% 6.4%1
Gross Assets $2.3 billion2 $577 million3 $228 million4
Property Type Grocery-anchored shopping
Multi-tenanted shopping centers Single-tenant assets
centers
Lease Type Average lease lengths with value- Average lease lengths with core-
Long-term net leases
creation opportunities stabilized characteristics
Tenancy Diversified, high-quality tenants
Resilient, investment grade quality
with balanced mix of anchor and Grocery-anchored in top MSAs
tenants
shop tenants
Leverage Profile
Targeting 5.5x-6.5x net debt-to- Targeting leverage of up to 50% Ability to operate at higher target
EBITDA on select assets leverage levels of 60-65%
Remaining capital
to be deployed N/A $1.1 billion $957.5 million
Incremental mgmt.
fee upside5 N/A $0.02 $0.03
FOURTH QUARTER 2021 INVESTOR UPDATE 29Power of the Platforms
Higher achievable economic spreads that will drive greater value creation per dollar deployed through
higher investment yields from arbitrage opportunities and earned management fees.
Strategic Benefits
1. Accelerates AUM Growth and Expansion Into Target Markets: Capital infusions from R2G and RGMZ
accelerate RPT’s expansion into target markets and increases assets under management that can create G&A
efficiencies over the long term
2. Unlocks Large Scale Portfolios: Ability to acquire larger portfolios of properties with different risk/return profiles
and allocate properties across multiple platforms
3. Unlocks Value Dislocations: Monetize value dislocations across retail real estate such as single versus multi-
tenant, essential versus non-essential and larger versus smaller deal sizes
4. Enhances FFO Growth Profile: Higher effective yields fueled by arbitrage opportunities and earned
management fees increases the economic returns and accretion from deployed capital
~50 bps
Management
Fees Enhanced
Effective Yield
= 250 bps
Up to
200 bps
Arbitrage1
FOURTH QUARTER 2021 INVESTOR UPDATE 3005
Our two joint ventures have
provided us with the capital to fuel
a material increase in our assets
under management, accelerate our
expansion into higher growth
markets and allow us to generate
higher economic returns on our
capital to enhance external growth.
• Punching above our weight class
• Striking with precision
• Optimizing capital allocation
• Asset Scoring Model
Enhanced • Power of the Platforms
External Growth • Recent acquisitions
Opportunities
FOURTH QUARTER 2021 INVESTOR UPDATE 31Punching Above Our Weight Class
In 2021, RPT was the most active retail investor in the U.S. by purchase volume,
surpassing large cap REITs, institutional owners, and private equity.
Top REIT, Investment Manager and Private Equity Retail Buyers in 2021
$600
$546 $545
$500 $465
Deal Volume ($ in millions)
$390
$400 $371 $363 $361
$340 $328
$298 $295
$300 $273
$229
$207 $200 $193 $192
$200
$100
$0
Source: JLL
FOURTH QUARTER 2021 INVESTOR UPDATE 32Striking With Precision
Grocery-anchored cap rates have fallen by 50-60bps in the past year and by
roughly 70bps for our $500 million of acquisitions1, driving value creation of
almost $60 million.
Major Market Grocery-Anchored Cap Rates 2021 Acquisitions
6.7%
~70bps
6.6%
6.5%
6.4% Estimated Cap Rate
Cap Rate
6.3% Compression Since
6.2% Acquisition
6.1%
6.0%
5.9%
5.8%
~$57M
Estimated
Value Creation
Source: Real Capital Analytics
FOURTH QUARTER 2021 INVESTOR UPDATE 33Optimizing
Capital
Allocation
Asset Score
RPT is modernizing its
approach towards capital
allocation by combining
advanced data analytics Optimized
with the deep and Tenant Score Capital Market Score
experienced leadership Allocation
across business units
Deep &
Experienced
Leadership
FOURTH QUARTER 2021 INVESTOR UPDATE 34Asset Scoring Model
RPT’s asset score incorporates advanced data analytics with our deep
institutional knowledge base to evaluate four key factors: Competitive Positioning,
Market Dynamics, Cash Flow Risk and Cash Flow Growth
Traditional Data Sources New Data Sources Institutional Knowledge
24 average years of
experience for senior
management
Demographics Market Rents Real-time Foot Retail
Traffic Spending
$13 billion of total
transactions volume
experience
Deep broker and market
Forecasted Growth Tenant Employers Climate Risk relationships
Quality
FOURTH QUARTER 2021 INVESTOR UPDATE 35RPT closed on its first arbitrage acquisition with the
Power of The
purchase of Northborough Crossing in the Boston, MA
market.
• Northborough Crossing is a 646K square foot premier open-air retail
Platforms
destination ideally situated between Boston’s MetroWest suburbs and the
thriving Worcester market amidst a highly-affluent area with an average
household income of $158K within a three-mile radius
• By parceling off select tenants and selling those net lease assets to
Northborough Crossing, Northborough, MA RGMZ, RPT is then able to retain the rest of the center at a lower cost,
increased retained cap rate, and with an enhanced growth profile while
earning management fees on the net lease assets
Signed TJX
$104M 94% Concepts
Contract Price Leased Rate
$158K 7%
Average HH Income 5-Year NOI CAGR
(3-mile) 2022 - 2027
FOURTH QUARTER 2021 INVESTOR UPDATE 36Power of The Platforms
Northborough Crossing, Northborough, MA
Parceling off select net lease assets at the center and selling them to RGMZ has
significant benefits for both RPT and the joint venture.
Benefits to RPT Benefits to RGMZ
Reduced cost basis Resilient and high-quality tenancy
Sold $65 million of parcels to RGMZ which would Access to essential and high credit quality tenants in an
significantly reduce RPT’s basis in the retained asset attractive market
Enhanced yields on retained asset Superior demographics
240-basis point spread between the going-in cap rate and $158K average 3-mile household income and 73% of
the retained cap rate after parcel sales population with an Associates Degree or higher within 3
Capitalize on property size discount miles
Enables RPT to purchase a large property that typically Enhanced returns from leverage
includes a size discount, due to reduced trading liquidity, Stable cash flow with strong tenancy allows for target
that we likely would have passed on without the potential leverage of 60-65%
parcel sales to RGMZ Proprietary deal flow
Access to Boston market Single-tenant carve-outs from a multi-tenant center not
Facilitates entry into the attractive Boston market available to traditional net lease players
Maintains management of the center Attractive pricing
RPT retains day-to-day responsibility for leasing and Value dislocations available by working with RPT allows
property management of the center as manager of the net both parties to attain better yields than buying individually
lease platform Location within premier shopping center
Benefits from traffic of multi-tenant open-air centers
FOURTH QUARTER 2021 INVESTOR UPDATE 37RECENT ACQUISITIONS
Boston Portfolio
   Our newly acquired Boston portfolio has an expected 4% 5-Year NOI CAGR.

                                                                 153,725 SF
                                                                97.4% Leased
                                      2

                                                  Bedford Marketplace
                                                  Bedford, MA
                                                                                                     510,154 SF
                                                                                                    95.7% Leased

                    1
                                          3
                                                                                       Dedham
                                                                                       Dedham, MA

                                              4

                    645,785 SF                                                       283,979 SF
                   94.1% Leased                                                     86.6% Leased

       Northborough Crossing                                           Village Shoppes of Canton
       Northborough, MA                                                Canton, MA

FOURTH QUARTER 2021 INVESTOR UPDATE                                                                                39
Southeast Portfolio
Our newly acquired Southeast portfolio has an expected 5% 5-Year NOI CAGR.
1 218,859 SF
SF 77,099 98.4% Leased
97.9% Leased
2 Woodstock Square
Atlanta, GA
Bellevue Place
Nashville, TN
3
104,431 SF
100.0% Leased
460,962 SF
91.4% Leased
East Lake Woodlands
Tampa, FL
Newnan Pavilion
Atlanta, GA
81,544 SF 163,476 SF
95.4% Leased 97.2% Leased
4
5
6
Highland Lakes Plaza South Pasadena Shopping Center
Tampa, FL Tampa, FL
FOURTH QUARTER 2021 INVESTOR UPDATE 4006
A flexible and proactive balance
sheet strategy allowed RPT to
weather the pandemic while
positioning the Company for
future growth opportunities.
• Strong liquidity and investment grade balance
sheet
• Flexible and opportunistic liability management
Flexible Balance
Sheet to Support
Growth Initiatives
FOURTH QUARTER 2021 INVESTOR UPDATE 41Strong Liquidity and Investment
Grade Balance Sheet1
We have about $240 million of net liquidity after debt repayments through 2023.
Total Total
$329 $329
$14M
Total Cash2
$315M
Unused Revolver
Capacity
$ in millions
Revolver Net
Capacity Liquidity
6.3x
$315 $240
Net Debt to Annualized
Adjusted EBITDA3
BBB- Debt
Repayments
2
'22-'23
4
Investment Grade
Cash $89
Credit Rating from Fitch
$14
Sources Uses
FOURTH QUARTER 2021 INVESTOR UPDATE 42Flexible and Opportunistic
Liability Management1
As of December 31, 2021
4.8% $250
All of 2023 maturities are expected to be refinanced in 2022
Debt Maturities excl. principal amortization (millions)
Floating Rate Debt
$200 $190
Only 9.6% of
debt maturing
34.0% $150 through 2023 $129 $130 15%
Debt Prepayable $100 $88 $852
Without Penalty $75 $70 $75 $70
$50
0.0% $0
$0
2022 2023 2024 2025 2026 2027 2028 2029 2030 2031
$0
2032
Debt Maturing in 2022
(excl. principal amortization)
Secured Unsecured Bank Unsecured PP Revolver Target
FOURTH QUARTER 2021 INVESTOR UPDATE 43FOOTNOTES
Footnotes

SLIDE 3
1) See footnotes for slide 6.
2) Represents guidance provided in our earnings release or earnings call, which was subject to the assumptions therein. We have not updated or reaffirmed that
   guidance or any of the of the supporting assumptions and are not doing so by restating it herein. Expected same property NOI growth excludes the net impact of
   reversals of prior period rental income not probable of collection that benefited 2021 same property NOI, including the Company’s share of unconsolidated joint
   ventures.
SLIDE 6
1) Dividend yield is based on the most recently announced quarterly dividend annualized divided by the stock price as of February 14, 2022.
2) 2022 FFO per share growth reflects the midpoint of 2022 FFO per share consensus estimates sourced from S&P Cap IQ Pro on February 14, 2022, divided by 2021
   FFO per share sourced from S&P Cap IQ Pro on February 14, 2022.
3) Price to 2022 FFO multiple reflects the stock price on February 14, 2022, divided by 2022 FFO per share consensus estimates sourced from S&P Cap IQ Pro on
   February 14, 2022.
SLIDE 7
1) Dividend yield is based on RPT’s announced first quarter 2022 quarterly dividend rate of $0.13 annualized, divided by the stock price as of February 14, 2022.
2) 2022 FFO per share growth reflects consensus 2022 FFO per share estimates sourced from S&P Cap IQ Pro on February 14, 2022, divided by 2021 FFO per share
   sourced from S&P Cap IQ Pro on February 14, 2022.
3) Multiple expansion reflects the peer average price to FFO multiple of 15.3x multiplied by the midpoint of RPT’s 2022 OFFO per share guidance divided by the stock
   price on February 14, 2022, less RPT’s OFFO growth. Peer average includes: BRX, KIM, KRG, SITC, REG, PECO, FRT.
SLIDE 9
1) Simple average of total assets including joint venture assets owned by BRX, RPAI, KRG, SITC, WRI, ROIC, FRT, KIM and REG as of December 31, 2020.
2) As of December 31, 2021, the Company’s multi-tenant property portfolio consisted of 57 multi-tenant shopping centers (including ten shopping centers owned
   through a joint venture).
SLIDE 10
1) Balance sheet snapshot information reflects the consolidated portfolio and the Company’s pro-rata share of joint ventures, except for total cash.
2) Consolidated portfolio cash, cash equivalents, and restricted cash balance of $14 million as of December 31, 2021.

SLIDE 11
1) As of December 31, 2021, the Company’s multi-tenant property portfolio consisted of 57 multi-tenant shopping centers (including ten shopping centers owned
   through a joint venture).

FOURTH QUARTER 2021 INVESTOR UPDATE                                                                                                                                 45
Footnotes

SLIDE 12
1) Represents guidance previously provided in our earnings release or earnings call, which was subject to the assumptions therein. We have not updated or
   reaffirmed that guidance or any of the of the supporting assumptions and are not doing so by restating it herein. The Company does not provide a reconciliation for
   non-GAAP estimates on a forward-looking basis where it is unable to provide a meaningful or accurate calculation or estimation of reconciling items and the
   information is not available without unreasonable effort. This is due to the inherent difficulty of forecasting the timing and/or amount of various items that would
   impact net income attributable to common stockholders per diluted share, which is the most directly comparable forward-looking GAAP financial measure. This
   includes, for example, acquisition costs and other non-core items that have not yet occurred, are out of the Company's control and/or cannot be reasonably
   predicted. For the same reasons, the Company is unable to address the probable significance of the unavailable information. Forward-looking non- GAAP financial
   measures provided without the most directly comparable GAAP financial measures may vary materially from the corresponding GAAP financial measures. The
   Company’s 2022 guidance reflects management’s view of current and future market conditions, including current expectations with respect to rental rates,
   occupancy levels, acquisitions and dispositions and debt and equity financing activities. To the extent actual results differ from our current expectations, the
   Company’s results may differ materially from the guidance set forth above.
2) Expected same property NOI growth excludes the net impact of reversals of prior period rental income not probable of collection, including the Company’s share of
   unconsolidated joint ventures.
SLIDE 20
1) Weighted average new leases-comparable base rent PSF and prior rent PSF from 2Q18 to 4Q21.

SLIDE 22-25
1) Reflects difference between JLL cap rate assessment relative to cap rate calculated based on gross property book asset value and 2021 NOI.
SLIDE 26
1) All information contained in this slide is based upon public information, RPT has not verified such information independently and makes no representation as to the
   accuracy of such information.
2) Source: Amazon 3Q20 earnings call.
3) Source: GAP 2020 Virtual Investor Meeting.
4) Source: Bed Bath & Beyond 1Q21 earnings call.
5) Source: At Home 4Q20 earnings call.
6) Source: Best Buy Q2 Fiscal Year 2022 earnings call.
7) Source: Dick’s Sporting Goods 2Q21 earnings call.

FOURTH QUARTER 2021 INVESTOR UPDATE                                                                                                                                  46
Footnotes
SLIDE 27
1) All information contained in this slide is based upon public information, RPT has not verified such information independently and makes no representation as to the
   accuracy of such information.
2) Source: CNBC.
3) Source: Globe St.
4) Source: GAP 2Q21 earnings call.
5) Source: Source: Dollar Tree 4Q20 press release.
6) Source: CNN.
7) Source: Ross Stores press release on October 11, 2021.

SLIDE 29
1) Reflects RPT’s equity ownership only and does not contemplate RPT’s preferred investment.
2) Reflects total assets of $1.9 billion plus accumulated depreciation of $0.4 billion as reported on the Company’s Condensed Consolidated Balance Sheet as of
   December 31, 2021.
3) Reflects total assets of R2G of $561 million plus accumulated depreciation of $16 million as of December 31, 2021.
4) Reflects total assets of RGMZ of $227 million plus accumulated depreciation of $1.0 million as of December 31, 2021.
5) Expected incremental management fee upside per share if full amount of remaining capital is deployed.

SLIDE 30
1) Arbitrage reflects the difference between the going in acquisition cap rate versus the retained cap rate after selling net lease parcels to the net lease platform.

SLIDE 33
1) Acquisitions include Northborough Crossing, Village Shoppes of Canton, Bedford Marketplace, Dedham, South Pasadena Shopping Center, Bellevue Place, Eastlake
   Woodlands, Woodstock Square, and Newnan Pavilion.
SLIDE 42
1) Information on this slide reflects the consolidated portfolio only except for Net Debt to Annualized Adjusted EBITDA.
2) Cash, cash equivalents, and restricted cash balance of $14 million as of December 31, 2021.
3) Adjusted for ABR and estimated recovery income from leases that have been signed but have not yet commenced and leases in advanced negotiation.
4) Includes principal amortization. Excludes $35.0 million balance on revolving credit facility due in 2023 as this facility has two six-month extensions available at the
   Company's option provided compliance with financial covenants is maintained.

  FOURTH QUARTER 2021 INVESTOR UPDATE                                                                                                                                    47
Footnotes
SLIDE 43
1) Information on this slide reflects the consolidated portfolio plus RPT’s pro-rata share of joint ventures.
2) Assumes the exercise of two six-month extension options on RPT’s unsecured revolving line of credit.

 FOURTH QUARTER 2021 INVESTOR UPDATE                                                                            48
You can also read