2020 Critical Update to Caltrans Wildfire Vulnerability Analysis
←
→
Page content transcription
If your browser does not render page correctly, please read the page content below
2020 Critical Update
            to Caltrans Wildfire
            Vulnerability Analysis
            A Technical Report from the National Center
July 2021
            for Sustainable Transportation

            James H. Thorne, University of California, Davis
            Ryan M. Boynton, University of California, Davis
            Allan D. Hollander, University of California, Davis
            Jason P. Whitney, University of California, Davis
            Kristen D. Shapiro, University of California, Davis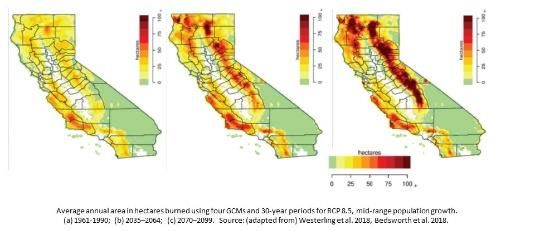
TECHNICAL REPORT DOCUMENTATION PAGE
1. Report No.                                 2. Government Accession No.               3. Recipientes Catalog No.
NCST-UCD-RR-21-13                             N/A                                       N/A
4. Title and Subtitle                                                                   5. Report Date
2020 Critical Update to Caltrans Wildfire Vulnerability Analysis                        July 2021
                                                                                        6. Performing Organization Code
                                                                                        N/A
7. Author(s)                                                                            8. Performing Organization Report No.
James H. Thorne, Ph.D., https://orcid.org/0000-0002-9130-9921                           UCD-ITS-RR-21-47
Ryan M. Boynton, https://orcid.org/0000-0002-3952-2573
Allan Hollander, Ph.D. https://orcid.org/0000-0002-2647-8235
Jason Whitney, https://orcid.org/0000-0003-0934-2675
Kristen D. Shapiro, https://orcid.org/0000-0002-9800-3183
9. Performing Organization Name and Address                                             10. Work Unit No.
University of California, Davis                                                         N/A
Institute of Transportation Studies                                                     11. Contract or Grant No.
1605 Tilia Street, Suite 100                                                            Caltrans 65A0686 Task Order 038
Davis, CA 95616                                                                         USDOT Grant 69A3551747114
12. Sponsoring Agency Name and Address                                                  13. Type of Report and Period Covered
U.S. Department of Transportation                                                       Final Report (April 2020 – March 2021)
Office of the Assistant Secretary for Research and Technology                           14. Sponsoring Agency Code
1200 New Jersey Avenue, SE, Washington, DC 20590                                        USDOT OST-R
California Department of Transportation
Division of Research, Innovation and System Information, MS-83
1727 30th Street, Sacramento, CA 95816
15. Supplementary Notes
DOI: https://doi.org/10.7922/G2N29V7S
Dataset DOI: https://doi.org/10.5061/dryad.sj3tx964v
16. Abstract
Catastrophic wildfires over the past five years (2015-2020) have caused damage to the Caltrans road network in 81 separate
wildfire events, leading to expenditures of over $590,000,000 to repair highway assets. To reduce the risk of further wildfire
damage and to improve public safety, particularly for disadvantaged communities, Caltrans has engaged in assessing the priority
locations for vegetation treatment within the lands it owns called the Right of Way (ROW). A 2019 analysis provided a map
showing the top 17% of vulnerabilities in the road network, representing both the risk of wildfire and to disadvantaged
communities that might need to use the transportation network as means of evacuation. This UC Davis research project was
designed to support efforts within Caltrans in conducting a wildfire vulnerability risk assessment for fuels reduction in the ROW
to protect Caltrans’ infrastructure and travelers. The project involved four components: 1) conducting a rigorous peer review of
the 2019 GIS-based study commissioned by Caltrans; 2) collecting and assessing the outputs of several climate change, fire, and
other models currently developed or under development for California, as well as future climate projections; 3) developing a
framework for the use of the prioritized segment model with other data further identify priority areas for fuels and risk
reduction; and 4) interviews with Caltrans staff on opportunities and obstacles to increasing the pace and scale of vegetation
treatments. The results contribute to infrastructure risk assessments, can be used to prioritize areas for treatment, to create a
tracking system of areas treated and risk lowered over multiple years, and to engage local governments and wildfire fighting
units to coordinate landscape fire risk reductions.
17. Key Words                                                            18. Distribution Statement
Wildfire, Vegetation Management, Priority Treatment Areas, Right         No Restrictions.
of Way, California
19. Security Classif. (of this report)                   20. Security Classif. (of this page)    21. No. of Pages    22. Price
Unclassified                                             Unclassified                            45                  N/A
Form DOT F 1700.7 (8-72)                                                                  Reproduction of completed page authorized
About the National Center for Sustainable Transportation The National Center for Sustainable Transportation is a consortium of leading universities committed to advancing an environmentally sustainable transportation system through cutting- edge research, direct policy engagement, and education of our future leaders. Consortium members include: University of California, Davis; University of California, Riverside; University of Southern California; California State University, Long Beach; Georgia Institute of Technology; and University of Vermont. More information can be found at: ncst.ucdavis.edu. Disclaimer The contents of this report reflect the views of the authors, who are responsible for the facts and the accuracy of the information presented herein. This document is disseminated in the interest of information exchange. The report is funded, partially or entirely, by a grant from the U.S. Department of Transportation’s University Transportation Centers Program and, partially or entirely, by a grant from the State of California. However, the U.S. Government and the State of California assume no liability for the contents or use thereof. Nor does the content necessarily reflect the official views or policies of the U.S. Government or the State of California. This report does not constitute a standard, specification, or regulation. This report does not constitute an endorsement by the California Department of Transportation of any product described herein. Acknowledgments This study was funded, partially or entirely, by a grant from the National Center for Sustainable Transportation (NCST), supported by the U.S. Department of Transportation (USDOT) and the California Department of Transportation (Caltrans) through the University Transportation Centers program. The authors would like to thank the NCST, the USDOT, and Caltrans for their support of university-based research in transportation, and especially for the funding provided in support of this project. The authors would like to thank Lisa Worthington, Caltrans, for her guidance during this project.
2020 Critical Update to Caltrans Wildfire
          Vulnerability Analysis
             A National Center for Sustainable Transportation Technical Report

                                                July 2021

    James H. Thorne, Department of Environmental Science and Policy, University of California, Davis
    Ryan M. Boynton, Department of Environmental Science and Policy, University of California, Davis
    Allan D. Hollander, Department of Environmental Science and Policy, University of California, Davis
Jason P. Whitney, Ph.D. Candidate, Geography Graduate Group, Department of Land, Air, Water Resources,
                                     University of California, Davis
       Kristen D. Shapiro, Department of Land, Air, Water Resources, University of California, Davis
TABLE OF CONTENTS
EXECUTIVE SUMMARY ....................................................................................................................iv
Introduction .................................................................................................................................... 1
Task 1: Caltrans’ Commissioned Report Review ............................................................................. 4
1.a UC Davis organized and conducted meetings necessary for the project ....................... 4
1.b Caltrans’ Commissioned Report Review ......................................................................... 4
1.c GIS data used to update the model ................................................................................ 5
1.d 2020 Risk Model of Caltrans Road Network and Communities to Wildfire ................... 6
Task 2: Collect and Assess Fire and Climate Model Outputs .......................................................... 8
2.a Assessment - Review of Climate and Fire Models (Called 2A & 2B in contract). ........... 8
2.b Selected data layers for use as context in prioritizing road segments for vegetation
treatment .................................................................................................................................. 10
Task 3: Compilation ....................................................................................................................... 11
3.a Data framework for selection of road segments for the entire state, by district, or for
visualizing local areas for engagement of stakeholders ........................................................... 11
3.b Final graphics in the form of the final presentation to Caltrans and associated tabular
data 11
3.c Final presentation of findings; provide data and graphics to Caltrans......................... 11
Task 4: Interviews with Caltrans vegetation management experts ............................................. 12
4.a Written summary and report from the interviews....................................................... 12
References .................................................................................................................................... 18
Data Management ........................................................................................................................ 19
Appendix A .................................................................................................................................... 20
Summary ................................................................................................................................... 20
Description ................................................................................................................................ 20
Methodology............................................................................................................................. 20
Data Details ............................................................................................................................... 23
iList of Tables
Table 1. The 21 data layers that were used in the original fire-risk ranking in the 2019 spatial
model of the Caltrans road network. The agency that produced the data is shown in the left-
hand column. ............................................................................................................................ 2
Table 2. The 21 data elements used in the 2019 edition of the model.......................................... 7
Table 3. Additional data provided for context evaluation. ........................................................... 10
Table 4. The source and date of production for the 21 data layers used in the updated model. 22
Table 5. Caltrans - Average Daily Traffic Numbers (AADT) ........................................................... 23
Table 6. Caltrans - Highway Class.................................................................................................. 24
Table 7. Caltrans - Lifeline Routes................................................................................................. 25
Table 8. CalFire - Fire Threat ......................................................................................................... 25
Table 9. CalFire - SRA/FHSZ ........................................................................................................... 26
Table 10. CalFire - Fire History ...................................................................................................... 26
Table 11. CalFire - Large Trees ...................................................................................................... 27
Table 12. US Census - Families in Poverty .................................................................................... 28
Table 13. US Census - People with Disabilities ............................................................................. 28
Table 14. US Census - People that have difficulty speaking ......................................................... 29
Table 15. US Census - People over 65........................................................................................... 29
Table 16. US Census - People Under 5 .......................................................................................... 30
Table 17. US Census - Households without a Car ......................................................................... 31
Table 18. US Census - Housing Density ......................................................................................... 31
Table 19. USDA - WUI ................................................................................................................... 32
Table 20. USDA - FRID ................................................................................................................... 33
Table 21. USDA - Carbon Storage ................................................................................................. 33
Table 22. USDA - Wildfire Threat to Water................................................................................... 34
Table 23. USDA - Surface Waters .................................................................................................. 35
Table 24. USDA - Site Quality ........................................................................................................ 35
Table 25. Oregon State University (LEMMA) - Standing ............................................................... 36
iiList of Figures
Figure 1. Selected road segments using (left) the 17% extent of the Caltrans road network also
identified in the 2019 report. Right shows prioritized segments in the top 30%, by decile. ... 6
Figure 2. Graphics from 4th CCCVA showing the annual area burned using an ensemble of 4
GCMs, and for 3 periods (left to right): 1961-1990, 2035-2055, and 2070-2099. ................... 9
iii2020 Critical Update to Caltrans Wildfire Vulnerability
Analysis
EXECUTIVE SUMMARY
Catastrophic wildfires over the past five years (2015-2020) have caused damage to the Caltrans
road network in 81 separate wildfire events, leading to expenditures of over $590,000,000 to
repair highway assets. To reduce the risk of further wildfire damage and to improve public
safety, particularly for disadvantaged communities, Caltrans has engaged in assessing the
priority locations for vegetation treatment within the lands it owns called the Right of Way
(ROW). A 2019 analysis provided a map showing the top 17% of vulnerabilities in the road
network, representing both the risk of wildfire and to disadvantaged communities that might
need to use the transportation network as means of evacuation.
This UC Davis research project was designed to support efforts within Caltrans in conducting a
wildfire vulnerability risk assessment for fuels reduction in the ROW to protect Caltrans’
infrastructure and travelers. The project involved four components: 1) conducting a rigorous
peer review of the 2019 GIS-based study commissioned by Caltrans; 2) collecting and assessing
the outputs of several climate change, fire, and other models currently developed or under
development for California, as well as future climate projections; 3) developing a framework for
the use of the prioritized segment model with other data further identify priority areas for fuels
and risk reduction; and 4) interviews with Caltrans staff on opportunities and obstacles to
increasing the pace and scale of vegetation treatments. The results contribute to infrastructure
risk assessments, can be used to prioritize areas for treatment, to create a tracking system of
areas treated and risk lowered over multiple years, and to engage local governments and
wildfire fighting units to coordinate landscape fire risk reductions.
We updated the priority routes for vegetation treatment, and selected treatment needs ranking
for the top scoring 10, 17, 20, and 30% of the 1500 miles of the Caltrans highway network. The
top 17% is equivalent to the 2019 priority rankings. However, in the interests of creating multi-
year effort, that will first bring down the wildfire risk across the entire network, and then have
the possibility of being used for planning recurring treatments across the network, we
identified the decile ranked approach. This allows each district to estimate how long a program
to reduce risk would take in their network, based on overall statewide risk and their local
capacity and funding to implement the work.
ivIntroduction
Catastrophic wildfires over the past five years (2015-2020) have caused damage to the Caltrans
road network in 81 separate wildfire events. This has led to expenditures of over $590,000,000
to replace highway assets. To reduce the risk of further wildfire damage and to improve public
safety, particularly for disadvantaged communities, Caltrans has engaged in assessing the
priority locations for vegetation treatment within the lands that it owns called the Right of Way
(ROW). In 2019 the Davey Group provided a map showing the top 17% of vulnerabilities in the
road network, representing both the risk of wildfire and to disadvantaged communities that
might need to use the transportation network as means of evacuation.
This UC Davis research project was designed to support efforts within Caltrans in conducting a
wildfire vulnerability risk assessment for fuels reduction in the ROW to protect Caltrans’
infrastructure and travelers. The project involved four components: 1) conducting a rigorous
peer review of the 2019 GIS-based study commissioned by Caltrans; 2) collecting and assessing
the outputs of several climate change, fire, and other models currently developed or under
development for California, as well as future climate projections; 3) developing a framework for
the use of the prioritized segment model with other data further identify priority areas for fuels
and risk reduction; and 4) interviews with Caltrans staff on opportunities and obstacles to
increasing the pace and scale of vegetation treatments. The results contribute to infrastructure
risk assessments, can be used to prioritize areas for treatment, to create a tracking system of
areas treated and risk lowered over multiple years, and to engage local governments and
wildfire fighting units to coordinate landscape fire risk reductions.
This project permits Caltrans to spatially evaluate risks to infrastructure and travelers from
buildup of fuels within the ROW. This study spans 1 year. The project encompassed 3 Tasks, and
a 4th Task was added in discussions with the sponsor.
First, we evaluated Caltrans’ existing study, the data that went into it, and the methods used.
The existing study, produced by the Davey Resources Group, will be referred to here as the
2019 study. The review required use of the data layers used in that analysis, the methods used,
and a spatial version of the outputs.
The model developed by the Davey Resources Group weighted 21 spatial data layers in order to
create a prioritization map for vegetation management within the Caltrans ROW (Table 1).
Caltrans undertook the work following Executive Order N-05-19, which directed the California
Department of Forestry and Fire Protection (CAL FIRE) to, in consultation with other state
agencies and departments, to recommend immediate, medium, and long-term actions to help
prevent destructive wildfires. With assistance from the Governor’s office of Emergency Services
and other agencies, CAL FIRE produced the Community Wildfire Prevention and Mitigation
Report, also known as the 45 Day Report.
Among the criteria for identifying areas for priority fuels reductions, CAL FIRE identified the
following criteria that can be used as maps in creating a priority landscape for vegetation
1management. Note that social equity and safety for disadvantaged communities is critical and
has its own section, in order to try and map communities that are at risk.
Table 1. The 21 data layers that were used in the original fire-risk ranking in the 2019 spatial
model of the Caltrans road network. The agency that produced the data is shown in the left-
hand column.
Source Map Type
Caltrans Average Daily Traffic Count
Highway Class
Emergency Evacuation Routes
CAL FIRE Fire Threat
SRA / FHSZ
Fire History
Large Trees
US Census Bureau Families in Poverty
People with Disabilities
People that have Difficulty Speaking English
People over 65
People Under 5
Households without a Car
Housing Density
USDA Forest Service WUI
FRID
Carbon Storage
Wildfire Threat to Water
Surface Waters
Site Quality
Standing Timber
Because Caltrans is a land-owning agency, Caltrans responded to the statewide initiative by
developing its own priority ranking of lands within its ROW for vegetation management.
Caltrans added data from its own geospatial data in the form of measures of Average Daily
2Traffic Numbers, Highway Class, and Emergency Evacuation Routes (called in the previous
report, Lifeline Routes).
The Davey Resource Group, following guidance and with engagement from Caltrans and CAL
FIRE, ranked these 21 data layers, in order to prioritize by 1-mile route segments all the ~1500
miles road network under Caltrans management (Appendix 1). Their map, here titled the 2019
Wildfire Vulnerability Map, has been in use by Caltrans in order to prioritize additional
vegetation management procedures. These procedures are undertaken by the Caltrans
Maintenance Division, with typically each of the 12 Caltrans Districts responsible for their own
roads.
The UC Davis obligation is presented here as four tasks:
Task 1
First, UC Davis reviewed the input data from the 2019 Wildfire Vulnerability Map, find updated
data layers, replicate the original analysis, update the analysis using new edition spatial data,
and evaluate the overall model.
Task 2
Second, we reviewed climate change projections and the current wildfire data for California. Dr
Thorne recently served as a science reviewer and content editor for California’s 4 th climate
vulnerability assessment. He used the climate projections from that exercise and compared
their predicted future annual minimum temperature and precipitation to a contemporary
baseline. He selected an emissions scenario and general circulation model (GCM) to use for
climate risk assessment for this project. Similarly, he reviewed recent publications from the
wildfire modeling community. The results are presented below.
Task 3
Third, we overlaid newly acquired spatial data (for forest/vegetation structure or fuel density
and future climate stress for existing vegetation, as well as recent wildfire footprints) with our
updated version of the 2019 model, here called the 2020 model. We note that fire risk from Cal
Fire was already embedded in the 2019 and 2020 models. We used the outputs to evaluate risk
factors along the State and Interstate highway network, and to create a framework for
engaging local governments and fire officials in discussions of priority areas for vegetation
management to reduce wildfire risk.
Task 4
Fourth, we used time allotted in the grant proposal to hire a graduate student for winter
quarter, 2021. The student, Jason Whitney, a Ph.D. student in the Geography Graduate Group,
initiated a review of the current practices for vegetation management within Caltrans’ right of
way. He interviewed six people, who provided their perspectives on the current vegetation
management practices in Caltrans, and the steps that might be needed to increase vegetation
treatments on the landscape.
3Task 1: Caltrans’ Commissioned Report Review
a) UC Davis will organize agenda, announcements and meetings
b) Caltrans’ Commissioned Report Review
c) GIS data used to update the model
d) 2020 Risk Model of Caltrans Road Network and Communities to Wildfire
1.a UC Davis organized and conducted meetings necessary for the project
We organized regular coordination meetings. Early topics included coordination of data for use
in the modeling, a briefing from Davey Resource Group, the previous modelers, clarifying the
objectives and priorities for Caltrans, and assignment of tasks to the UC Davis team members.
Ongoing meetings then focused on completion of tasks, handling logistics raised by COVID, and
updating the focus as new data became available. We presented final results at three meetings.
Two of the final presentations were scheduled and coordinated by the UC Davis team, being to
the Caltrans administrative staff and the Caltrans GIS staff. The third final presentation was
organized by Caltrans, in which we presented to regional staff and stakeholders in the San
Francisco Bay Area. This meeting focused on how the results of our modeling might be used for
outreach to local stakeholders. In addition, UC Davis attended other meetings are requested by
Caltrans during the course of the study.
1.b Caltrans’ Commissioned Report Review
Caltrans commissioned a spatial analysis of fuels buildup and fire risk along its road system by
the Davey Resources Group. They used 21 data layers supplied from 4 sources to build the
assessment (Table 2). As mentioned, 18 of these are data also used by CAL FIRE has used in its
“45 Day Report” for assessing wildfire risk at landscape levels, and were authorized by the
governor’s office to include metrics that permit an assessment of the vulnerability of
communities to wildfire as well. Because Caltrans is a land-owning agency, it also added three
metrics relevant specifically to the road network.
We reviewed the data inputs and the spatial methods used to create the 2019 risk map.
Because the model is using a state-wide framework also in use by other agencies, and because
the methods were transparent and replicable, we accepted the methodology used in the 2019
report. We note that in some districts, additional priorities could be added. We recommend
retaining the original model, and incorporating either district or more localized considerations
afterwards. If those are available in map form, they can be overlaid in a GIS. If they are in the
form of verbal suggestions, named areas can be inspected using the GIS and additional
contextual data such as high-resolution aerial imagery.
We replicated the model outputs from the 2019 effort, despite somewhat limited methods
being available. We then updated the input data, such as the census elements used, and
updated the risk model for 2020. Note that because the Davey Resource Group Executive
Report (2019) contains additional methods as to the weightings assigned to the 21 data layers,
we include that report here for reference as Appendix 1. The intent of including it is to retain all
the information associated with the creation of the spatial model in a recoverable format.
41.c GIS data used to update the model
There were 21 data layers used in the Davey group’s model (Table 1). We obtained the data and
reconstructed the model outputs. We used the following steps to review the previous model
and to build the updated 2020 spatial model and maps:
1. Evaluate 2019 assessment data layers and bring them up-to-date with most current data
a) Updated layers included fire history data, fire return interval, wildfire threat to
water, surface waters drinking water, and all socioeconomic data from the US
Census American Community Survey
2. Create priority index raster layer by combining stack of 21 updated layers using
weightings from 2019 analysis
3. Buffer state highway vector layer by 1/10th mile
4. Use state highway buffer as mask on raster priority index layer
5. Buffer 1-mile interval postmile points to create half-mile radius circles covering state
highway network
6. Overlay circular point buffers on priority index layer to extract index values for 1-mile
segments along highway network
7. Import data table of values along segments into R for analysis
8. Calculate breakpoints for priority index using percentile ranges of values
a) 0-17% range to give corresponding mileage to 2019 analysis
b) Breakpoints of 0-10%, 10-20%, 20-30%,30-60%, 60-100% for alternative
presentation
c) Focus on 0-10%, 10-20%, 20-30% classes
9. Assign circular point buffers to these range classes
10. Map the highway network to these index classes using postmile ranges corresponding to
these circular point buffers
To join the circular point buffers to the post mile and road segments used by Caltrans for
mapping its road network, we:
1. Segmented state highway network by 1/10 mile postmiles
2. Spatially joined the ½ mile circles (above) with the 2020 priority index value to the
highway segments (using the road segment’s centroid).
3. Assigned each segment in the highway network to the range classes (based on the
breakpoints: the top 10%, 17%, 20%, & 30%).
These steps permitted Selection of ranking criteria, in order to identify the segments of roads
that have the highest level of risk, according to the model. In discussions with Caltrans, we
identified two levels of ranking. We used the top 17% of the ranked state highway ROWs as the
first cutoff, because that was also used in the 2019 report (Appendix 1). We also used the top
10%, the next 10-20%, and the 20-30% rankings, to show what a program of 3 years might look
like with vegetation treatments for fire risk reduction within the ROW.
5The data review examined the suitability of a variety of spatial data for use in creating a
baseline inventory of vegetation type, density and size within Caltrans Right of Ways. We
considered the date of publication, spatial extent, the mapping grain size, level of processing,
difficulty with which the data could be used to accomplish the inventory, and other aspects of
the data.
We identified several modes of analysis. For rapid regional screening, the use of our 2020
version of the risk abatement priority model provides the lowest cost method to identify
candidate roads for fuels reduction. However, these results need to be provided to Caltrans
region personnel, and to local firefighting groups, in order to ensure that actions they have
already prioritized are supported, or extended through the use of the 2020 model.
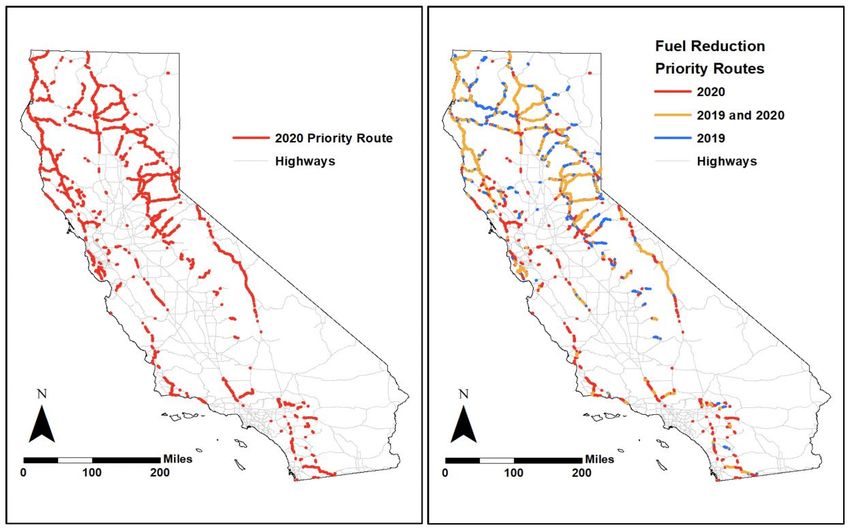
Figure 1. Selected road segments using (left) the 17% extent of the Caltrans road network also
identified in the 2019 report. Right shows prioritized segments in the top 30%, by decile.
1.d 2020 Risk Model of Caltrans Road Network and Communities to Wildfire
The Risk model is a spatial product. The input data layers and the final GIS maps are included in
the GIS deliverables. These data have been provided to Caltrans and are posted on Dryad
(https://doi.org/10.5061/dryad.sj3tx964v).
6Table 2. The 21 data elements used in the 2019 edition of the model.
Group Criteria Raster Name Last Update Source Link Weighting
C a ltra ns , c re a te d fro m 2017 AADT GIS da ta
Ave ra ge Da ily Tra ffic m a inta ine d by C a ltra ns , Divis io n o f Tra ffic
Caltrans Num be rs (AADT) AADT.tif 2018 Ope ra tio ns -pro vide d by Andre w Lo za no C o nta c t Andre w Lo za no (C a ltra ns ) 0.07
M a inta ine d by C a ltra ns -pro vide d by Andre w Lo za no
Highwa y C la s s Highwa yC la s s .tif 2018 “ Highwa yC la s s ific a tio n_M e ta Da ta .do c x” C o nta c t Andre w Lo za no (C a ltra ns ) 0.07
Em e rge nc yLife R o ute .ti M a inta ine d by C a ltra ns -pro vide d by Andre w Lo za no
Life line R o ute s f 2018 “ Highwa yC la s s ific a tio n_M e ta Da ta .do c x” C o nta c t Andre w Lo za no (C a ltra ns ) 0.14
https ://fra p.fire .c a .go v/m a pping/gis -
Calf ire F ire Thre a t Thre a t.tif 2013 C a lF ire (F R AP ) da ta / 0.08
https ://hub.a rc gis .c o m /da ta s e ts /M o nte
S R A / F HS Z S R A_F HS Z.tif 2018 C a lF ire (F R AP ) re yC o ::s ra -fire -ha z-zo ne s -1 0.05
https ://fra p.fire .c a .go v/m a pping/gis -
F ire His to ry F ire His to ry.tif 2018 C a lF ire (F R AP ) da ta / 0.05
https ://fra p.fire .c a .go v/m a pping/gis -
La rge Tre e s La rge Tre e s .tif 2015 C a lF ire (F R AP ) da ta / 0.05
5-ye a r Am e ric a n US C e ns us B ure a u - P o ve rty S ta tus o f F a m ilie s by
C o m m unity F a m ily Type in La s t 12 M o nths : C e ns us Da ta Ta ble : https ://www.nhgis .o rg/do c um e nta tio n/t
Census F a m ilie s in P o ve rty F a m ilie s InP o ve rty.tif S urve y 2013-2017 B 17010 a bula r-da ta 0.03
5-ye a r Am e ric a n
P e o ple WithDis a bilitie s . C o m m unity US C e ns us B ure a u - S e x by Dis a bility Age : C e ns us https ://www.nhgis .o rg/do c um e nta tio n/t
P e o ple with Dis a bilitie s tif S urve y 2013-2017 Da ta Ta ble B 18101 a bula r-da ta 0.03
5-ye a r Am e ric a n US C e ns us B ure a u - La ngua ge S po ke n a t Ho m e fo r
P e o ple tha t ha ve Diffic ulty Diffic ultyS pe a kingEngli C o m m unity the P o pula tio n 5 ye a rs a nd Ove r: C e ns us Da ta https ://www.nhgis .o rg/do c um e nta tio n/t
S pe a king Englis h s h.tif S urve y 2013-2017 Ta ble C 16001 a bula r-da ta 0.03
5-ye a r Am e ric a n
C o m m unity US C e ns us B ure a u - S e x by Age : C e ns us Da ta Ta ble https ://www.nhgis .o rg/do c um e nta tio n/t
P e o ple o ve r 65 P e o ple Ove r65.tif S urve y 2013-2017 B 01001 a bula r-da ta 0.03
5-ye a r Am e ric a n
C o m m unity US C e ns us B ure a u - S e x by Age : C e ns us Da ta Ta ble https ://www.nhgis .o rg/do c um e nta tio n/t
P e o ple Unde r 5 P e o ple Unde r5.tif S urve y 2013-2017 B 01001 a bula r-da ta 0.03
5-ye a r Am e ric a n US C e ns us B ure a u - M e a ns o f Tra ns po rta tio n to
C o m m unity Wo rk by Ve hic le s Ava ila ble : C e ns us Da ta Ta ble https ://www.nhgis .o rg/do c um e nta tio n/t
Ho us e ho lds witho ut a C a r No Tra ns po rta tio n.tif S urve y 2013-2017 B 08141 a bula r-da ta 0.03
5-ye a r Am e ric a n
C o m m unity US C e ns us B ure a u - Ho us ing Units : C e ns us Da ta https ://www.nhgis .o rg/do c um e nta tio n/t
Ho us ing De ns ity Ho us ingDe nis ty.tif S urve y 2013-2017 Ta ble B 25001 a bula r-da ta 0.04
US F S - 2010 Wildla nd Urba n Inte rfa c e o f the https ://da ta .na l.us da .go v/s e a rc h/type /d
USDA WUI WUI.tif 2015 C o nte rm ino us Unite d S ta te s a ta s e t 0.06
https ://www.fs .us da .go v/de ta il/r5/la ndm
a na ge m e nt/gis /? c id=S TELP R DB 53278
F R ID F R ID.tif 2017 US F S - R e gio n 5, La nd & R e s o urc e M a na ge m e nt 36 0.06
US DA - F o re s t c a rbo n s to c ks o f the c o ntiguo us https ://www.fs .us da .go v/rds /a rc hive /c a t
C a rbo n S to ra ge C a rbo nS to ra ge .tif 2013 Unite d S ta te s (2000-2009) a lo g/R DS -2013-0004 0.03
https ://www.fs .fe d.us /e c o s ys te m s e rvic
Wildfire Thre a t to Wa te r F ire Thre a tTo Wa te r.tif 2010 US DA - F o re s t2F a uc e ts e s /F S _Effo rts /Ge tF 2F Da ta /inde x.php 0.03
S urfa c e DrinkingWa te r.t https ://www.fs .fe d.us /e c o s ys te m s e rvic
S urfa c e Wa te rs if 2010 US DA - F o re s t2F a uc e ts e s /F S _Effo rts /Ge tF 2F Da ta /inde x.php 0.03
https ://da ta .fs .us da .go v/ge o da ta /e dw/d
US DA - F IA (F o re s t Inve nto ry Ana lys is ) C o unty a ta s e ts .php? xm lKe ywo rd=F IA+La ndc o v
S ite Qua lity S ite Qua lity.tif 2019 Es tim a te s 2017 e r+C o unty+Es tim a te s 0.03
Ore go n S ta te Unive rs ity (LEM M A) - Us e s F IA Da ta https ://le m m a .fo re s try.o re go ns ta te .e du
S ta nding Tim be r S ta ndingTim be r.tif 2014 fro m US DA /da ta /s truc ture -m a ps 0.03
7Task 2: Collect and Assess Fire and Climate Model Outputs
Deliverables:
a) Assessment – Review of Climate and Fire Models
b) Selected data layers for use as context in prioritizing road segments for vegetation
treatment
2.a Assessment - Review of Climate and Fire Models (Called 2A & 2B in
contract).
Research in the fields of climate change and wildfire is fast-moving. The most recent benchmark
for the state was California’s 4th Climate Vulnerability Assessment (4th CCCVA;
https://www.climateassessment.ca.gov/). We used the assessment as basis for considering
data layers to include as contextual information in screening the California highway network.
Confidence in projections of increasing temperatures is very high, as with predictions of
declining snowpack, and frequency of drought. Confidence in increasing acreage burned by
wildlife is medium-high. Projections to mid-century under RCP8.5 show an increase in annual
average maximum daily temperatures of +5.8⁰F. As has been observed since the assessment,
climate projections suggest seasonal summer dryness in California will become prolonged due
to “earlier spring soil drying that lasts longer into the fall and winter rainy season (e.g., Pierce et
al., 2014; Swain et al., 2018)” (Bedsworth et al. 2018).
The primary statewide report (Bedsworth et al. 2018). The overall finding for the state was that,
under current emission levels, the area per year burned would increase by 77% by the end of
century, and that insurance costs would rise and become harder to obtain. The statewide
report suggests research that management is a way to lower wildfire risk, by reducing density
of trees. Increased fire risk correlates to increasing temperatures. The statewide report
(Bedsworth et al. 2018) discusses the increase in Santa Ana winds in southern California, and
Nausler et al 2019, shows similarities of winds in the 2017 Tubbs fire to wind events that
increased the burn severity to those from southern California. However, spatially explicit
models of where higher severity fires due to increasing wind speeds have not been published.
We reviewed the models used in the CA climate assessments, and selected MIROC ESM RCP8.5
emissions scenario as suitable for use by Caltrans vegetation management planning. The RCP4.5
emissions scenario is closest to the Paris Accord-level of emissions, but achieving this level of
reductions is not under the control of the Caltrans Maintenance, and the time table to actually
“bend the curve” of global emissions is such that it is an unsafe assumption that these lowered
emission levels will be achieved with the next 30 years.
Generally, wildfire models that predict increases in area burned are statistical (e.g., Westerling
et al. 2018). While the outputs are spatial (e.g., Figure 2Figure 2), they typically are either too
far into the future and possibly too generalized to inform vegetation treatment in the ROW, at
least in the short term. Not surprisingly, the areas that are wooded appear with higher risk.
Converging lines of evidence, including the CCCVA and CAL FIRE fire risk maps suggest that
Caltrans has adopted an appropriate response in seeking to reduce risk of wildfire within its
8ROW. Instead, we identified the use of fine scale (10 m), remotely-sensed measures of
vegetation density such as Surface fuels and Bulk Density to identify where fires could be more
impacting, and wildfire perimeters to provide a view of where fuel loads may have been
decreased in the near term along state highways.
Figure 2. Graphics from 4th CCCVA showing the annual area burned using an ensemble of 4
GCMs, and for 3 periods (left to right): 1961-1990, 2035-2055, and 2070-2099.
Current efforts to better model the behavior of future wildfire are funded and underway at the
present time, including a project the California Energy Commission, a project funded by the
University of California, and one funded by the CA Department of Conservation.
To further evaluate the ROWs we added three sources of data to use as context in addition to
the 2020 update of the ROW wildfire risk map.
First, the California Forest Observatory (https://forestobservatory.com/), produced annually by
Salo Sciences, provides 10m-resolution maps of a variety of forest structure for all of California.
Their vegetation bulk density and surface fuels measures (30m or finer spatial resolution,
statewide coverage) from this site can be used to identify areas within and adjacent to the ROW
that have high fuel loads, and therefore are at risk of more severe wildfire.
Second, we used climate change projections that were also included in the 3rd and 4th California
Climate Vulnerability Assessments (https://www.climateassessment.ca.gov/) and a climate risk
model developed by the Thorne group (Thorne et al. 2016; 2017; 2020; Choe & Thorne 2019;
Williams et al. 2018). This model identifies the areas for each major vegetation type (WHR types
as used by CDFW) that are the most likely to remain in climatically suitable locations, therefore
more climate-secure; and those areas most likely to be highly climatically stressed, therefore
more at risk from stand-replacing wildfires. We suggest using the MIROC ESM RCP8.5 climate
exposure data from our 2020 publication (Thorne et al. 2020) as a suitable spatial model for use
in exploring the risks to existing vegetation types within Caltrans ROW.
9Third, we evaluated the use of fire perimeter maps as provided by CAL FIRE and the USFS.
These show areas that, if recently burned, may require a lower level of vegetation management
within the ROW, even while in many cases other costs are incurred by Caltrans due to passage
of wildfire across a road.
2.b Selected data layers for use as context in prioritizing road segments for
vegetation treatment
The California Forest Observatory data, the climate exposure data are provided as additional
GIS data in the GIS deliverables (Table 3). The fire perimeters data is also included, but it was
additionally part of the 2020 Wildfire Risk update.
Table 3. Additional data provided for context evaluation.
New data
New
Group Description (Criteria) Updates Source Location
Salo Sciences Surface Fuels 2020 California Forest Observatory https://forestobservatory.com/
Bulk Density 2020 California Forest Observatory https://forestobservatory.com/
Canopy cover 2020 California Forest Observatory https://forestobservatory.com/
Canopy height 2020 California Forest Observatory https://forestobservatory.com/
Ladder fuel density 2020 California Forest Observatory https://forestobservatory.com/
UC Davis - Information
Center for the Environment
UC Davis Vegetative Climate Exposure 2019 (Thorne et al. 2020)
Calfire Fire Perimeters 2016-2019 2019 CalFire (FRAP)
downloaded Dec 7, 2020;
https://data-
nifc.opendata.arcgis.com/datas
ets/5da472c6d27b4b67970acc7b
NIFS Fire Perimeters 2020 2020 National Interagency Fire Center
5044c862_0
10Task 3: Compilation
Deliverables:
a) Data framework for selection of road segments for the entire state, by district, or for
visualizing local areas for engagement of stakeholders
b) Final graphics in the form of the final presentation to Caltrans and associated tabular
data.
c) Final presentation of findings; provide data and graphics to Caltrans
We combined the updated data layers to develop the 2020 fuels risk maps, with additional data
possible to add representing the fire perimeters, climate risk and fuels within the ROW. In
discussion with the sponsor, we identified a framework for considering how the outputs could
be incorporated into ongoing-decision support for Caltrans operations and management.
3.a Data framework for selection of road segments for the entire state, by
district, or for visualizing local areas for engagement of stakeholders
The UCD Davis team has provided all documents and project coordination. Due to the varying
local conditions and the need to engage local governments and stakeholders in the process of
selecting areas in the Caltrans ROW (and beyond the ROW) for vegetation management, we
recommend the use of the 2020 updated wildfire risk maps as a starting point for visualization
and prioritization exercises that also incorporate regional data identified here (vegetation
structure, future climate risk, and fire perimeter data) as well as district- and stakeholder-
provided data and observations when making the final yearly determination of vegetation
treatment segments in the ROW.
3.b Final graphics in the form of the final presentation to Caltrans and
associated tabular data
This report is the deliverable to 3B. This report established the data, protocols and rankings for
the Caltrans ROW with regards to identifying priority fuels reduction areas. The report also
makes recommendations on how to provide the spatial results for ongoing Caltrans operations.
The report further provides feedback from Caltrans staff about how to navigate the increased
pace and scale of vegetation treatments that are anticipated. The final graphics are available as
a PowerPoint presentation, submitted with this report as an accompanying document.
3.c Final presentation of findings; provide data and graphics to Caltrans
The UCD Team and the sponsor agreed to present the final results at zoom meetings at the
request of the sponsor. Three final presentations to Caltrans Staff were presented on April 23,
May 7, and May 14, 2021. The first presentation was to Caltrans Sacramento and District staff;
the second was with the GIS staff in the maintenance division, in order to relay the organization
of the GIS data; and the third presentation focused on an application of the analysis for District
4 staff. There was no in-person meeting, due to COVID.
11Task 4: Interviews with Caltrans vegetation management experts
Deliverables:
a) Written summary and report from the interviews.
4.a Written summary and report from the interviews
Mr. Jason Whitney, graduate student at UC Davis conducted a series of interviews at the
request of the sponsor. The intent was to find out Caltrans staff members’ thoughts about how
vegetation management in the ROW is typically conducted, and what are the current challenges
for increasing the pace and scale of management in order to reduce risk of wildfire.
Six employees, including 2 from headquarters and four from district offices were interviewed.
Their perspectives and responses are compiled here.
Interview Results from Caltrans Staff
Jason Whitney, UC Davis
ABSTRACT
Caltrans faces significant challenges as California experiences another year of severe drought.
As of April 2021, several California counties have already been declared as drought emergency
areas. This paper provides a critical evaluation of Caltrans’ vegetation management program
with a lens on climate change adaptation and resilience based largely on consultation with
representatives across relevant Caltrans programs.
Introduction
As extended drought continues to create dangerous fire conditions in California, new efforts are
being made to ensure that management activities focus on appropriate mitigation strategies to
combat this threat. The Governor’s Forest Management Task Force recently established
California’s Wildfire and Forest Resilience Action Plan, which is a comprehensive strategy to
reduce wildfire risk and improve health of forests and wildlands (Forest Management Task
Force, 2020). To help ensure that state agencies have appropriate resources to work together
and meet these challenges, the Wildfire and Forest Resilience Action Plan has been followed by
a proposed one-billion-dollar investment in the 2021-2022 state budget. More specifically it
provides:
• “$512 million to increase landscape scale resilience in our forests and natural
landscapes, including through increased use of prescribed fire and funding for tribes and
small landowners.
• $335 million to complete at least 45-60 strategic fuel break projects each year over the
next several years and grants to support local wildfire plans and projects.
• $38 million to harden and protect fire-vulnerable communities.
12• $39 million to ensure our predictive models and investments in wildfire resilience are
based on the best available science.
• $76 million to expand economic and job opportunities through the Climate Catalyst
Fund’s low-interest lending program, the California Conservation Corps workforce
programs, and forest management job training.” (CalEPA, 2021)
Caltrans has also been working to meet the fire risk challenges posed by climate change, in an
effort documented in published reports ranging from late 2017 to late 2019. These Climate
Change Vulnerability Assessments Summary Reports and associated Technical Reports describe
a suite of climate change effects in each of Caltrans’ 12 districts (Caltrans, 2019). In addition to
the district level analysis of climate change issues, Caltrans contracted with Davey Resources
Group to produce the 2019 Caltrans Wildfire Vulnerability Assessment. This assessment which
combined multiple geographic map layers in a geographic information system (GIS) model to
create a map that identified and prioritized 2,600 centerline miles of roadway with significant
fire risk.
The 2019 Caltrans Wildfire Vulnerability Assessment has subsequently been updated and
verified by UC Davis Transportation Institute researchers with 2020 data to enable the
operationalization for prioritization of vegetation management efforts in Caltrans managed
state responsibility areas (SRA). The responsibility of Caltrans to create fire-safe roadways is
highlighted in sections 2.24 – 2.29 of California’s Wildfire and Forest Resilience Action Plan
(Forest Management Task Force, 2020). This research effort directly addresses aspects of action
item 2.25:
“Develop Framework for Safe Road Corridors: Through workshops with key agencies and
stakeholders, Caltrans is establishing a framework for collaborative fuels reduction projects
to protect roadway travelers, communities along highways and to reduce roadside ignitions
along primary and secondary emergency evacuation routes. Caltrans will identify highway
corridors most in need of defensible space and develop a strategy in the spring of 2021
while seeking to align funding and crew resources.”
Caltrans Integrated Vegetation Management Program
The environmental impacts of Caltrans vegetation management activities are addressed by a
1992 programmatic environmental impact report (PEIR) entitled “Environmental Impact Report
on Caltrans' Vegetation Control Program”. The PEIR was prepared to address public concerns
about the health risks of chemical control methods. For clarity, the "vegetation control
program" the PEIR addresses is the entirety of all Caltrans activities directed at management of
non-cultivated vegetation occurring along the state highway system. The PEIR analyzed six
options, including the current program at that time, the “Chemical-Preferred” program and a
“No Control” option. The alternative which had the least significant impacts, and which Caltrans
has been implementing since that time, is the “Integrated Vegetation Management Program”
or IVM. In the IVM, all methods are available (mechanical (i.e., mowing), chemical (i.e.,
herbicide spraying), manual, cultural, thermal, and biological techniques) to establish preferred
roadside vegetation wherever feasible.
13The PEIR identified the project area as approximately 230,000 acres of right-of-way (ROW) of
California’s 15,000 miles of highways and or about ¼ of 1 percent of California. Caltrans divides
California into 12 districts many of which span multiple ecoprovinces with a diverse range of
vegetation in each. Caltrans vegetation management activities are also affected by the broad
range of stakeholders which create additional zones of differing management complexity.
These range from limited vegetation control activities on highways crossing federal lands to a
requirement that non-chemical methods of control be used in some counties and municipal
jurisdictions. Within the PEIR the stated objectives of vegetation control are to:
• protect roadbed and pavement integrity;
• preserve visibility of traffic, highway facilities, and wildlife;
• promote road system drainage;
• inhibit ignition and spread of fire;
• maintain designed vehicle recovery areas;
• allow large vehicle and snowplow clearance;
• promote melting of ice and snow;
• minimize soil erosion and slope instability;
• suppress noxious weeds;
• eliminate damaged vegetation that may fall or spread plant disease;
• maintain an attractive roadside appearance; and
• protect landscape plantings
Caltrans has operationalized the IVM in the Maintenance Manual, specifically chapter C2 where
it identifies IVM methods to create a 4-8 ft “narrow clear strip” as including: chemical, thermal,
biological, cultural, mechanical, structural, and manual control with stated Department
objectives to achieve the goal of a 50% reduction in herbicide use from 1992 levels to an 80%
reduction by 2012 (Caltrans Maintenance Division, 2014). The methods used to create the
“narrow clear strip” are identified in vegetation control plans (veg con) by Landscape Specialists
in each District who prepare veg con plans each year. These plans are finalized in April of each
year and identify vegetation management activities for every segment of the roadway. These
veg con plans are then used by maintenance crews from Caltrans yards to coordinate
vegetation control activities. Landscape Specialists generally have a Pest Control Advisors
license and sometimes are certified arborists and critically are in advisory roles only.
Vegetation management challenges identified by interviews
What follows is a summary of the challenges identified through conversations with
representatives across relevant Caltrans programs. These serve to highlight some of the
common as well as unique challenges and opportunities facing vegetation management efforts
on the district and statewide level. Effort was made to obtain a representative sample of
districts across the state. Four employees from three districts and two from the Caltrans Office
of Roadside Management at headquarters (HQ) in Sacramento were interviewed. This portion
of the study was constrained by time challenges, willingness to participate, and difficulty
contacting relevant individuals. The employees from the districts consisted of three landscape
specialists (who write vegetation control plans) and an environmental planner. The views
14expressed herein are a synthesis and interpretation of those interviews by the author. The list
of challenges below is unlikely to be complete, but the intention is to provide a window into the
unique challenges faced by Caltrans with the objective of a helping to create a more adaptable
and resilient California.
1. Dangerous roadways
a. All interviewees identified the risk that roadside work creates and emphasized
that this creates additional challenges in any vegetation management activities.
Concerns mentioned were that cars pass at high rates of speed and often do not
slow down for road workers.
b. Some counties or cities do not allow herbicide use and instead rely on manual
control methods causing employees to be along the roadside for longer periods
of time compared to herbicide application which is done primarily from spray
vehicles.
2. Hiring challenges and impacts
a. Landscape Specialists with a Pest Control Advisors license can make significantly
more money working in private industry.
b. There is no cost-of-living adjustment for Caltrans employees.
c. This causes some districts which when fully staffed would have 3 or 4 Landscape
Specialists creating the veg con plan to only have 1 or 2. In addition this creates a
situation where a single Landscape specialist can be advising the activities of
over 30 maintenance crews.
3. ROW mapping and prioritization
a. A GIS layer of the Caltrans ROW is not available. Some districts have created a
ROW map layer to help guide management efforts.
b. While maps of priority areas of high fire have recently become available there is
not a standard approach for how to incorporate these maps into the existing
vegetation control workflow.
4. Communication and accountability
a. Some interviewees expressed frustration with what they see as a lack of
communication between the Office of Roadside Management (ORM) and the
Office of Emergency Management (OEM) which have both overlapping and
independent directives regarding vegetation management.
b. Landscape Specialists operate in advisory roles only, and as such do not have the
direct authority to tell Maintenance Crews to go out at specific times to take
specific management actions. This has led in some cases to the hiring of third-
party contractors to manage certain areas when there is a breakdown of the
teamwork between Landscape Specialists and Crew Supervisors. In other cases,
the reliance on third parties has caused issues where trees which had been
marked for removal were not removed and subsequently fell onto the roadway
leading to injury or death.
15c. Communication with external partners also varies on a district-by-district basis.
Some districts are more engaged with outreach to local fire, county pest
management, and other agencies with similar vegetation management
objectives and knowledge.
d. Despite the PEIR stating that “annual district vegetation control plan and report,
would be available to the public and public agencies each year before Caltrans
takes actions to control vegetation” the process by which these are made
available is unknown. Upon viewing feedback from some local fire chiefs, this is
not occurring in all cases.
e. While initial efforts to use alternative vegetation control techniques were made
immediately after the PEIR, these have been severely limited due to logistical
constraints. Constraints include the previously mentioned lack of resources
(herbicide application is the cheapest method) and a desire to limit exposure to
roadway conditions.
5. Multiple Roles of ORM
a. Vegetation management is a small part of the ORM which has a wide range of
responsibility. This creates internal competition for scarce resources.
b. Vegetation control is a small fraction of the ORM budget, for illustration in 2020
the proposed budget for ORM was $2.4 billion while in 2018 the cost for non-
landscaped weed control was $36.9 million. This contrasts with the $115.2
million in litter in and debris removal in 2018 (Caltrans, 2020) and the nearly
$150 million in damages to state highway property and infrastructure in 2018
(Herby Lissade et al., 2019).
6. Climate Change/Drought/Invasive Species
a. While the PEIR states that “new information or changed circumstances would
warrant an additional environmental review” and that each district “document
annually whether each year's program continues to be consistent with the
selected program alternative” little incentive exists for such a determination.
b. There is no invasive species tracking and species-specific removal instructions
based on best available science.
c. Drought creates situations where herbicides are either not applied, as they need
a certain amount of rain after application to be effective or need to be applied in
all target areas in an extremely short window of time. This is critically important
to help reduce the risk of roadside ignition and spread, as happened in the Carr
fire of 2018.
Recommendations
As climate impacts are resulting in more severe fire conditions more resources are required to
ensure greater climate adaptation and resilience. Essential to these actions are improved
coordination between relevant stakeholders. Critically important is to include local fire agencies
input into the vegetation control plans. The annual district vegetation control plan and report
16You can also read