2019 COMMUNITY IMPACT REPORT - Impact Tulsa

Page created by Harvey Fields
 
CONTINUE READING
2019 COMMUNITY IMPACT REPORT - Impact Tulsa
T Y
                 T U        NI
         P   O R
     O P
TO

        2019 COMMUNI T Y IMPAC T REP OR T
2019 COMMUNITY IMPACT REPORT - Impact Tulsa
COMMUNITY PARTNERS
Attendance Works                                    Family & Children’s Services                Oklahoma State Department of Education            Tulsa Campaign to Prevent Teen Pregnancy
Birth Through Eight Strategy for Tulsa (BEST)       Family Connects                             The Opportunity Project                           Tulsa Changemakers
Bright Beginnings                                   Foundation for Tulsa Schools                OK to Grow                                        Tulsa City-County Health Department
CAP Tulsa                                           Growing Together                            OU-Tulsa Center of Applied Research               Tulsa City-County Library
Children First                                      Habitat for Humanity                        for Nonprofit Organizations                       Tulsa Community Foundation
City of Tulsa                                       Healthy Steps                               Parent-Child Center                               Tulsa Debate League
City Year                                           Hunger Free Oklahoma                        Power of Families                                 Tulsa Dream Center
Columbia University Center for                      Indian Nations Council of Governments       Project Lead the Way                              Tulsa Housing Authority
Public Research and Leadership                      (INCOG)                                     Reach Out and Read                                Tulsa Regional Chamber
Communities in Schools of Mid-America               JAMES Inc                                   Reading Partners                                  Tulsa Regional Stem Alliance
Community Service Council of Greater Tulsa          Little by Little                            Strong Tomorrows                                  Women in Recovery
Complete College America                            Metcares                                    Take Control Initiative                           YMCA of Greater Tulsa
Connect First                                       Metropolitan Baptist Church                 Teach for America                                 Youth Philanthropy Initiative (YPI)
Crosstown                                           My Health Access Network                    Teaching and Leading Initiative of Oklahoma       Youth Services of Tulsa
Educare                                             Neighbors Along the Line                    TRiO Program
Emergency Infant Services                           New Hope Oklahoma                           Tulsa Area United Way

                                                                                                                                              *Districts who have been partners since our founding
SCHOOL DISTRICT PARTNERS

                                                *                                           *                                      *
                                                                       BROKEN ARROW
                                                                       PUBLIC SCHOOLS
                                                                                EST. 1904

                                           ®

                                  *                                                                                                                                               *

             *                                       *                                 *                                                                *                                      *

POSTSECONDARY PARTNERS
2019 COMMUNITY IMPACT REPORT - Impact Tulsa
ENGLISH LANGUAGE ARTS    MATHEMATICS                COMPLETION                     ENROLLMENT
     PROFICIENCY         PROFICIENCY              COLLEGE & CAREER
                                                       READY

                                                       CONTENTS
                                                       LETTER FROM LEADERSHIP         2
                                                       ABOUT IMPACTTULSA              3
                                                       TULSA AREA DEMOGRAPHICS        4
                                                       EDUCATION OUTCOME AREA TRENDS 6
                                                       CHILD EQUITY INDEX             8
                                                       COUNTDOWN TO KINDERGARTEN      10
                                                       READY TO READ                  12
                                                       EIGHTH-GRADE MATHEMATICS       14
                                                       GRADUATE 918                   16
                 IMPACTTULSA USES DATA
                                                       CALL TO ACTION                 20
                 AS A FLASHLIGHT, NOT A HAMMER.
                                                       CITATIONS                      21

                                                                                                1
2019 COMMUNITY IMPACT REPORT - Impact Tulsa
LETTER FROM LEADERSHIP

    First Steps in Creating a Land of Opportunity
    Last year’s Community Impact Report declared an opportunity               going to reach their full potential, they also need stable housing,
    crisis. Groundbreaking research showed that too many Tulsans              wellness visits, dental checkups, reliable transportation, low-crime
    were economically “stuck in place” across generations and did not         neighborhoods, and more. Educators cannot change community
    participate in the American Dream as popularly conceived. We              conditions, and that’s where ImpactTulsa and its partners come in.
    learned a young African American child born to low-income parents
                                                                              The CEI measures neighborhood conditions using more than 40
    in Tulsa County in the 1980s had just a 1-in-26 chance of reaching
                                                                              indicators across a range of domains. It assesses how factors such
    an upper income group as a young adult. If that same child had been
                                                                              as —housing affordability, healthcare access, poverty rates, crime
    born in the 74120 zip code, those chances fell close to zero. The
                                                                              rates, unemployment rates—collectively impact student outcomes.
    economic mobility odds for low-income white, Native American, and
                                                                              The index uncovers systemic disparities across neighborhoods and
    Hispanic children were a little better, but still much too long. The
                                                                              points to areas ready for intervention. One area of the CEI work
    findings were eye-opening and unsettling.
                                                                              drilled down into the relationship between chronic absenteeism and
    This year, we transitioned from diagnosis to action.                      the ease of getting to school, including student walk distances, access
                                                                              to sidewalks, and transit availability. Collaborative Action Network
    In July, Tulsa was selected as one of just ten cities to participate in
                                                                              and strategy teams, facilitated by ImpactTulsa, are exploring how
    a new, national initiative aimed at improving economic mobility.
                                                                              improved transportation options, greater community supports, and
    Supported by leading foundations, the initiative provides access to
                                                                              addressing the barriers children living in certain neighborhoods face
    the experts behind the mobility research—led by Harvard University
                                                                              getting to school may contribute to better attendance—examples of
    economist Raj Chetty. Each participating city brings data, promising
                                                                              how cross-sector and community approaches are being tried to solve
    strategies, and shared learnings. For example, the City of Tulsa and
                                                                              problems in education. And it’s just the beginning.
    the Community Service Council’s Equality Indicators Initiative use
    data to measure progress toward equality across Tulsa’s zip codes         Establishing Tulsa as an authentic “land of opportunity” is a journey.
    and to better understand the landscape of opportunity and access          ImpactTulsa was designed for this work, and our founding principles
    throughout the city. ImpactTulsa and Tulsa Public Schools can also        will guide us: measure what matters, identify effective practices, and
    bring the Child Equity Index (CEI) work to the table to offer a focus     align resources. Our vision hasn’t changed, and we’ve enlisted some
    on improving opportunities specifically for children.                     remarkable partners during our six-year journey. We look forward
                                                                              to engaging in this nation-leading work and contributing to Tulsa’s
    Launched in 2018, the CEI operates under the theory that factors
                                                                              future of broadly shared prosperity.
    inside and outside the school building affect student outcomes.
    Yes, students need access to great educators, reasonable class sizes,
    aligned curriculum, and adequate learning time. But, if they are

                                Mayor GT Bynum                                                           Carlisha Williams Bradley, MPA
                                Chair, ImpactTulsa Leadership Council                                    Executive Director, ImpactTulsa

2
2019 COMMUNITY IMPACT REPORT - Impact Tulsa
ER

     IMPACTTULSA IS A COLLECTIVE IMPACT PARTNERSHIP THAT BRINGS TOGETHER SCHOOLS, BUSINESSES, FAITH-BASED GROUPS,
     COMMUNITY ORGANIZATIONS, PHILANTHROPY, AND GOVERNMENTAL AGENCIES TO SIGNIFICANTLY IMPROVE STUDENT OUTCOMES.

     THEORY OF ACTION
         When ImpactTulsa strives to:
                                                                                                       VISION
         Measure what matters                                                                          ALL STUDENTS ARE GUARANTEED A HIGH-QUALITY EDUCATION.
         to inform action,

         Identify effective practices
         to expand what works, and

         Align resources
                                                                                                       MISSION
         to drive change in policy and practice...                                                     IMPACTTULSA ALIGNS THE COMMUNITY TO PROVIDE A
                                                                                                       PATHWAY FOR ALL STUDENTS TO THRIVE.

       …then we will be a model of excellence that
         improves
      KINDERGARTEN
        KINDERGARTEN
        KINDERGARTEN
                    student
         KINDERGARTEN
          KINDERGARTEN
                             achievement EIGHTH-GRADE
                        THIRD-GRADE
                          THIRD-GRADE
                           THIRD-GRADE
                           THIRD-GRADE
                            THIRD-GRADE
                                          outcomes.
                                           EIGHTH-GRADE
                                            EIGHTH-GRADE
                                            EIGHTH-GRADE
                                             EIGHTH-GRADE                                  HIGH
                                                                                             HIGH
                                                                                             HIGH
                                                                                              HIGH
                                                                                               HIGH
                                                                                                 SCHOOL
                                                                                                   SCHOOL
                                                                                                    SCHOOL
                                                                                                    SCHOOL
                                                                                                     SCHOOL     POSTSECONDARY
                                                                                                                 POSTSECONDARY
                                                                                                                  POSTSECONDARY
                                                                                                                   POSTSECONDARY
                                                                                                                    POSTSECONDARY POSTSECONDARY
                                                                                                                                   POSTSECONDARY
                                                                                                                                    POSTSECONDARY
                                                                                                                                    POSTSECONDARY
                                                                                                                                     POSTSECONDARY
        READINESS
          READINESS
           READINESS
           READINESS
            READINESS        ENGLISH
                               ENGLISH
                                ENGLISH
                                ENGLISH
                                 ENGLISH
                                      LANGUAGE
                                        LANGUAGE
                                         LANGUAGE
                                         LANGUAGE
                                          LANGUAGE           MATHEMATICS
                                                              MATHEMATICS
                                                               MATHEMATICS
                                                               MATHEMATICS
                                                                 MATHEMATICS               COMPLETION
                                                                                             COMPLETION
                                                                                              COMPLETION
                                                                                              COMPLETION
                                                                                                COMPLETION        ENROLLMENT
                                                                                                                    ENROLLMENT
                                                                                                                     ENROLLMENT
                                                                                                                     ENROLLMENT
                                                                                                                      ENROLLMENT    COMPLETION
                                                                                                                                     COMPLETION
                                                                                                                                      COMPLETION
                                                                                                                                      COMPLETION
                                                                                                                                       COMPLETION
                             ARTS
                               ARTS
                                ARTS
                                 ARTS
                                  ARTS
                                   PROFICIENCY
                                     PROFICIENCY
                                      PROFICIENCY
                                      PROFICIENCY
                                       PROFICIENCY           PROFICIENCY
                                                               PROFICIENCY
                                                                PROFICIENCY
                                                                PROFICIENCY
                                                                 PROFICIENCY             COLLEGE
                                                                                          COLLEGE
                                                                                           COLLEGE
                                                                                           COLLEGE
                                                                                            COLLEGE
                                                                                                  & CAREER
                                                                                                    &&
                                                                                                     &CAREER
                                                                                                       &
                                                                                                       CAREER
                                                                                                        CAREER
                                                                                                         CAREER
                                                                                               READY
                                                                                                 READY
                                                                                                  READY
                                                                                                  READY
                                                                                                   READY

     OUTCOME AREAS OF FOCUS

      KINDERGARTEN
        KINDERGARTEN
        KINDERGARTEN
         KINDERGARTEN
          KINDERGARTEN    THIRD-GRADE
                            THIRD-GRADE
                             THIRD-GRADE
                              THIRD-GRADE
                               THIRD-GRADE      EIGHTH-GRADE
                                                   EIGHTH-GRADE
                                                     EIGHTH-GRADE
                                                  EIGHTH-GRADE
                                                   EIGHTH-GRADE                            HIGH
                                                                                             HIGH
                                                                                             HIGH
                                                                                              HIGH
                                                                                               HIGH
                                                                                                 SCHOOL
                                                                                                   SCHOOL
                                                                                                    SCHOOL
                                                                                                    SCHOOL
                                                                                                     SCHOOL        POSTSECONDARY
                                                                                                                POSTSECONDARY
                                                                                                                   POSTSECONDARY
                                                                                                                 POSTSECONDARY      POSTSECONDARY
                                                                                                                    POSTSECONDARY POSTSECONDARY
                                                                                                                                     POSTSECONDARY
                                                                                                                                      POSTSECONDARY
                                                                                                                                   POSTSECONDARY
            READINESSENGLISH
        READINESS
          READINESS
           READINESS
           READINESS   ENGLISH
                        ENGLISH
                        ENGLISH
                         ENGLISH
                              LANGUAGE
                                LANGUAGE
                                 LANGUAGE
                                 LANGUAGE
                                  LANGUAGE
                                        ARTS
                                          ARTS
                                           ARTS
                                           ARTS
                                            ARTSMATHEMATICS
                                                   MATHEMATICS
                                                     MATHEMATICS
                                                  MATHEMATICS
                                                   MATHEMATICS                             COMPLETION
                                                                                             COMPLETION
                                                                                              COMPLETION
                                                                                              COMPLETION
                                                                                                COMPLETION           ENROLLMENT
                                                                                                                  ENROLLMENT
                                                                                                                     ENROLLMENT
                                                                                                                      ENROLLMENT
                                                                                                                    ENROLLMENT         COMPLETION
                                                                                                                                    COMPLETION
                                                                                                                                       COMPLETION
                                                                                                                                        COMPLETION
                                                                                                                                      COMPLETION
                           PROFICIENCY
                             PROFICIENCY
                              PROFICIENCY
                              PROFICIENCY
                               PROFICIENCY       PROFICIENCY
                                                    PROFICIENCY
                                                      PROFICIENCY
                                                   PROFICIENCY
                                                    PROFICIENCY                          COLLEGE
                                                                                          COLLEGE
                                                                                           COLLEGE
                                                                                           COLLEGE
                                                                                            COLLEGE
                                                                                                  & CAREER
                                                                                                    &&
                                                                                                     &CAREER
                                                                                                       &
                                                                                                       CAREER
                                                                                                        CAREER
                                                                                                         CAREER
                                                                                               READY
                                                                                                 READY
                                                                                                  READY
                                                                                                  READY
                                                                                                   READY

                                     StriveTogether is a national, nonprofit network of 67 community
      KINDERGARTEN
        KINDERGARTEN
        KINDERGARTEN
         KINDERGARTEN
          KINDERGARTEN          partnerships. The network’s
                          THIRD-GRADE
                            THIRD-GRADE
                             THIRD-GRADE
                              THIRD-GRADE
                               THIRD-GRADE                   mission
                                                         EIGHTH-GRADE is to build the capacityHIGH
                                                             EIGHTH-GRADE
                                                              EIGHTH-GRADE
                                                               EIGHTH-GRADE
                                                                EIGHTH-GRADE                   ofHIGH
                                                                                                 HIGH
                                                                                                  HIGH
                                                                                                    HIGH
                                                                                                      SCHOOL
                                                                                                        SCHOOL
                                                                                                         SCHOOL
                                                                                                         SCHOOL
                                                                                                          SCHOOL     POSTSECONDARY
                                                                                                                      POSTSECONDARY
                                                                                                                       POSTSECONDARY
                                                                                                                        POSTSECONDARY
                                                                                                                         POSTSECONDARY      SECONDARY
                                                                                                                                              SECONDARY
                                                                                                                                               SECONDARY
                                                                                                                                               SECONDARY
                                                                                                                                                SECONDARY
            READINESSENGLISH
        READINESS
          READINESS
           READINESS
           READINESS   ENGLISH
                        ENGLISH
                        ENGLISH
                         ENGLISHcommunities
                              LANGUAGE
                                LANGUAGE
                                 LANGUAGE
                                  LANGUAGE
                                   LANGUAGE    to
                                              ARTSdramatically
                                                 ARTS
                                                  ARTS
                                                   ARTS        improve
                                                    ARTSMATHEMATICS
                                                             MATHEMATICS
                                                              MATHEMATICSeducational
                                                               MATHEMATICS
                                                                MATHEMATICS           outcomes   for
                                                                                              COMPLETION
                                                                                                 COMPLETION
                                                                                                  COMPLETION
                                                                                                   COMPLETION
                                                                                                     COMPLETION        ENROLLMENT
                                                                                                                         ENROLLMENT
                                                                                                                          ENROLLMENT
                                                                                                                          ENROLLMENT
                                                                                                                           ENROLLMENT       COMPLETION
                                                                                                                                             COMPLETION
                                                                                                                                              COMPLETION
                                                                                                                                               COMPLETION
                                                                                                                                                COMPLETION
                                every child from cradle to PROFICIENCY
                           PROFICIENCY
                             PROFICIENCY
                              PROFICIENCY
                              PROFICIENCY
                               PROFICIENCY                 career by providing strategicCOLLEGE
                                                              PROFICIENCY
                                                               PROFICIENCY
                                                                PROFICIENCY
                                                                 PROFICIENCY              assistance,
                                                                                            COLLEGE
                                                                                             COLLEGE
                                                                                              COLLEGE
                                                                                               COLLEGE & CAREER
                                                                                                         &&
                                                                                                          &CAREER
                                                                                                            &
                                                                                                            CAREER
                                                                                                             CAREER
                                                                                                              CAREER
                                network communications and high-quality resources.                 READY
                                                                                                      READY
                                                                                                       READY
                                                                                                       READY
                                                                                                        READY

                                                                                                                                                               3
2019 COMMUNITY IMPACT REPORT - Impact Tulsa
Tulsa Area Demographics
                                                                                                                                                                               4

                                                                                                                                                                                                                                SKIATOOK                         COLLINSVILLE

                                                                                                                                                                                                                                     SPERRY

                                                                                                                                                                                                                                                                       OWASSO

                  2018 TOTAL POPULATION                                                                                                                                                               SCHOOL DISTRICTS

                  648,360
                  4.2% GROWTH SINCE 2013
                                                                                                                                                                                                      TULSA COUNTY
                                                                                                                                                                                                      CITY OF TULSA

                                                                                                                                                                                                   SAND SPRINGS
                                                                                                                                                                                                                               BERRYHILL                   TULSA
                                                                                                                                                                                   KEYSTONE
                  2018 PRE-K – 12 STUDENTS
                  IN TULSA COUNTY AND SAPULPA                                                                                                                                                                                                                            UNION                  BROKEN

                  128,801
                  4% GROWTH SINCE 2013                                                                                                                                                                                                               JENKS
                                                                                                                                                                                                                                                                                                ARROW

                                                                                                                                                                                                                        SAPULPA

                  STUDENTS ENROLLED IN PUBLIC SCHOOL
                                                                                                                                                                                                                                               GLENPOOL
                  84.4%
                                                                                                                                                                                                                SAPULPA SCHOOL DISTRICT IS
                                                                                                                                                                                                          INCLUDED IN STUDENT PROFILE, BUT
                                                                                                                                                                                                           NOT INCLUDED IN COUNTY DETAILS
                                                                                                                                                                                                                                                                   BIXBY
                  1.4% DECLINE SINCE 2013

                                                                                                                                                                                                                                                    LIBERTY
                  RESIDENTS OF TULSA COUNTY ATTENDING
                  A POSTSECONDARY INSTITUTION:
                  37,433
                  1.3% DECLINE SINCE 2013

                                                                                                                                                     Tulsa’s population grew by four percent between 2013 and 2018, with the majority of growth coming
                  TULSA COUNTY 18-24 YEAR OLDS                                                                                                       from populations of color. Asian, Hispanic, and Native American populations all grew by double-digit
                  ENROLLED AT A POSTSECONDARY INSTITUTION                                                                                            percentages during this period, while the African American population grew by nine percent. The
                  18,631                                                                                                                             changing demographics of the region become apparent when looking at the distribution of race and
                  4.7% GROWTH SINCE 2013                                                                                                             ethnicity by age. Children of color make up over half of the population under age five; while less than
                                                                                                                                                     one in four adults 45 or older are of color.

    TULSA COUNTY DEMOGRAPHIC BREAKDOWN                                                                                                                                    DEMOGRAPHIC MAKEUP
                                                                                                                                                                                                          TOTAL POPULATION
                                                                                                                                                                                                 100%
                                                  399,279 398,093                                                                                          147%
                   % PROFICIENT OR ADVANCED

     2013

     2018
                                                                                                                                                                                                   50%

                                                                                                    41%
                                                                                                                    72,012 84,287
                                                                60,335 65,484        17%                                17%         48,283 46,034
                                                        0%
                                                                      9%
                                                                                26,066 30,473 15,646 22,044                             -5%                          0%
                                                                                                                                                         788 1,945
                                              0                                                                                                                                                      0%
                                                                                                                                                                                                           COUNTY       CITY         UNDER 5   5-14 15-24 25-34 35-44 45-54 55-64 65-74 75-84   8+
                                                                                                                                       MULTIRACIAL
                                                       WHITE

                                                                     AFRICAN
                                                                    AMERICAN

                                                                                     NATIVE
                                                                                   AMERICAN

                                                                                                           ASIAN/
                                                                                                PACIFIC ISLANDER

                                                                                                                       HISPANIC

                                                                                                                                                          OTHER

                                                                                                                                                                                                           (NON-CITY)

                                                                                                                                                                                   MULTIRACIAL                8%         7%            11%     10%   10%   7%    13%    10%   4%    6%    5%    2%
                                                                                                                                                                                    HISPANIC                  7%        17%            20%     21%   18%   14%    7%    6%    6%    2%    1%    0%
                                                                                                                                                                            ASIAN/PACIFIC ISLANDER            4%         3%            4%      3%     4%   5%     4%    3%    2%    2%    0%    0%
                                                                                                                                                                              NATIVE AMERICAN                 6%         4%            4%      6%     6%   6%     6%    5%    5%    4%    3%    1%
    2013 PERCENT OF POPULATION                          64%          10%             4%               3%                12%               8%                0%                AFRICAN AMERICAN                1%        16%            12%     12%   12%   11%    9%    10%   9%    7%    6%    3%
    2018 PERCENT OF POPULATION                          61%          10%             5%               3%                13%               7%                0%              WHITE (NON-HISPANIC)             75%        53%            48%     47%   50%   58%   60%    66%   74%   79%   85%   93%

4
2019 COMMUNITY IMPACT REPORT - Impact Tulsa
EDUCATION AND UNEMPLOYMENT                                                                                                                             EDUCATIONAL ATTAINMENT FOR ADULTS OVER 25,
                                                                                                                                                       TULSA COUNTY
                                                   PERCENT OF INDIVIDUALS                   MEDIAN                             UNEMPLOYMENT
                                                        IN CATEGORY                         INCOME                              PERCENTAGE                                                                        HIGH SCHOOL DIPLOMA
                                                                                                                                                                                                                        OR EQUIVALENCY                                         89.0%
                                                                       32%                  $58,244 COUNTY (NON-CITY)                   1%
     BACHELOR’S DEGREE
            OR HIGHER                                                                       $51,849 CITY                                2%
                                                                       32%                                                                                                                                               SOME COLLEGE OR
                                                                                                                                                                                                                       ASSOCIATE’S DEGREE                                      64.1%
                                                                           35%              $40,164 COUNTY (NON-CITY)                   4%
          SOME COLLEGE                                                                                                                                                                                                   BACHELOR’S DEGREE
   OR ASSOCIATES DEGREE                                                                                                                                                                                                          OR HIGHER                                     31.6%
                                                                        33%                 $31,707 CITY                                6%
                                                                                                                                                        94%                                                                                            92%
                                                                  26%                       $34,805 COUNTY (NON-CITY)                   6%                           90%                  89%
 HIGH SCHOOL GRADUATE
         OR EQUIVALENT                                            26%                       $28,266 CITY                                4%                                                                       78%

                                                                                                                                                                                                                                       65%                                  HIGH SCHOOL DEGREE
                                                         7%                                 $28,715 COUNTY (NON-CITY)                   1%                                                                                                                                  OR HIGHER
             LESS THAN
    HIGH SCHOOL DEGREE                                   10%                                $23,951 CITY                                9%                                                                                43%                                               BACHELOR’S DEGREE
                                                                                                                                                              37%                                                                                                           OR HIGHER
                                                                                                                                                                                                                                                               28%

                                                                                                                                                                                17%                19%
                                                                                                                                                                                                                                               13%

                                                                                                                                                                                                                                                         MULTIRACIAL
                                                                                                                                                         WHITE

                                                                                                                                                                       AFRICAN AMERICAN

                                                                                                                                                                                          NATIVE AMERICAN

                                                                                                                                                                                                                            ASIAN/
                                                                                                                                                                                                                 PACIFIC ISLANDER

                                                                                                                                                                                                                                         HISPANIC
OKLAHOMA EMERGENCY TEACHER
CERTIFICATIONS, TULSA-AREA ONLY
(OUR 15 SCHOOL DISTRICTS)

2016-2017                 150

2017-2018                                         353

2018-2019                                                           504*                                                       Salaries of instructional staff in Oklahoma increased by 13 percent between 2017-18 and
                                                                                                                               2018-2019, boosting the state from 49th among the states and the District of Columbia to
2019-2020                                         347
                                                                                                                               36th.3 The increase in compensation recognizes the vital role played by teachers. Work remains
            *ESTIMATE THROUGH DECEMBER OF 2018
                                                                                                                               to bring total funding into line: expenditures per student increased a mere 3.3 percent during
                                                                                                                               the same period.

                                                                                                                                                                    KANSAS
EDUCATION FUNDING                                                                                                                                                   Average Teacher       Expenditures               Students
COMPARISONS, 2018                                                                                  OKLAHOMA                                                         Salary                Per Student                Per Teacher

                                                                                                   Average Teacher     Expenditures    Students
                                                                                                                                                                    $49,800               $11,705                    Rank 16
                                                                                                                                                                                                                                                MISSOURI
                                                                                                   Salary              Per Student     Per Teacher                  Rank 46
                                                                                                                                                                                                NAEP RANK
                                                                                                                                                                                                                                                Average Teacher        Expenditures      Students
                                COLORADO                                                            4                  $8,449          Rank 39                                                  ELA         30     MATH       24                Salary                 Per Student       Per Teacher

                                Average Teacher    Expenditures        Students                                          NAEP RANK                                                                                                              $50,064                $11,434           Rank 5
                                Salary             Per Student         Per Teacher                                       ELA   41     MATH   38                                                                                                 Rank 44
                                                                                                                                                                                                                                                                         NAEP RANK
                                $53,301            $11,490             Rank 37                                                                                                                                                                                           ELA   34     MATH    26
                                Rank 32
                                                       NAEP RANK
                                                       ELA    5     MATH     19
                                                                                                                                                                                                                                     ARKANSAS
                                                                                                                                                                                                                                     Average Teacher    Expenditures       Students
                                                                                                                                                                                                                                     Salary             Per Student        Per Teacher
                      NEW MEXICO
                                                                                                                                                                                                                                     $51,019            $10,082            Rank 30
                      Average Teacher     Expenditures       Students                                                                                                                                                                Rank 37
                      Salary              Per Student        Per Teacher                                                                                                                                                                                   NAEP RANK
                      $47,826             $11,012            Rank 33                                                                                                                                                                                       ELA    45      MATH   43
                      Rank 49
                                            NAEP RANK                          TEXAS
                                            ELA   50     MATH     50
                                                                               Average Teacher
                                                                               Salary
                                                                                                 Expenditures
                                                                                                 Per Student
                                                                                                                 Students
                                                                                                                 Per Teacher
                                                                                                                                                                                                                     UNITED STATES
                                                                                                                                                                                                                     Average Teacher                Expenditures
                                                                               $54,155           $10,096         Rank 24                                                                                             Salary                         Per Student
                                                                               Rank 27
                                                                                                   NAEP RANK                                                                                                         $61,730                        $12,920
                                                                                                   ELA   42     MATH   32

                                                                                                                                                                                                                                                                                                       5
2019 COMMUNITY IMPACT REPORT - Impact Tulsa
Education Outcome Area Trends

                                                             PRE-K                            THIRD-GRADE                 EIGHTH-GRADE                  HIGH SCHOOL                  FAFSA                            IN-STATE COLLEGE
                                                             ENROLLMENT                       READING                     MATH                          GRADUATION                   COMPLETION                       ENROLLMENT
                                                                                                                                                                                     (THROUGH JULY 31)

                                                             Percent equals the prior         Percent of students         Percent of students           Percent of students          Percent of students              Percent of high school
                                                             year pre-K enrollment            meeting OSTP proficiency    meeting OSTP                  graduating high school       completing the Free              graduates attending
                                                             total over the current           standards for reading.      proficiency standards         within four years.           Application for Federal          Oklahoma colleges
                                                             year kindergarten                                            for math.                                                  Student Aid (FAFSA).             and universities.
                                                             enrollment total.

                                                                          A
                                                                          B
                                                  +8

                                                                          C
                                                                   PRIOR PRE-K
                                                                   ENROLLMENT
                                                  +6
                                                  +4
    PERCENTAGE POINT IMPROVEMENT SINCE BASELINE

                                                  +2

                                                                                                   KINDERGARTEN       THIRD-GRADE        EIGHTH-GRADE
                                                                                                                                         KINDERGARTEN       THIRD-GRADE
                                                                                                                                                             HIGH SCHOOL         EIGHTH-GRADE
                                                                                                                                                                                 POSTSECONDARY       HIGH SCHOOL
                                                                                                                                                                                                    POSTSECONDARY         POSTSECONDARY        POSTSECONDARY
                                                                                                     READINESS      ENGLISH LANGUAGE     MATHEMATICS
                                                                                                                                           READINESS      ENGLISH LANGUAGE
                                                                                                                                                             COMPLETION          MATHEMATICS
                                                                                                                                                                                   ENROLLMENT        COMPLETION
                                                                                                                                                                                                      COMPLETION            ENROLLMENT           COMPLETION
                                                                                                                    ARTS PROFICIENCY      PROFICIENCY     ARTS PROFICIENCY
                                                                                                                                                           COLLEGE & CAREER       PROFICIENCY      COLLEGE & CAREER
                                                  BASELINE

                                                                                                                                                                READY                                   READY

                                                                                           KINDERGARTEN        THIRD-GRADE         EIGHTH-GRADE         HIGH SCHOOL       POSTSECONDARY    POSTSECONDARY
                                                                                 KINDERGARTEN        THIRD-GRADE         EIGHTH-GRADE         HIGH SCHOOL        POSTSECONDARY    POSTSECONDARYFAFSA
                                                                                             READINESS       ENGLISH LANGUAGE      MATHEMATICS           COMPLETION         ENROLLMENT        COMPLETION
                                                                                                                                                                                             COMPLETION
                                                  -2

                                                                                   READINESS      ENGLISH LANGUAGE       MATHEMATICS          COMPLETION           ENROLLMENT       COMPLETION
                                                                                                             ARTS PROFICIENCY       PROFICIENCY       COLLEGE & CAREER
                                                                                                  ARTS PROFICIENCY        PROFICIENCY       COLLEGE & CAREER
                                                                                                                                                           READY
                                                                                                                                                 READY
                                                  -4

                                                                                                   KINDERGARTEN      THIRD-GRADE         EIGHTH-GRADE
                                                                                                                                         KINDERGARTEN      THIRD-GRADE
                                                                                                                                                            HIGH SCHOOL          EIGHTH-GRADE
                                                                                                                                                                                 POSTSECONDARY       HIGH SCHOOL
                                                                                                                                                                                                    POSTSECONDARY         POSTSECONDARY        POSTSECONDARY
                                                                                                     READINESS  ENGLISH LANGUAGE ARTS    MATHEMATICS
                                                                                                                                           READINESS  ENGLISH LANGUAGE ARTS
                                                                                                                                                            COMPLETION           MATHEMATICS
                                                                                                                                                                                   ENROLLMENT        COMPLETION
                                                                                                                                                                                                      COMPLETION            ENROLLMENT           COMPLETION
                                                                                                                     PROFICIENCY          PROFICIENCY      PROFICIENCY
                                                                                                                                                         COLLEGE  & CAREER        PROFICIENCY      COLLEGE & CAREER
                                                                                                                                                               READY                                    READY
                                                  -6

                                                                                           KINDERGARTEN        THIRD-GRADE        EIGHTH-GRADE         HIGH SCHOOL       POSTSECONDARY     POSTSECONDARY
                                                                                 KINDERGARTEN        THIRD-GRADE        EIGHTH-GRADE         HIGH SCHOOL        POSTSECONDARY     POSTSECONDARY
                                                                                             READINESS    ENGLISH LANGUAGE ARTS   MATHEMATICS           COMPLETION         ENROLLMENT        COMPLETION
                                                                                   READINESS    ENGLISH LANGUAGE ARTS   MATHEMATICS          COMPLETION           ENROLLMENT        COMPLETION
                                                                                                               PROFICIENCY         PROFICIENCY       COLLEGE & CAREER
                                                                                                     PROFICIENCY         PROFICIENCY       COLLEGE & CAREER
                                                                                                                                                          READY
                                                                                                                                                READY

                                                                                                   KINDERGARTEN      THIRD-GRADE         EIGHTH-GRADE
                                                                                                                                         KINDERGARTEN      THIRD-GRADE
                                                                                                                                                            HIGH SCHOOL          EIGHTH-GRADE
                                                                                                                                                                                 POSTSECONDARY       HIGH SCHOOL
                                                                                                                                                                                                      SECONDARY           POSTSECONDARY         SECONDARY
                                                                                                     READINESS  ENGLISH LANGUAGE ARTS    MATHEMATICS
                                                                                                                                           READINESS  ENGLISH LANGUAGE ARTS
                                                                                                                                                            COMPLETION           MATHEMATICS
                                                                                                                                                                                   ENROLLMENT        COMPLETION
                                                                                                                                                                                                      COMPLETION            ENROLLMENT          COMPLETION
                                                  CURRENT

                                                                     73%                              36%            PROFICIENCY
                                                                                                                                  23%     PROFICIENCY
                                                                                                                                                               85%
                                                                                                                                                           PROFICIENCY
                                                                                                                                                         COLLEGE  & CAREER
                                                                                                                                                               READY
                                                                                                                                                                                  PROFICIENCY
                                                                                                                                                                                              58%  COLLEGE & CAREER
                                                                                                                                                                                                        READY
                                                                                                                                                                                                                              53%
                                                                     2018-2019                       2018-2019                    2018-2019                    2018-2019                     2018-2019                       2018-2019

                                                                                         KINDERGARTEN         THIRD-GRADE        EIGHTH-GRADE          HIGH SCHOOL       POSTSECONDARY       SECONDARY
                                                                               KINDERGARTEN        THIRD-GRADE         EIGHTH-GRADE          HIGH SCHOOL
                                                  BASELINE

                                                                                                                                                                POSTSECONDARY       SECONDARY
                                                                     65%         READINESS
                                                                                           READINESS
                                                                                                      36%
                                                                                                        ENGLISH LANGUAGE ARTS
                                                                                              ENGLISH LANGUAGE ARTS    MATHEMATICS
                                                                                                              PROFICIENCY         23%
                                                                                                                                 MATHEMATICS
                                                                                                                                  PROFICIENCY
                                                                                                                                             COMPLETION        81%
                                                                                                                                                       COMPLETION          ENROLLMENT
                                                                                                                                                                  ENROLLMENT
                                                                                                                                                     COLLEGE & CAREER                         58%
                                                                                                                                                                                            COMPLETION
                                                                                                                                                                                   COMPLETION                                 57%
                                                                     2013-2014                      2016-2017
                                                                                                   PROFICIENCY          PROFICIENCY
                                                                                                                                   2016-2017
                                                                                                                                          COLLEGE & CAREER
                                                                                                                                                          READY 2013-2014                    2014-2015                       2013-2014
                                                                                                                                                READY

6
2019 COMMUNITY IMPACT REPORT - Impact Tulsa
TRENDS AND GOALS
We’ve reached the point in our journey where we have locked down        Bottomline on performance: more young Tulsans are starting
the key indicators, measured them consistently over time, and can       education early (pre-K) and persisting through high school.
track progress and setbacks. We find good news early and late in        Achievement is stubbornly stable, and nationally college-going
the continuum. The eight-percentage point improvement in pre-           is competing with job opportunities in an unprecedented
kindergarten enrollment over five years may be the best news in this    economic expansion.
report. That translates to 814 more attendees in 2018-19 than if the
                                                                        Trend tracking usually marks the end of the report. But this year we
participation rates of 2013-14 had persisted. The community should
                                                                        take an additional step—extending from “what is” to “what should
also take pride in the steadily improving high school graduation
                                                                        be”. ImpactTulsa convened goal setting sessions. We set out to
rate—up two percentage points from last year and four percentage
                                                                        create goals that were: ambitious but achievable, actionable, time-
points since the 2013-14 benchmark year. That’s progress.
                                                                        limited, and equitable (that is, no gaps based on race, ethnicity, or
Last year’s report showed declines in the two indicators tied to        income). These are just first steps with additional goals to be made.
standardized testing—3rd grade English Language Arts (ELA) and 8th      We recognize there are many factors that go into reaching these goals
grade math. ELA and math proficiency rates returned to their 2016-17    and there’s a lot of work that goes into moving outcomes. However, if
levels—36 percent and 23 percent, respectively. It’s a relief to know   Tulsa is going to achieve world-class status, our community will need
the declines recovered but disappointing we do not have progress to     to come together to reach these goals and press on to higher levels.
report—especially in math given the low levels of proficiency.

Performance on the college-related indicators—FAFSA and in-state
postsecondary enrollment—are flat or slightly down. Nationally, an
extended economic expansion—now the longest in U.S. history—
provides attractive opportunities outside of education. This could be
one of many contributors to the college-related trends. No one looks
forward to a recession, but when one inevitably arrives, we expect
college-going rates to edge up.

This year’s report is missing a Kindergarten readiness indicator.
Districts deploy a variety of assessments built on competing methods.
Aggregating outcomes across these loosely related tests does not
yield the most reliable regionwide analysis. Some simplification and
standardization of these assessments would be a productive
step forward.

                                                                                                                                                7
2019 COMMUNITY IMPACT REPORT - Impact Tulsa
LEARNING HOW NEIGHBORHOOD FACTORS
    The Child Equity Index                                                                                          AFFECT STUDENT SUCCESS

    During 2018, ImpactTulsa worked in collaboration with Tulsa Public                                             health, neighborhood socioeconomic status (SES), neighborhood
    Schools and ECONorthwest to develop a Child Equity Index (CEI).                                                safety, neighborhood pride and custodianship, and neighborhood
                                                                                                                   access. The tool measures the collective impact of these factors and
    The CEI is a data-driven tool and resource for Tulsa area school
                                                                                                                   conditions on student outcomes.
    districts and community partners to understand student need with
    consideration given to student residential environments.                                                       The “place-based” measures are attached to student addresses and
                                                                                                                   residential environments using data captured at the census tract and
    The CEI measures student factors and neighborhood conditions, using
                                                                                                                   zip code geographic boundaries.
    more than 40 indicators across six domains of influence (see figure
    below, Domains of Influence) —student-level factors, neighborhood

    DOMAINS OF INFLUENCE                                                                                               The index scores produced by the model help us understand
                                                                                                                       the geographic landscape of access and opportunity. The map
    The subdomains help us target and align resources based on
    different type of needs for both students and neighborhoods.                                                       below illustrates the relationship between overall neighborhood
                                                                                                                       conditions and their contribution to academic outcomes for the
                                                                                                                       students that live there. For instance, the blue-shaded census
    1   STUDENT LEVEL DOMAIN
                                                                                                                       tracts represent areas with above-median (and more favorable)
        Gender                    Economic Disadvantage
        Race/Ethnicity            Homeless                                                                             contributions to student academic outcomes, whereas the orange-
        ELL                       Special Alert (i.e. medical)
        Student Mobility          EBL
                                                                                                                       shaded census tracts represent the areas with below-median (and
        Attended Pre-K            Suspensions                                                                          less favorable) contributions. With the ability to look at how each
                                                    2      NEIGHBORHOOD HEALTH                                         individual domain contributes to the overall index, this information
                                                          Built Environment Score Infant Mortality Rate                provides the ability to identify types of interventions needed to help
                                                          Life Expectancy         Teen Pregnancy
                                                          Mental Health/          Low Birth Weight                     close opportunity gaps and to overcome barriers to student success.
                                                          Substance Abuse Visits
                                                          ER Visits

    3   NEIGHBORHOOD SES                                                                                              OVERALL DOMAIN SCORES AGGREGATED BY CENSUS TRACT
        % of Population with      Receipt of SNAP
        Less than a High School   (Food Stamps)
        Education                 Housing Cost
        % of Pop below 100% FPL   Burdened
        % of Pop below 200% FPL   Housing Quality
        Unemployment Rate         and Condition                                                                                                                                                                                                  66th St N

                                                    4      NEIGHBORHOOD SAFETY
                                                                                                                                                                                   SUBURBAN
                                                                                                                                                                                     HILLS                                                                    56th St N                                                   56th St N                                          SIGNIFICANTLY ABOV
                                                                                                                                                                                                                                   75
                                                                                                                                                                                                                                                                                                                                     169                                     SLIGHTLY ABOVE ME
                                                          Violent Crime            Gun-related Mortality                                                                                                                                                                                       Mohawk Park                 Port Rd                                           SLIGHTLY BELOW ME
                                                          (aggravated assault,     Arrests
                                                          homicide, rape, robbery)                                                                                                                                                                                                                                                                                           SIGNIFICANTLY BELO
                                                                                                                                                                                                                                                                                                                          36th St N
                                                          Narcotics crime
                                                                                                                                                                                                                                                                                                   TULSA                                   Apache St.
                                                                                                                                                                                                                                                                                               INTERNATIONAL
                                                                                                                                                                                                                                                                                                  AIRPORT

    5    NEIGHBORHOOD CUSTODIANSHIP                                                                                                                      GILCREASE HILLS                               75                                                                                                                 Pine St S

                                                                                                                                                                                     UNIVERSITY
        Nuisance/311 Complaints                                                                                                                                                         PARK                                  KENDALL-
                                                                                                                                                                                                                              WHITTIER                                                                                                 Admiral Pl                     44
                                                                                                                                          412                                         GREENWOOD                                                     244

        Negative land use                                                                                                                                          64
                                                                                                                                                                              DOWNTOWN PEARL
                                                                                                                                                                                                                                                                                                                                                S. Garnett Ave

                                                                                                                                                                                                                                                                                                                                                                 11th St S
        Built Environment
                                                                                                                                                                                                                                                                             Sheridan Rd

                                                                                                                                                                                                                                                                                                   Memorial Dr

                                                                                                                                                                                                                                                                      MID
        Nuisance                                                                                                                                                                                                                                                     TULSA                                       MINGO
                                                                                                                                                                                                      Utica Ave

                                                                                                                                                                                                                                                                                                                 VALLEY
                                                                                                                                                                           RIVER                                                                                                                                                                                 21st St S
                                                                                                                                                                           WEST
                                                                                                                                                                                                                                   Harvard Ave
                                                                                                                                                                                              Peoria Ave

                                                                                                                                                                                                                  Lewis Ave

                                                                                                                                                                                                                                                          Yale Ave

                                                                                                                                                                      75                                                                                                                                                    169
                                                                                                                                                                                                                                                   64
                                                                                                                                                                                                                                                                                       31st St S
                                                    6      NEIGHBORHOOD ACCESS
                                                                                                                                                                                                                                                                                                   51
                                                                                                                                                                           66th St N                                                                                                       41st St S
                                                          Walkscore               Industrial/Oil Land Site
                                                                                                                                                                                                                                             PATRICK
                                                          Transit                 Highway
                                                                                                                                      SUBURBAN
                                                                                                                                        HILLS                                         56th St N                                               HENRY
                                                                                                                                                                                                                                             56th St N                                                                    SIGNIFICANTLY ABOVE MEDIAN
                                                                                                                                                                                                                                                                                           51st St S
                                                                                                                                                e
                                                                                                                                            npik

                                                                                                                                                                                                            44
                                                          Grocery Stores          Parks, Trails, Schools                                                                                                                                                                                                                  SLIGHTLY ABOVE MEDIAN
                                                                                                                                                                                                                                                          169
                                                                                                                                         Tur

                                                                                                                                                            WEST 75 75                               HELLER
                                                                                                                                       ner

                                                                                                                                                          HIGHLANDS                                   PARK LAFORTUNE Port Rd
                                                                                                                                                                                                                                                                                                                          SLIGHTLY BELOW MEDIAN
                                                          Vehicle Access
                                                                                                                                      Tur

                                                                                                                                                                                                       Mohawk Park
                                                                                                                                                                                                              PLAZA
                                                                                                                                                                                                   HOPE
                                                                                                                                                                                                                                                                                           61st St S
                                                                                                                                                                                                  VALLEY                                                                                                                  SIGNIFICANTLY BELOW MEDIAN
                                                                                                                                                                                                                     36th St N
                                                                                                                                                                                                                                                                             71st St S
                                                                                                                                                                                                                 TULSA                                          Apache St.
                                                                                                                                                                                                             INTERNATIONAL
8                                                                                                                                                                                                               AIRPORT

                                                                                                                    GILCREASE HILLS                 75                                                                                       Pine St S

                                                                                                                                      UNIVERSITY
                                                                                                                                         PARK                 KENDALL-
                                                                                                                                                              WHITTIER                                                                                       Admiral Pl                       44
                                                                                                             412                       GREENWOOD                               244
STUDENT CHRONIC ABSENTEEISM
                                                                                                                                                                  66th St N

            One interesting example of how                                                              SUBURBAN
                                                                                                          HILLS                                                                56th St N                                                 56th St N
            this data can be used is looking                                                                                                        75
                                                                                                                                                                                                                                                   169

                                                                                                                                                                                                               Mohawk Park               Port Rd
            at where chronic absenteeism
            rates are highest across our city.                                                                                                                                                                                           36th St N

            Community partners, teams of
                                                                                                                                                                                                                    TULSA                                Apache St.
            leaders from Tulsa Public Schools,                                                                                                                                                                  INTERNATIONAL
                                                                                                                                                                                                                   AIRPORT

            ImpactTulsa and the City of Tulsa                                   GILCREASE HILLS                         75                                                                                                               Pine St S

            are already exploring areas for                                                             UNIVERSITY
                                                                                                           PARK                                KENDALL-                                                                                              Admiral Pl                     44
            collaboration and key investments                         412
                                                                                          64
                                                                                                         GREENWOOD                             WHITTIER              244

                                                                                                   DOWNTOWN PEARL

                                                                                                                                                                                                                                                              S. Garnett Ave
                                                                                                                                                                                                                                                                               11th St S
            that can be made in neighborhoods

                                                                                                                                                                                              Sheridan Rd

                                                                                                                                                                                                                  Memorial Dr
                                                                                                                                                                                       MID
                                                                                                                                                                                      TULSA                                     MINGO
            to improve school attendance and

                                                                                                                       Utica Ave
                                                                                                                                                                                                                                VALLEY
                                                                                                RIVER                                                                                                                                                                          21st St S
                                                                                                WEST

                                                                                                                                                    Harvard Ave
                                                                                                               Peoria Ave
            in turn student outcomes.

                                                                                                                                   Lewis Ave

                                                                                                                                                                           Yale Ave
                                                                                           75                                                                                                                                              169
                                                                                                                                                                    64
                                                                                                                                                                                                        31st St S

                                                                                                                                                                                                                  51
                                                                                                                                                                                                            41st St S
                                                                                                                                                                  PATRICK
                                                                                                                                                                   HENRY
                                                                                                                                                                                                            51st St S
                                                                            e
                                                                       npik

                                                                                                                             44
                                                                      Tur

                                                                                    WEST 75                           HELLER
                                                                     ner

                                                                                 HIGHLANDS                             PARK LAFORTUNE
                                                                 Tur

                                                                                                                              PLAZA
                                                                                                                    HOPE
                                                                                                                                                                                                            61st St S
                                                                                                                   VALLEY

                                                                                                                                                                                              71st St S

            The Opportunity Atlas, with its neighborhood-level estimates of                               The Child Equity Index (CEI) gives Tulsa a big head start on
            economic mobility, has gained attention across the country since                              answering these questions. The CEI has already done the hard work of
            its release in late 2018. The Atlas follows 20 million Americans
                                     5
                                                                                                          documenting the key neighborhood conditions that collectively affect
            from childhood to their mid-30s and traces their paths to affluence                           student outcomes. Turns out we find a strong relationship between
            or poverty back to the neighborhoods where the children grew up.                              today’s CEI scores and the Opportunity Atlas’ neighborhood mobility
            It’s a robust scorecard of where the American Dream is, and isn’t                             scores. Generally, neighborhoods with low CEI scores today also show
            working. With these new data in hand, policymakers at all levels of                           low economic mobility for children who grew up there decades ago.
            government—schools districts, counties, cities, states—are looking                            And, today’s high CEI scoring neighborhoods generally show better
VE MEDIAN
EDIAN       for direction on where and how to intervene to improve economic                               historic mobility rates. Those relationships don’t work everywhere,
EDIAN       mobility for today’s youth.                                                                   and some neighborhoods have switched positions over time. We have
OW MEDIAN
                                                                                                          plenty to learn in those neighborhoods as well.
            The Opportunity Atlas, with its neighborhood-level estimates of
            economic mobility, has gained attendance across the country since                             The bottom line: using current, local data, the CEI provides an
            researchers from the US Census Bureau, Opportunity Insights and                               important confirmation of the Opportunity Atlas and reveals
            Brown University released it in late 2018. As policymakers try to make
                                                     5
                                                                                                          neighborhoods ready for investment. Furthermore, the CEI, built
            use of the Atlas, at least two questions come to mind:                                        on over 40 neighborhood indicators, suggests where we should
                                                                                                          start. Direct investments in schools are critical. But we will also find
            First, are the neighborhood conditions of the 1970s and 1980s similar
                                                                                                          important solutions in our housing, health care, human service,
            to the conditions we see today? Neighborhoods change over time—
                                                                                                          and transportation systems. Pulling in these adjacent sectors is an
            sometimes quite a bit.
                                                                                                          important part of ImpactTulsa’s work.
            Second, if neighborhood conditions show disparities, what specifically
            should be addressed on the ground?

                                                                                                                                                                                                                                                                                           9
GROWTH IN ESTIMATED PRE-K ENROLLMENT %

                                                                                                                           GROWTH IN PRE-K ENROLLMENT,
                                                                                                                           FALL 2013 TO SPRING 2019

                                                                                                                                                                                                                     2018/2019 PERCENT OF KINDERGARTENERS WHO HAD PRE-K
                                                                                                                                                                                                       73%                           71%              67%                   82%                     68%                          77%                77%

                                                                                                                                                                  GROWTH 2013/2014 — 2018/2019
                                                                                        399 MORE
                                                                                        STUDENTS WERE                                                                                                                            10.1%               10.0%                 10.0%                                                                                 399 MORE STUD
                                                                                        IN PRE-K IN                                                                                                                                                                                                                                                              WERE IN PRE-K

     Pre-K Enrollment
                                                                                                                                                                                                        8.4%                                                                                        8.0%
                                                                                        2018/2019 THAN                                                                                                                                                                                                                                                           2018/2019 THA
                                                                                                                                                                                                                                                                                                                                 4.9%                            2012/2013
                                                                                        IN 2012/2013

                                                                                                                                                                                                                                                                                                                                                   -5.6%
     WHAT THE DATA SAYS                                                                                              0% CHANGE

                                                                                                                                                                                                                                                     MULTIRACIAL
                                                                                                                                                                                                      ALL STUDENTS

                                                                                                                                                                                                                                                                                                   NATIVE AMERICAN

                                                                                                                                                                                                                                                                                                                                 HISPANIC
                                                                                                                                                                                                                                 WHITE

                                                                                                                                                                                                                                                                           AFRICAN AMERICAN
     Overall enrollment rates have increased every year since 2013, with recent increases
     of about one percentage point per year and slightly larger gains among African

                                                                                                                                                                                                                                                                                                                                                 ASIAN/
                                                                                                                                                                                                                                                                                                                                                PACIFIC
                                                                                                                                                                                                                                                                                                                                              ISLANDER
     American, multiracial, and white populations.6 Only the Asian/Pacific Islander
     population had a lower enrollment rate in 2018 than in 2013, but this group
                                                                                                                                                                                                      6,783                      2,699                 886                   832                    388                     1,598                   365
     continues to have a relatively high enrollment rate overall. These trends reflect                                                                                                                                                                       2018/2019 NUMBER OF PRE-K STUDENTS

     region-wide efforts to improve pre-K outreach and enrollment.                        ESTIMATED PRE-K ENROLLMENT % (NEW, GOAL TBD)
                                                                                                                           PRE-K ENROLLMENT OVER TIME

     Oklahoma is ranked fourth in the nation as a leading state in providing universal
     pre-K access.7 Growth in enrollment rates will likely slow in the coming years, as                                                                                             80%

                                                                                                                     ESTIMATED % OF STUDENTS WHO ATTENDED PRE-K
                                                                                                                                                                                                                           78%         78%                                                                                                                GOAL
     the state is already a nationwide leader and children from families choosing private                                                                                           75%
                                                                                                                                                                                                   76%
                                                                                                                                                                                                               77%                                 76%         76%                                                                                        76%

                                                                                                                                                                                                                                                               73%
     schools or whose parents prefer to keep them at home comprise an ever-larger                                                                                                                                                      71%         72%
                                                                                                                                                                                    70%                        69%
                                                                                                                                                                                                                           70%

     share of children not already enrolled in public programs.
                                                                                                                                                                                    65%            65%

                                                                                                                                                                                    60%
     WHY IT MATTERS

                                                                                                                                                                                                                         2015/2016
                                                                                                                                                                                                 2013/2014

                                                                                                                                                                                                                                     2016/2017

                                                                                                                                                                                                                                                 2017/2018

                                                                                                                                                                                                                                                             2018/2019
                                                                                                                                                                                                             2014/2015

                                                                                                                                                                                                                                                                         2019/2020

                                                                                                                                                                                                                                                                                       2020/2021

                                                                                                                                                                                                                                                                                                    2021/2022

                                                                                                                                                                                                                                                                                                                     2022/2023

                                                                                                                                                                                                                                                                                                                                  2023/2024

                                                                                                                                                                                                                                                                                                                                              2024/2025
     Opportunity gaps, by income or race/ethnicity, are created before kindergarten
                                                                                                                                                                                                   KINDERGARTEN YEAR
     and do not substantially widen or shrink thereafter.8 Eliminating gaps requires
                                                                                                                                                                                                   TULSA AREA                    TULSA GOAL                  STATE
     early childhood interventions such as high-quality pre-K. Tulsa and Oklahoma are
     nationally recognized for their pre-K programming, and a growing body of evidence
     suggests enrollees will be better prepared for kindergarten, will gain critical social
     skills, and will complete high school at higher rates.9

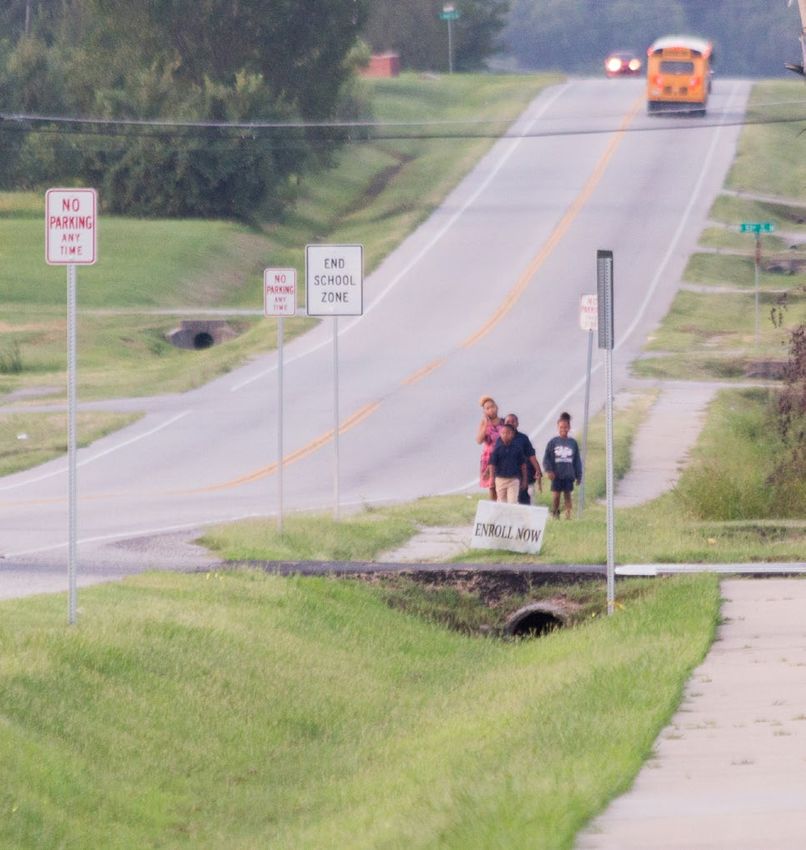
     One example of successful outreach efforts is ImpactTulsa’s partnership with The
     Power of Families Project to successfully bring community members together to
     serve as trusted messengers about pre-K opportunities. The team of Promotoras,
     advocates from the community that work in and with the community, canvassed
     neighborhoods to share information with families about Pre-K enrollment which
     increased enrollment in target zip code areas.

        “The goal of The Power of Families Project (POF), is to remove the unique barriers that impede
        community engagement and school readiness among Tulsa’s Hispanic/Latinx families, with a focus on
        Spanish-speaking, vulnerable and isolated families. We were proud to partner with ImpactTulsa as families
        were excited to hear this information from a trusted source and community member which helped increase
        enrollment. In addition, our team of Promotoras were empowered to be engaged as part of the solution in
        providing opportunities to their community.”

       MARIA ELENA KUYKENDALL – POWER OF FAMILIES

10
Attendance
WHAT THE DATA SAYS
Average Daily Attendance (ADA) provides a high-level overview of attendance
patterns by identifying the share of students that show up for school on the
average day. By this measure, the region’s schools have underperformed relative
to the statewide average since at least 2014-15 and have demonstrated a slight                                                “The Continuous Learning and Improvement
downward trend since then compared to the state.                                                                              (CLI) model has pushed our school to consistently
                                                                                                                              refine our practices by developing student-focused
But the seemingly high ADA levels and relatively small changes from year to year                                              strategies with a personalized process that pairs
miss a critical part of the story, namely, the prevalence of students with serious                                            sustainable interventions and ongoing student data
attendance problems. To capture this information, schools and districts in many                                               monitoring. By collecting experiential data from
states now calculate the share of students missing at least ten percent of school                                             students, families, and school staff, we were able
days, the chronic absenteeism rate. While the region’s chronic absenteeism rate                                               to understand the hurdles that negatively affect
                                                                                                                              attendance rates. From there, we worked with the
of 13.4 percent in 2018-19 likely exceeds the statewide rate given the difference
                                                                                                                              community to design strategies and interventions
in ADA, both region and state likely perform in the top tier of states. The most
                                                                                                                              tailored to the needs of students and families.”
recent data from the federal government indicate that in the 2015-16 academic
year, Oklahoma was in the top ten states with the lowest rate.10                                                              LINDSAY JOHNSON – BROKEN ARROW PRINCIPAL

                                                                                 ADA FOR OKLAHOMA AND TULSA AREA
WHY IT MATTERS                                                                   ADA FOR OKLAHOMA AND TULSA AREA

In early grades, regular attendance demonstrates a family’s commitment to                                          AVERAGE DAILY ATTENDANCE OVER TIME
getting their child to school. In later grades, as students become increasingly                                    95%

independent, regular attendance signals that a student has taken an active                                         95%                            83%

                                                                                                                                                                     82%
                                                                                                                             83%                  83%

role in their academic development. Mounting evidence demonstrates strong                                                    83%
                                                                                                                                                  83%
                                                                                                                                                                     82%
                                                                                                                                                                                                  83%

                                                                                                                   94%                            83%                              83%            83%

correlations between early attendance and longer-term outcomes such as reading                                               81%
                                                                                                                                                                     84%
                                                                                                                   94%                                                             83%
                                                                                                                             81%
proficiency and high school graduation.                                                                                                                              84%
                                                                                                                                                                                   84%
                                                                                                                                                                                                  85%

                                                                                                                                                                                                  85%
                                                                                                                                                                                   84%
                                                                                                                   93%
By creating and using a predictive model for chronic absenteeism, ImpactTulsa
                                                                                                                              FY 2015

                                                                                                                                                    FY 2016

                                                                                                                                                                       FY 2017

                                                                                                                                                                                      FY 2018

                                                                                                                                                                                                     FY 2019
                                                                                                                   93%
                                                                                                                         FY 2015

                                                                                                                                               FY 2016

                                                                                                                                                                  FY 2017

                                                                                                                                                                                 FY 2018

                                                                                                                                                                                                FY 2019
has helped school leaders determine who is at risk of becoming chronically absent
with 86% accuracy by the 20th day of school. ImpactTulsa has worked alongside
                                                                                                                            TULSA AREA        STATE
principals, attendance teams, and school staff to put into practiceFAYnationally
                                                                       STUDENTS CHRONICALLY ABSENT
                                                                                                                            TULSA AREA        STATE

researched strategies brought to Tulsa by Hedy Chang with Attendance Works.
We explored how to bring the conversation of attendance into parent-teacher                                        CHRONIC ABSENCE IN THE REGION

conferences, form attendance teams, use data to inform tiered decisions, utilize
success mentors, and address a variety of health-related needs of chronically
                                                                                                                                                              13.4%
absent students. Furthermore, ImpactTulsa worked closely with four school
districts and over 200 district and school leaders to better understand the root
causes of absenteeism at their sites through data analytics, continuous learning
and improvement coaching, and collaborative action networks.

                                                                                                                                        2018–2019

                                                                                                                                                                                                               11
GOAL
                                50%
                                                                                                                                                      48%

                                                                                                                                                               509 MORE 3RD

     % PROFICIENT OR ADVANCED
                                                                                                                                                               GRADERS PROFICIENT
                                40%      39%                     39%                                                                                           THAN LAST YEAR
                                         36%                     36%
                                                     33%

                                30%                  30%

                                                                                                                                                                                    PERCENT OF STUDENTS PROFICIENT OR ADVANCED IN
                                                                                                                                                                                    3RD GRADE ENGLISH LANGUAGE ARTS

                                20%
                                                                                                                                                                                                               40%

                                                                                                                                                                                    % PROFICIENT OR ADVANCED
                                                                                                                                                                                                                       39%                     39%
                                       2015/2016

                                                   2016/2017

                                                               2017/2018

                                                                           2018/2019

                                                                                       2019/2020

                                                                                                   2020/2021

                                                                                                               2021/2022

                                                                                                                           2022/2023

                                                                                                                                       2023/2024

                                                                                                                                                   2024/2025
                                                                                                                                                                                                                       36%                     36%

                                Third-Grade English                                                                                                                                                            30%
                                                                                                                                                                                                                                   33%

                                                                                                                                                                                                                                   30%

                                Language Arts
                                                                                                                                                                                                                                                         509 MORE
                                                                                                                                                                                                                                                         3RD GRADERS
                                         TULSA AREA             TULSA GOAL             STATE
                                                                                                                                                                                                                                                         PROFICIENT THAN
                                                                                                                                                                                                               20%                                       LAST YEAR

                                                                                                                                                                                                                     2015/2016

                                                                                                                                                                                                                                 2016/2017

                                                                                                                                                                                                                                             2017/2018
                                WHAT THE DATA SAYS
                                2019 third-grade English Language Arts (ELA) proficiency rates returned to levels
                                seen in 2017 following a dip in 2018 attributable (at least in part) to the 10-day
                                school closure that immediately preceded that year’s ELA assessment.11 While this
                                                                                                                                                                                                                       TULSA AREA            STATE
                                rebound is encouraging, the region and state nonetheless remain among the bottom
                                tier of states in elementary school ELA performance.

                                Rates for all racial subgroups except two returned to their 2017 rates; rates for
                                African American and multiracial students fell just shy and remain far below the
                                rates for white, Asian/Pacific Islander, Native American, and multiracial. Only about
                                15 percent of subgroups with IEPs and ELL status meet the state’s proficiency level.
                                Twenty-two percent of third graders with economic disadvantage are proficient,
                                with disparities compounded by race and ethnicity: 12 percent of low-income
                                African American third graders versus 37 percent of low-income Asian/Pacific
                                Islander students meet the proficiency level.

                                WHY IT MATTERS
                                Third-grade ELA proficiency predicts subsequent educational success, including
                                the likelihood of high school graduation. Given that, the existence of a large and
                                persistent opportunity gap underscores the importance of improving outcomes
                                for all student populations. The opportunity gap is a byproduct of both economic
                                disadvantage and the inequalitieis of race and ethnicity. Boosting ELA proficiency
                                across all groups, but especially for the most underserved populations, is crucial
                                for the future success of those students as well as the broader Tulsa community
                                and workforce.

                                Programs like Reading Partners work to support students in underserved
                                communities master basic reading skills in partnership with community volunteers
                                to provide individualized, personal literacy interventions.

12
PERCENTAGE PROFICIENT OR ADVANCED IN 3RD-GRADE ELA DISAGGREGATED BY RACE AND ECONOMIC STATUS, 2018/19
S PROFICIENT OR ADVANCED IN 3RD GRADE ENGLISH LANGUAGE ARTS 2018/19

                                        PERCENT OF STUDENTS PROFICIENT OR ADVANCED IN                                                                                                                                                                               PERCENT OF STUDENTS PROFICIENT OR ADVANCED IN 3RD GRADE
                                        3RD GRADE ENGLISH LANGUAGE ARTS 2018/2019                                                                                                                                                                                   ENGLISH LANGUAGE ARTS BY RACE AND ECONOMIC STATUS, 2018/2019

                                                                                                                                                                                                                                                                  OUTCOMES BY ECONOMIC STATUS AND RACE/ETHNICITY

                                                                                                                                                                                                       58%

                                                       50%                                                                                                                                                                                                                             62.5%
                                                                                                                                                                                                                                                                                                                                    58.0%
             % PROFICIENT OR ADVANCED

                                                                  43%                                                                                                                                                                                                                              56.3%                55.4%
                                                                                                                                                                      41%            42%

                                                                                                                                                                                                                                                            % PROFICIENT OR ADVANCED
                                                                                          39% 38%                                                     40%
                                         36%
                                                                                                                                                               33%                                                                                                                                                                                   41.5%
                                                                                                                                                                                                                                                                                                             36.8%                                                  36.1%
                                                                                                                                                                                                                                                                                           31.6%
                                                                                                                                                                                                                                 22%                                                                                        27.0%            25.3%
                                                                                                                        19%
                                                                                                                                    15%                                        15%            14%                                                                                                                                                           15.6%
                                                                                                                                                                                                                                                                                                                                                                         11.7%

                                                                                                                                                                                                                                                                                                                                      MULTIRACIAL
                                                                                                                                                                                                                                                                                         WHITE

                                                                                                                                                                                                                                                                                                               ASIAN/
                                                                                                                                                                                                                                                                                                    PACIFIC ISLANDER

                                                                                                                                                                                                                                                                                                                           NATIVE
                                                                                                                                                                                                                                                                                                                         AMERICAN

                                                                                                                                                                                                                                                                                                                                                       HISPANIC

                                                                                                                                                                                                                                                                                                                                                                      AFRICAN
                                                                                                                                                                                                                                                                                                                                                                     AMERICAN
                                                               ASIAN/PACIFIC ISLANDER

                                                                                                          MULTIRACIAL
                                        ALL STUDENTS

                                                                                        NATIVE AMERICAN

                                                                                                                                                                                     NO ELL
                                                                                                                                                                                              ELL
                                                                                                                        HISPANIC
                                                       WHITE

                                                                                                                                   AFRICAN AMERICAN

                                                                                                                                                      FEMALE
                                                                                                                                                               MALE

                                                                                                                                                                      NO IEP
                                                                                                                                                                               IEP

                                                                                                                                                                                                    ECONOMICALLY ADVANTAGED
                                                                                                                                                                                                                              ECONOMICALLY DISADVANTAGED
                                                                                                                                                                                                                                                           ECONOMICALLY
                                                                                                                                                                                                                                                           ADVANTAGED                    2,323           126               307         386              311            158

                                                                                                                                                                                                                                                           ECONOMICALLY
                                                                                                                                                                                                                                                           DISADVANTAGED                 1,651           277               396         628             1,769           986
                                                                                                                                                                                                                                                                                                                                                          NUMBER OF TEST TAKERS
                                          9,318        3,974 403                           703 1,014 2,080 1,144                                       4,605 4,713    7,666 1,652    7,359 1,959       3,611 5,707

                                                                                                                                                                                     NUMBER OF TEST TAKERS
                                                                                                                                                                                                                                                           ELL= English Language Learner: It has been referred to by several other names including:
                                                                                                                                                                                                                                                           Limited English Proficient (LEP) and English Learner (EL). A language other than English is
                                                                                                                                                                                                                                                           spoken more often than English in the home OR a language other than English is Spoken less
                                                                                                                                                                                                                                                           often than English in the home. Upon entering school, the student has been administered the
                                                                                                                                                                                                                                                           Pre-K Screener, the Kindergarten WIDA ACCESS Placement Test (K-W-APT) or the WIDA ACCESS
                                                                                                                                                                                                                                                           Placement Test (W-APT) and has a qualifying score below the proficiency level.

                                                                                                                                                                                                                                                           IEP= Individualized Education Program: A written document (developed collaboratively by
                                                                                                                                                                                                                                                           parents and school personnel) which outlines the special education program for a student with a
                                                                                                                                                                                                                                                           disability. This document is developed, reviewed and revised at an IEP meeting at least annually.
                                                                                                                                                                                                                                                           Source: Oklahoma State Department of Education

                                                                                                                                                 “Our students showed increased academic growth
                                                                                                                                                 last year with the help of Reading Partners as well
                                                                                                                                                 as a greater love for reading. The social emotional
                                                                                                                                                 learning gains our students have experienced
                                                                                                                                                 from community mentorship are increased
                                                                                                                                                 social awareness, self-management, relationship
                                                                                                                                                 building and responsible decision making. Reading
                                                                                                                                                 Partners is creating pathways of opportunity by
                                                                                                                                                 helping students to become lifelong readers which
                                                                                                                                                 intensifies the path of them becoming college and
                                                                                                                                                 career ready.”

                                                                                                                                                ELAINE BUXTON, TULSA PUBLIC SCHOOLS PRINCIPAL

                                                                                                                                                                                                                                                                                                                                                                                  13
GOAL      135 MORE 8TH

     % PROFICIENT OR ADVANCED
                                30%                                                                                                                  30%      GRADERS PROFICIENT
                                                                                                                                                              THAN LAST YEAR

                                      Eighth-Grade
                                25%
                                       23%                      23%
                                                                23%
                                       22%
                                                    21%

                                      Mathematics
                                20%                 20%                                                                                                                                                       PERCENT OF STUDENTS PROFICIENT OR ADVANCED IN
                                                                                                                                                                                                              8TH GRADE MATH

                                15%
                                                                                                                                                                                                              25%

                                                                                                                                                                                   % PROFICIENT OR ADVANCED
                                      2015/2016

                                                  2016/2017

                                                              2017/2018

                                                                          2018/2019

                                                                                      2019/2020

                                                                                                  2020/2021

                                                                                                              2021/2022

                                                                                                                          2022/2023

                                                                                                                                      2023/2024

                                                                                                                                                  2024/2025
                                                                                                                                                                                                                       23%                      23%
                                                                                                                                                                                                                                                23%
                                                                                                                                                                                                                       22%
                                                                                                                                                                                                              20%                   21%

                   Eighth-Grade                                                                                                                                                                                                     20%
                                                                                                                                                                                                                                                          135 MORE
                                                                                                                                                                                                                                                          8TH GRADERS
                                                                                                                                                                                                              15%                                         PROFICIENT THAN
                   Mathematics          TULSA AREA             TULSA GOAL             STATE                                                                                                                                                               LAST YEAR

                                                                                                                                                                                                                      2015/2016

                                                                                                                                                                                                                                  2016/2017

                                                                                                                                                                                                                                              2017/2018
                   WHAT THE DATA SAYS
                   The overall share of eighth graders deemed proficient in math in 2019 returned
                   to 23 percent, the same level seen in 2017, similar to the statewide trend, with                                                                                                                     TULSA AREA              STATE
                   outcomes in the region remaining at about the statewide average.12 Oklahoma has
                   underperformed relative to the national average since the early 2000s.13 As with
                   third-grade ELA performance, disaggregating eight-grade math proficiency rates
                   reveals large disparities in outcomes for African American, Hispanic, and low-
                   income students, while rates for Asian/Pacific Islander students were the highest.
                   Among students with economic disadvantage, proficiency rates range from 8
                   percent for African American eighth graders to 30 percent for Asian/Pacific Islander
                   students. Proficiency for ELL students and students with an IEP also fall well below
                   the overall average.

                   WHY IT MATTERS
                   As technological progress accelerates in the world around us, math is an
                   increasingly important skill set for any career path students choose to enter. In
                   addition, math enhances students analytical skills and the ability to think critically
                   in understanding society. Alongside math skills, students also need to develop social
                   skills (abilities to communicate, negotiate and persuade) for a greater range of job
                   opportunities and stronger wage growth.14

                   Programs like the Tulsa Regional Stem Alliance’s Me and My Math Mentor highlight
                   the impact of merging math and social skill development to provide Tulsa area
                   students with unique learning opportunities.

14
PERCENTAGE PROFICIENT OR ADVANCED IN EIGHTH-GRADE MATH DISAGGREGATED BY RACE AND ECONOMIC STATUS, 2018/19
PROFICIENT OR ADVANCED IN 8TH GRADE MATH 2018/19

                                      PERCENT OF STUDENTS PROFICIENT OR ADVANCED IN                                                                                                                                                                                    PERCENT OF STUDENTS PROFICIENT OR ADVANCED IN 8TH GRADE
                                      8TH GRADE MATH 2018/2019                                                                                                                                                                                                         MATH BY RACE AND ECONOMIC STATUS, 2018/2019

                                                                                                                                                                                                                                                                         OUTCOMES BY ECONOMIC STATUS AND RACE/ETHNICITY

                                                                                                                                                                                                                                                                                              66.3%

                                                         44%
           % PROFICIENT OR ADVANCED

                                                                                                                                                                                                                                                                   % PROFICIENT OR ADVANCED
                                                                                                                                                                                                      35%
                                                                               30%                                                                                                                                                                                                                                 38.0%       35.9%
                                                                                                                                                                     26%            25%
                                       23%                                              24%                                                          22% 24%                                                                                                                                           29.6%
                                                                                                                                                                                                                                                                                                                                               26.5%
                                                                                                      19%                                                                                                                                                                                                                                                      25.1%
                                                                                                                       14%                                                                                                      13%                                                                                    16.2%                                                   16.0%
                                                                                                                                     9%                                                                                                                                                                                                13.8%           11.4%           12.1%
                                                                                                                                                                              4%                                                                                                                                                                                                       7.7%
                                                                                                                                                                                             2%

                                                                                                                                                                                                                                                                                                                                 MULTIRACIAL
                                                                                                                                                                                                                                                                                                          ASIAN/
                                                                                                                                                                                                                                                                                               PACIFIC ISLANDER

                                                                                                                                                                                                                                                                                                                     WHITE

                                                                                                                                                                                                                                                                                                                                                  NATIVE
                                                                                                                                                                                                                                                                                                                                                AMERICAN

                                                                                                                                                                                                                                                                                                                                                                 HISPANIC

                                                                                                                                                                                                                                                                                                                                                                                 AFRICAN
                                                                                                                                                                                                                                                                                                                                                                                AMERICAN
                                                                               WHITE
                                                                                       MULTIRACIAL
                                      ALL STUDENTS

                                                                                                     NATIVE AMERICAN

                                                                                                                                                                                    NO ELL
                                                                                                                                                                                             ELL
                                                                                                                       HISPANIC
                                                      ASIAN/PACIFIC ISLANDER

                                                                                                                                  AFRICAN AMERICAN

                                                                                                                                                     FEMALE
                                                                                                                                                              MALE

                                                                                                                                                                     NO IEP
                                                                                                                                                                              IEP

                                                                                                                                                                                                   ECONOMICALLY ADVANTAGED
                                                                                                                                                                                                                             ECONOMICALLY DISADVANTAGED
                                                                                                                                                                                                                                                                  ECONOMICALLY                      104              2,324        357             325             295             175
                                                                                                                                                                                                                                                                  ADVANTAGED

                                                                                                                                                                                                                                                                  ECONOMICALLY
                                                                                                                                                                                                                                                                  DISADVANTAGED                     162              1,258         436            351            1,360            764
                                                                                                                                                                                                                                                                                                                                                                    NUMBER OF TEST TAKERS
                                         7,911           266 3,582 793                                 676 1,655 939                                 3,865 4,046     6,848 1,063    7,447 464        3,580 4,331

                                                                                                                                                                                    NUMBER OF TEST TAKERS

                                                     ELL= English Language Learner IEP= Individualized Education Program
                                                     Full definition on page 13

                                                                                                                                                                                                                                                          “Me and My Math Mentor creates a pathway to
                                                                                                                                                                                                                                                          opportunity for students by helping them get to
                                                                                                                                                                                                                                                          know STEM professionals, experience mathematics
                                                                                                                                                                                                                                                          that is social, team oriented, strategic, and inviting
                                                                                                                                                                                                                                                          to become world class problem solvers through
                                                                                                                                                                                                                                                          the number sense reinforcing platform of playing
                                                                                                                                                                                                                                                          games. This program has increased Math academic
                                                                                                                                                                                                                                                          growth and reduced chronic absenteeism among
                                                                                                                                                                                                                                                          student participants.”

                                                                                                                                                                                                                                                          XAN BLACK, TULSA REGIONAL STEM ALLIANCE

                                                                                                                                                                                                                                                                                                                                                                                              15
HIGH SCHOOL GRADUATION RATES BY DEMOGRAPHIC GROUP

                                                                                                                                                                        GRADUATION RATE OVER TIME BY DEMOGRAPHIC

                                                                                                                                                                                                                                                                                                                                                                                                                            GOAL
                                                                                                                                                                                        90%                                                                                                                                                                                                                                  90%

                                                                                                                                                                                                                                                                                                                                                                                                                                        252 MORE STUDEN

                                                                                                                                             % PROFICIENT OR ADVANCED
                                                                                                                                                                                                                                                                                                                                                                                                                             GRADUATED IN 201
                                                                                                                                                                                                                                                                                                                                                                                                              252 MORE GRADUATED
                                                                                                                                                                                                                                                                                                                                                                                                                             THAN IF GRADUATI
                                                                                                                                                                                                                                                                                                                                                                                                              IN 2018 THAN IFRATES REMAINED A
     High School Graduation
                                                                                                                                                                                        85%
                                                                                                                                                                                                                                                                                                         85%

                                                                                                                                                                                                                                                                                                                                                                                                                             2013 LEVEL
                                                                                                                                                                                                                                                                       84%
                                                                                                                                                                                                                                                                                       84%
                                                                                                                                                                                                                                                                                                                                                                                                              GRADUATION RATES
                                                                                                                                                                                                                                                                                                         83%
                                                                                                                                                                                                                83%                             83%
                                                                                                                                                                                                                                                83%
                                                                                                                                                                                                                                                                       82%
                                                                                                                                                                                                                                                                                       83%
                                                                                                                                                                                                                                                                                                                                                                                                              REMAINED AT THE
                                                                                                                                                                                                                81%                                                                                                                                                                                           2013 LEVEL
                                                                                                                                                                                        80%

     WHAT THE DATA SAYS

                                                                                                                                                                                                             2013/2014

                                                                                                                                                                                                                                              2014/2015

                                                                                                                                                                                                                                                                     2015/2016

                                                                                                                                                                                                                                                                                     2016/2017

                                                                                                                                                                                                                                                                                                     2017/2018

                                                                                                                                                                                                                                                                                                                          2018/2019

                                                                                                                                                                                                                                                                                                                                       2019/2020

                                                                                                                                                                                                                                                                                                                                                                      2020/2021

                                                                                                                                                                                                                                                                                                                                                                                   2021/2022

                                                                                                                                                                                                                                                                                                                                                                                                  2022/2023

                                                                                                                                                                                                                                                                                                                                                                                                               2023/2024

                                                                                                                                                                                                                                                                                                                                                                                                                            2024/2025
     The on-time, four-year graduation rate rose from 83 to 85 percent. The increase
     was driven by increases across racial and income subgroups. Hispanic, Native
                                                                                                                                                                                                               TULSA AREA                                                   TULSA GOAL                                    STATE
     American, and White students experienced increases of three percentage pointsCHANGE IN HIGH SCHOOL GRADUATION RATES BY DEMOGRAPHIC GROUP
     each between 2017 and 2018. Multiracial students experienced the smallest                                                                                          GRADUATION RATE PERCENT CHANGE OVER TIME BY RACE/ETHNICITY
     increase (less than one percentage point). Large completion gaps persist, however.
                                                                                                                                                                                                                                                                                                                                                                                                 2017/2018 GRADUATION RATE
     Hispanic and African American high schoolers have the lowest graduation rates                                                                                                        80.8% 76.9% 85.6% 80.7% 85.4% 83.2% 88.7% 91.3% 86.5% 86.8% 77.2% 86.7% 58.0%

                                                                                                                                                        GROWTH 2013/2014 — 2018/2019
     (81 percent) compared to their counterparts. Men graduate on time at lower rates                                                                                                     10.8%
                                                                                                                                                                                                                   9.1%
                                                                                                                                                                                                                                                    8.0%
     than women, and lower income students graduate on time at lower rates than                                                                                                                                                                                           6.0%

                                                                                                                                                                                                                                                                                           4.0%
     students with higher incomes.       15                                                                                                                                                                                                                                                                  2.6%               2.3%        2.0%
                                                                                                                                                                                                                                                                                                                                                                          -2.8%          N/A            N/A         N/A         N/A
                                                                                                                                            0% CHANGE

                                                                                                                                                                                                                                                                                                            MULTIRACIAL

                                                                                                                                                                                                                                                                                                                                                                                                                   NO ELL

                                                                                                                                                                                                                                                                                                                                                                                                                               ELL
                                                                                                                                                                                                                 ECONOMICALLY DISADVANTAGED

                                                                                                                                                                                                                                                                          HISPANIC

                                                                                                                                                                                                                                                                                          ALL STUDENTS

                                                                                                                                                                                                                                                                                                                               WHITE

                                                                                                                                                                                                                                                                                                                                            ECONOMICALLY ADVANTAGED

                                                                                                                                                                                                                                                                                                                                                                                        NO IEP

                                                                                                                                                                                                                                                                                                                                                                                                      IEP
                                                                                                                                                                                          AFRICAN AMERICAN

                                                                                                                                                                                                                                                   NATIVE AMERICAN
     The region’s high school graduation rate remains close to the U.S. average, a

                                                                                                                                                                                                                                                                                                                                                                         ASIAN/
                                                                                                                                                                                                                                                                                                                                                                        PACIFIC
                                                                                                                                                                                                                                                                                                                                                                      ISLANDER
     relatively strong showing given the region’s relatively lower performance in
     elementary ELA and middle school math.                                                                                                                                            TULSA COMMUNITY COLLEGE CONCURRENT ENROLLMENT, 2013-2019                                                                                                                                                                                                    TUL

                                                                                                                                                                                          1,099 3,416                                                833                  1,321 8,370                          825             3,959 4,954                                  333        7,217 1,153 8,013                        357
                                                                                                                                                                                                                                                                                                                                                                                                           2017/2018 COHORT SIZE

     College/Career Readiness
     SAT and ACT results from across the region indicate about 36 percent of the                                                                                        TULSA COMMUNITY COLLEGE CONCURRENT ENROLLMENT, 2013-2019
     region’s 11th graders are ready for college-level work in ELA, and 27 percent are
                                                                                                                                                                                                                                                                                                                                                                                               2,123
     ready for college math. The findings—stronger performance in language than                                                                                                                                                                                            2,073

     math—mirror the 3rd and 8th grade test results. Subgroup analyses yield striking                                                                                                                                                    1,947                                                                                    1,954                                 1,955

     opportunity gaps, particularly in comparison to the smaller (but still important)
                                                                                                                                                                                                                                                                                                         1,833
     disparities in high school graduation rates. For example, only 5 percent of low-
     income African American students are ready for college math compared with 45
     percent of middle- and upper-income white students.
                                        TULSA COMMUNITY COLLEGE CONCURRENT ENROLLMENT, 2013-2019                                                                                         TULSA TECH SECONDARY ENROLLMENT (FULL-TIME) 2013-2019
                                                                                                                                                                                                                                                                           2014-2015

                                                                                                                                                                                                                                                                                                                                  2017-2017

                                                                                                                                                                                                                                                                                                                                                                       2017-2018

                                                                                                                                                                                                                                                                                                                                                                                               2018-2019
                                                                                                                                                                                                                                         2013-2014

                                                                                                                                                                                                                                                                                                         2015-2016

     On a better note, high school concurrent enrollment in community college and
     technical education centers made a big jump in the last year, with 2,123 students
     concurrently enrolled at Tulsa Community College (TCC) and 4,148 students                                                                                          TULSA TECH SECONDARY STUDENT ENROLLMENT
                                                                                                                                                                        (FULL-TIME), 2013-2019
     enrolled at Tulsa Tech in 2018-19.       16

                                                                                                               2,123                                                                                                                                                                                                                                                   4,121               4,148
                                                                                                                                                                                                                                                                                                         3,828                    3,865
                                                               2,073
                                                                                                                                                                                                                                                                           3,524
     Concurrent enrollment at TCC gives students a head start on becoming prepared                                                                                                                                                      3,286

     for college, provides an introduction to1,947           1,954of 1,955
                                              the higher demands     college-level
     courses, and allow students an early pursuit of their1,833
                                                             higher education, career, and
     professional aspirations. The programming at Tulsa Tech helps address a well-
     recognized technical skills shortage and puts students on a path to well-paying
     opportunities in the skilled trades.
                                                               2014-2015

                                                                                       2017-2017

                                                                                                   2017-2018

                                                                                                                                                                                                                                                                           2014-2015

                                                                                                                                                                                                                                                                                                                                  2017-2017

                                                                                                                                                                                                                                                                                                                                                                       2017-2018
                                                                                                               2018-2019

                                                                                                                                                                                                                                                                                                                                                                                               2018-2019
                                                   2013-2014

                                                                           2015-2016

                                                                                                                                                                                                                                       2013-2014

                                                                                                                                                                                                                                                                                                         2015-2016

16
WHY IT MATTERS                                                                                         PERCENTAGE OF ELEVENTH-GRADE STUDENTS MEETING COLLEGE READINESS
                                                                                                           PERCENTAGE OF ELEVENTH-GRADE STUDENTS MEETING COLLEGE READINESS BENCHMARKS, 2018/19
                                                                                                          BENCHMARKS    IN MATH
                                                                                                           BY DEMOGRAPHICS  – MATHAND
                                                                                                                                   ANDENGLISH
                                                                                                                                      ELA      LANGUAGE ARTS, 2019
   High school graduation is a minimum requirement for students aspiring                                                                                                                                            % PROFICIENT OR ADVANCED

   to reach the middle class. As of November 2019), the unemployment                                                      MATH                                         7,454
                                                                                                                                                                                               ALL STUDENTS
                                                                                                                                                                                                                                                27%
                                                                                                                                                                       7,459                                                                           36%
   rate for adults without a high school degree is still 5.3 percent—1.5                                                   ELA
                                                                                                                                                                       3,418                                                                               38%
   percentage points higher than the rate for high school graduates and                                                                                                3,421
                                                                                                                                                                                                         WHITE
                                                                                                                                                                                                                                                                        49%

   more than twice the unemployment rate for college graduates (2.0                                                                                                     316                     ASIAN/                                                     38%
                                                                                                                                                                        316          PACIFIC ISLANDER                                                    37%
   percent).17 High school dropouts have also seen relatively slow wage                                                                                                 693                                                                     28%
                                                                                                                                                                                                    MULTIRACIAL
   growth since the early 1990s.18 Economists and technologists foresee an                                                                                              621                                                                            35%

                                                                                                                                                                        621                                                                  25%
   acceleration of technological progress in coming years through artificial                                                                                            693
                                                                                                                                                                                    NATIVE AMERICAN
                                                                                                                                                                                                                                                         36%

   intelligence, machine learning, and robotics. Technology will replace                                                                                               1,462
                                                                                                                                                                                                      HISPANIC
                                                                                                                                                                                                                                    14%
                                                                                                                                                                       1,463                                                          19%
   more routine work, which could further hurt the job prospects for adults                                                                                             944                                                 7%
                                                                                                                                                                                AFRICAN AMERICAN
   without a high school diploma. Boosting college and career-readiness is                                                                                              945                                                         15%

   an imperative as the region continues to advance postsecondary entry                                                                                                3,668
                                                                                                                                                                                                        FEMALE
                                                                                                                                                                                                                                              26%
                                                                                                                                                                       3,671                                                                                  40%

   and completion.                                                                                                                                                     3,786                                                                     29%
                                                                                                                                                                                                          MALE
                                                                                                                                                                       3,788                                                                         32%

   Union’s Career Connect program partners with local business and                                                                                                     6,519
                                                                                                                                                                                                         NO IEP
                                                                                                                                                                                                                                                   31%
                                                                                                                                                                       6,522                                                                                  40%

   community leaders to offer job shadowing, apprenticeships and                                                                                                        935                                            4%
                                                                                                                                                                                                              IEP
                                                                                                                                                                        937                                               6%
   internships in addition to their concurrent enrollment offerings. This
                                                                                                                                                                       6,913                                                                     29%
   real-world work experience allows students to learn from industry                                                                                                   6,917
                                                                                                                                                                                                         NO ELL
                                                                                                                                                                                                                                                            39%

   experts to make more educated decisions for themselves while in high                                                                                                 541                                           3%
                                                                                                                                                                                                              ELL
                                                                                                                                                                        542                                         1%

                                                                                                                                               NUMBER OF TEST TAKERS
   school regarding postsecondary aspirations.
                                                                                                                                                                       3,868
                                                                                                                                                                                          ECONOMICALLY                                                       40%
                                                                                                                                                                       3,870                ADVANTAGED                                                                  50%

                                                                                                                                                                       3,586
                                                                                                                                                                                         ECONOMICALLY                               14%
                                                                                        MATH- OUTCOMES BY ECONOMIC STATUS AND RACE / ETHNICITY
                                                                                                                                                                       3,589            DISADVANTAGED                                     21%

                                                                                                          MATH – OUTCOMES BY ECONOMIC STATUS AND RACE/ETHNICITY
                                                                                                                                       OUTCOMES BY ECONOMIC STATUS AND RACE/ETHNICITY

                                                                                                                                                                               52.6%
                                                                                                                                 % PROFICIENT OR ADVANCED

                                                                                                                                                                                                      44.9%
                                                                                                                                                                                                                    40.9%

                                                                                                                                                                                                                                     31.8%
                                                                                                                                                                                        26.3%                                                          25.3%
                                                                                                                                                                                                           20.9%
                                                                                                                                                                                                                                             16.4%                       14.9%
                                                                                                                                                                                                                           12.0%                                10.8%
                                                                                                                                                                                                                                                                                 4.7%

                                                                                                                                                                                                                      MULTIRACIAL
                                                                                                                                                                                           ASIAN/
                                                                                                                                                                                PACIFIC ISLANDER

                                                                                                                                                                                                         WHITE

                                                                                                                                                                                                                                        NATIVE
                                                                                                                                                                                                                                      AMERICAN

                                                                                                                                                                                                                                                           HISPANIC

                                                                                                                                                                                                                                                                           AFRICAN
                                                                                                                                                                                                                                                                          AMERICAN
                                                                                                                   ECONOMICALLY ADVANTAGED                                           137                2,425            384              365               336               221
                                            “Through this real world experiential       ELA - OUTCOMES BY ECONOMICECONOMICALLY
                                                                                                                    STATUS AND DISADVANTAGED  179
                                                                                                                                 RACE / ETHNICITY                                                        993             309              256              1,126              723
                                                                                                                                                                                                                                                              NUMBER OF TEST TAKERS
                                            learning program, students gain a sense
                                            of purpose, and can plan their path                           ELA – OUTCOMES BY ECONOMIC STATUS AND RACE/ETHNICITY
                                            forward with a deep understanding about                                                    OUTCOMES BY ECONOMIC STATUS AND RACE/ETHNICITY

                                            the career options they have available to                                                                                                                 55.5%
                                                                                                                                                                               54.0%
                                            them. All students in Career Connect
                                                                                                                                 % PROFICIENT OR ADVANCED

                                                                                                                                                                                                                    45.6%
                                                                                                                                                                                                                                     42.7%

                                            gain soft skills and build professional                                                                                                                        32.8%                                       33.0%
                                                                                                                                                                                        24.6%                                              25.4%                         26.7%
                                            relationships that will serve them well,                                                                                                                                        22.7%
                                                                                                                                                                                                                                                                14.6%
                                                                                                                                                                                                                                                                               11.3%
                                            now and in their future.”
                                                                                                                                                                                                                      MULTIRACIAL
                                                                                                                                                                                           ASIAN/
                                                                                                                                                                                PACIFIC ISLANDER

                                                                                                                                                                                                         WHITE

                                                                                                                                                                                                                                        NATIVE
                                                                                                                                                                                                                                      AMERICAN

                                                                                                                                                                                                                                                           HISPANIC

                                                                                                                                                                                                                                                                           AFRICAN
                                                                                                                                                                                                                                                                          AMERICAN

                                            JENNY FLOWER, UNION CAREER CONNECT

                                                                                                                   ECONOMICALLY ADVANTAGED                                           137                 2,427           384              365               336               221
                                                                                                                   ECONOMICALLY DISADVANTAGED                                        179                 994             309              256              1,127              724
                                                                                                                                                                                                                                                              NUMBER OF TEST TAKERS
ELL= English Language Learner IEP= Individualized Education Program
Full definition on page 13
                                                                                                                                                                                                                                                                                        17
FAFSA COMPLETION FOR HIGH SCHOOL SENIORS, 2015-2019

     Postsecondary Entry
     and Completion                                                                                               FAFSA COMPLETION FOR HIGH SCHOOL SENIORS, 2015-2019

                                                                                                                                                4,500                                                                                                                                        80%

                                                                                                                   NUMBER OF FAFSAS COMPLETED

                                                                                                                                                                                                                                                                                                         SENIORS COMPLETING FAFSA
                                                                                                                                                                                                                                                                                                          PERCENTAGE OF ENROLLED
                                                                                                                                                                                                                                                                                   GOAL
     WHAT THE DATA SAYS                                                                                                                         4,300                                                                                                                               70%      70%

     Most students require some form of financial aid to attend college. Completing the                                                         4,100                                      61%
                                                                                                                                                                                                        60%                                                                                  60%
                                                                                                                                                                58%                                                 58%
                                                                                                                                                                              57%

     FAFSA comprises the necessary first step towards accessing institutional, state, and
                                                                                                                                                3,900                                                                                                                                        50%
     federal support for postsecondary education. The region has sustained a substantial

                                                                                                                                                           2015

                                                                                                                                                                             2016

                                                                                                                                                                                          2017

                                                                                                                                                                                                       2018

                                                                                                                                                                                                                    2019

                                                                                                                                                                                                                                2020

                                                                                                                                                                                                                                             2021

                                                                                                                                                                                                                                                         2022

                                                                                                                                                                                                                                                                     2023

                                                                                                                                                                                                                                                                                 2024
     increase in FAFSA completions after 2015-16, the result of region wide efforts to
                                                                                                                                                                COMPLETIONS                 COMPLETION RATE                     TULSA GOAL
     boost the number of high school students that have completed the FAFSA by the
     time they graduate. Due in part to the region’s higher graduation rate and, hence,
     increasing number of high school graduates, the overall FAFSA completion    rate
                                                                      PERCENTAGE OF HIGH SCHOOL GRADUATES ENROLLINGOF
                                                                                                      PERCENTAGE    INHIGH
                                                                                                                      OKLAHOMA  COLLEGES,
                                                                                                                           SCHOOL         2013-2019
                                                                                                                                  GRADUATES   ENROLLING
     remains essentially unchanged relative to 2013-14 after slight declines in 2016-17                             IN OKLAHOMA COLLEGES, 2013-2019

     and 2017-18.
                                                                                                                             60%
                                                                                                                                                                                                                                                                                              GOAL
     The in-state, first-time college-going enrollment remains unchanged, staying at                                                                    57%
                                                                                                                                                                      56%
                                                                                                                                                                                                                                                                                              57%
                                                                                                                                                                                55%

     53 percent during 2018-2019. This represents the share of Tulsa area high school                                                                                                        52%
                                                                                                                                                                                                          53%        53%
                                                                                                                                                        52%
                                                                                                                             50%
     graduates who enroll in Oklahoma public and private universities and colleges. The                                                                               49%       49%

                                                                                                                                                                                             47%
     unchanged rate at 53 percent is seemingly good news. The region—like the state—                                                                                                                      46%

     has seen a consistent decline in enrollments among recent high school completers
                                                                                                                             40%
     between 2014 and 2017, with rates for the Tulsa region slightly edging up during
                                                                                                                                                    2013/2014

                                                                                                                                                                 2014/2015

                                                                                                                                                                              2015/2016

                                                                                                                                                                                           2016/2017

                                                                                                                                                                                                        2017/2018

                                                                                                                                                                                                                    2018/2019

                                                                                                                                                                                                                                 2019/2020

                                                                                                                                                                                                                                             2020/2021

                                                                                                                                                                                                                                                         2021/2022

                                                                                                                                                                                                                                                                     2022/2023

                                                                                                                                                                                                                                                                                 2023/2024

                                                                                                                                                                                                                                                                                             2024/2025
     2017-2018. While the slight increases in rates of college enrollment for the region
     have been positive, rates for participation in developmental education courses
     and remediation presents a more nuanced picture. Forty-two percent of Tulsa                                                                        TULSA AREA                   TULSA GOAL                     STATE

     area graduates were required to participate in a developmental education course
     (remediation) in their first year enrolled at an Oklahoma college during 2017-2018.
     This rate is higher than the state’s average of 37 percent. These rates are concerning                                                                     OF THE STUDENTS WHO ENROLL IN COLLEGE,
                                                                                                                                                                A SIGNIFICANT PORTION TAKE ONE OR MORE
     and coupled with the low SAT/ACT outcomes in ELA and Math, they emphasize that                                                                             REMEDIATION COURSE. IN 2017/18, 42% OF
     improving college and career preparedness must be a high priority for the region.                                                                          THE STUDENTS FROM THE TULSA REGION
                                                                                                                                                                AND 37% OF THE STUDENTS FROM THE STATE
                                                                                                                                                                REQUIRED REMEDIATION.

18
College-enrollment and remediation rates in Oklahoma give us
much needed information for measuring our collective progress
providing postsecondary opportunities. However, the picture is
incomplete, missing information on students who attend public and
private institutions outside of Oklahoma. Gaining access to National
Student Clearinghouse’s unique national student data and resources
is a goal for the entire region. Having this information will provide a
more comprehensive understanding of student pathways and college
outcomes that ultimately contribute to student success.

WHY IT MATTERS
Technological progress will drive a continual increase in demand for
high-skilled labor in Tulsa, across the country, and around the world.
Fostering and supporting postsecondary ambitions of the region’s youth,
particularly amongMACKENZIE
                      economicallyTOLIVER
                                    disadvantaged students and students
                  High  School Senior
of color, will serve both to develop a globally competitive workforce
and to improve economic opportunity for historically underserved
populations.

        “Tulsa Community College (TCC) has acknowledged that
        reflective connections to real life are what will help our students
        find the pathways to success that keep them engaged.

        TCC will continue to strive for excellence as we lean on our
        faculty, community connections, and the diversity of expertise
        through the College and our Tulsa community to bring innovative
        approaches to support our students.”

        DR. DEWAYNE DICKENS, TULSA COMMUNITY COLLEGE

                                                                              19
Call to Action
     Our collective impact journey started six years ago with a strong         To our partners in the healthcare, human service, civic and other
     belief that our education improvement work had to move beyond the         adjacent sectors, recognize that each of you holds keys—some small,
     schoolhouse. We hypothesized that if young Tulsans were going to          some large—to better lifetime outcomes for children. This work will
     reach their full potential, the neighborhoods and communities around      push you into unconventional, unfamiliar roles. Embrace them.
     the schools would have to improve as well. We were ahead of the
                                                                               To the business community, this era of data-driven discovery
     times.
                                                                               needs your sustained engagement and strategic insight. This is
     Since then, science has confirmed our beliefs. Groundbreaking, big        classic Research & Design, and we need your leadership. Our youth
     data analyses show that neighborhood conditions, including school         would also benefit from as many internships, mentorships, and
     quality, affect the long-term trajectories and earnings of the children   informational interviews as you can offer. Opportunity stems, in part,
     who grow up there. Communities across the country are waking up to        from connections and networks. Be generous in creating and sharing
     their local realities and launching work like ours.                       them.

     Ask the experts who unlocked these findings what we should                And to our funders, be patient. The experts on economic mobility are
     do next, and their answers aren’t fully developed. They suggest           quick to admit how much they don’t know, and this work involves
     promising directions but admit that we’re in an era of data-driven        trial and error. Keep us connected to the experts, and we will learn
     discovery. We have been here before. Much like Tulsa advanced the         with them.
     nation’s understanding about the importance of pre-kindergarten
                                                                               As for us at ImpactTulsa, we commit to use our partners’ time and
     interventions, the region is positioned as a leader of this economic
                                                                               resources productively. This is among the most important work in the
     mobility work.
                                                                               region, and we are honored to share it with you.
     So, the work continues with deeper conviction and a sharper focus.
     We don’t just believe broad community engagement is required to
     improve outcomes for the next generation of Tulsans. We know it.

     And here’s a call to action:

     To the teachers who sit at the heart of this work, please know that
     you’re valued and that you are not alone. This community has
     declared itself collectively responsible for the educational outcomes
     of our children, and we stand with you.

20
You can also read