2017 Canadian data update - John Nelligan Senior Vice President, Product Management and Client Services Sandra Albanese Research Director ...
←
→
Page content transcription
If your browser does not render page correctly, please read the page content below
2017 Canadian data update

John Nelligan
Senior Vice President, Product Management and Client Services

Sandra Albanese
Research Director, Demographic Data

April 27, 2017
Agenda
•   Introductions and Housekeeping
•   2017 Demographic Highlights
•   2017 Data Update
•   What’s Coming
•   Questions

2                   © 2017 Environics Analytics
Today’s presenters

    Sandra Albanese                                   John Nelligan
    Research Director                                 Senior Vice President
    Demographic Data                                  Product Management and Client
                                                      Services

3                       © 2017 Environics Analytics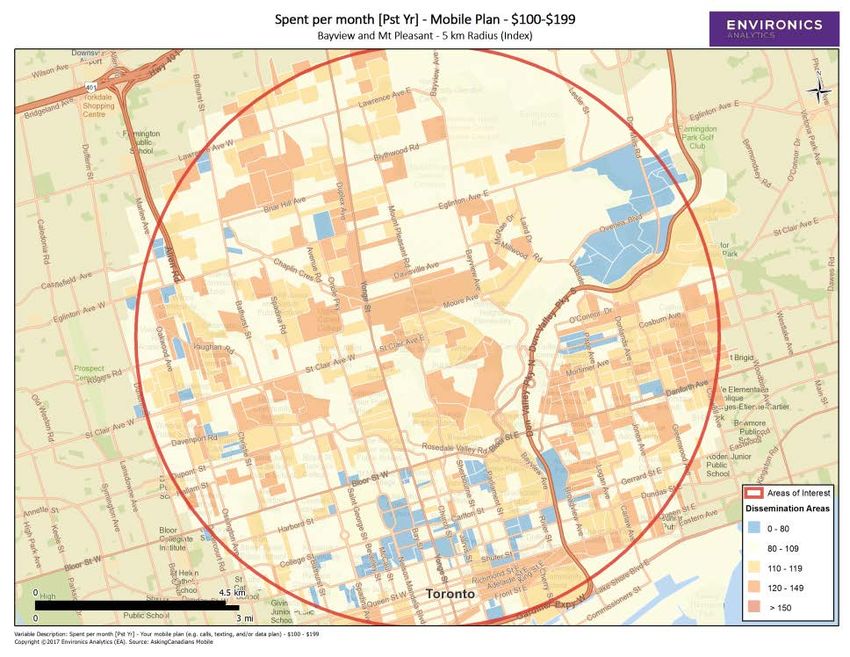
housekeeping
•   Listen-only
•   Use the Q&A feature in your WebEx interface
•   Technical difficulties? 1-866-229-3239
•   Presentation and recording will be available at:
               environicsanalytics.com/webcasts

4                    © 2017 Environics Analytics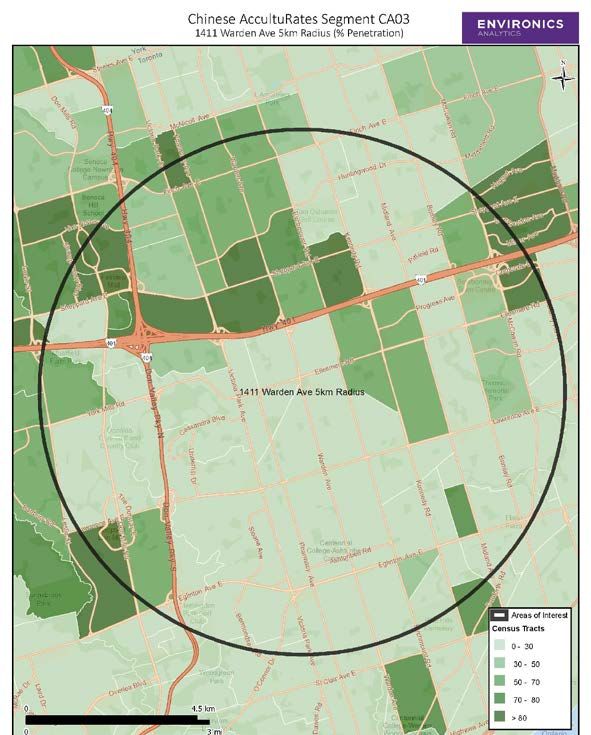
2017 Canadian data update

    • POPULATION CHANGE

    • SHIFT IN HOUSING

    • ECONOMIC OUTLOOK

    • CULTURAL DIVERSITY

5               © 2017 Environics Analytics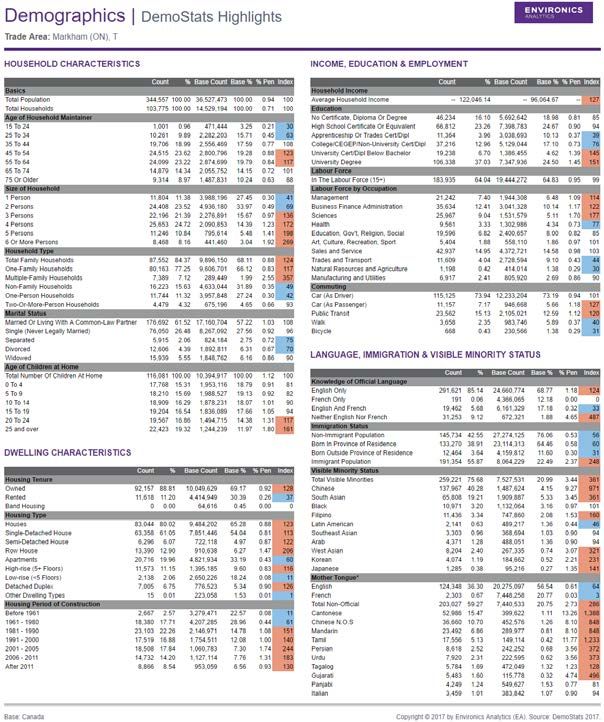
Population Change
 40 million over the next decade
45,000                                                                                                                                             2.00%
                                                                       Estimates            Projections
40,000                                                                                                                                             1.80%

35,000
                                                                                                                                                   1.60%
      POPULATION IN THOUSANDS

30,000

                                                                                                                                 % ANNUAL CHANGE
                                                                                                                                                   1.40%

25,000
                                                                                                                                                   1.20%
20,000

                                                                                                                                                   1.00%
15,000

                                                                                                                                                   0.80%
10,000

 5,000                                                                                                                                             0.60%

      0                                                                                                                                            0.40%
                       2006 2007 2008 2009 2010 2011 2012 2013 2014 2015 2016 2017 2018 2019 2020 2021 2022 2023 2024 2025 2026 2027
                                                                Population                Population Change

  6                                                         © 2017 Environics Analytics
Population Change
  Growth by region
                 14.00%

                 12.00%

                 10.00%

                  8.00%
Percent Change

                  6.00%

                  4.00%

                  2.00%

                  0.00%
                          Atlantic   Quebec        Ontario             Manitoba       Saskatchewan   Alberta   BC   Territories

                 -2.00%
                                              2006-2011        2011-2017           2017-2022   2022-2027

       7                                             © 2017 Environics Analytics
Population Change
Census metropolitan areas: top growers
                 0.0%   2.0%   4.0%           6.0%                  8.0%       10.0%     12.0%   14.0%   16.0%     18.0%

      Calgary (AB)                                                                                               16.7%

Saskatoon (SK)                                                                                                   16.6%

Edmonton (AB)                                                                                            15.3%

      Regina (SK)                                                                                13.4%

     Toronto (ON)                                                           8.8%

Winnipeg (MB)                                                               8.7%

     Oshawa (ON)                                                           8.5%

Vancouver (BC)                                                         8.2%

Hamilton (ON)                                               6.9%

Montréal (QC)                                               6.8%

                                              2011-2017        2017-2022     2022-2027

 8                                    © 2017 Environics Analytics
Population Change
Census metropolitan areas: decliners
-7.5%       -6.5%      -5.5%           -4.5%                  -3.5%     -2.5%         -1.5%             -0.5%   0.5%

    -7.1%                                                                             Prince Rupert (BC)
                    -5.5%                                                              Cape Breton (NS)
                            -4.9%                                                             Bathurst (NB)
                            -4.9%                                                       Port Alberni (BC)
                               -4.6%                                                     Elliot Lake (ON)
                                -4.6%                                                 Williams Lake (BC)
                                                       -3.5%                          New Glasgow (NS)
                                                        -3.5%                           Powell River (BC)
                                                        -3.5%                            Miramichi (NB)
                                                         -3.4%                      Campbellton (NB/QC)

                                    2011-2017               2017-2022   2022-2027

9                                      © 2017 Environics Analytics                             17/04/2015
Population Change
smaller sized cities: western growth
          Okotoks (AB)                                  21.3%           Midland (ON)                                6.3%

      Collingwood (ON)             12.0%                         North Battleford (SK)                          5.3%

  Lloydminster (SK/AB)             11.8%                          Campbell River (BC)                          4.9%

         Squamish (BC)            10.6%                              Yellowknife (NT)                          4.9%

       Whitehorse (YT)        9.6%                                    Cranbrook (BC)                         4.4%

         Cobourg (ON)       7.4%                                    Fort St. John (BC)                   4.1%

     Saint-Georges (QC)    7.0%                                           Brooks (AB)                  3.7%

         Parksville (BC)   7.0%                                      Salmon Arm (BC)                  3.5%

Centre Wellington (ON)     6.8%                                     Swift Current (SK)                3.4%

          Camrose (AB)     6.4%                                          Kenora (ON)                  3.3%

10                                 © 2017 Environics Analytics                           17/04/2015
Population Change
smaller sized cities: western growth
0.0% 5.0% 10.0% 0.0% 2.0% 4.0% 6.0%
Okotoks (AB) Midland (ON)
Collingwood (ON) North Battleford (SK)
Lloydminster (SK/AB) Campbell River (BC)
Squamish (BC) Yellowknife (NT)
Whitehorse (YT) Cranbrook (BC)
Cobourg (ON)
Fort St. John (BC)
Saint-Georges (QC)
Brooks (AB)
Parksville (BC)
Salmon Arm (BC)
Centre Wellington (ON)
Swift Current (SK)
Camrose (AB)
Kenora (ON)
2017-2022 2022-2027
11 © 2017 Environics Analytics 17/04/2015Housing changes
Building permits shift
130,000
120,000
Number of Building Permits
110,000
100,000
90,000
80,000
70,000
60,000
50,000
2006 2007 2008 2009 2010 2011 2012 2013 2014
Singles Family Homes Multiple Family Units
Source: Statistics Canada
12 © 2017 Environics AnalyticsHousing changes
SHIFT in Dwelling type
1.50%
Estimates Projections
1.00%
0.50%
Change in Percent
0.00%
2011 2013 2015 2017 2019 2021 2023 2025 2027
-0.50%
-1.00%
-1.50%
House Apartment
13 © 2017 Environics Analytics 17/04/2015Housing changes
Tenure stable
80.0%
70.0%
60.0%
50.0%
40.0%
30.0%
20.0%
10.0%
0.0%
2006 2011 2017 2022 2027
Owned Rented
14 © 2017 Environics Analytics 17/04/2015ECONOMIC OUTLOOK
National Household Income TRENDS
7%
Recession Forecasts
6%
5%
4% Nominal Income
3%
2%
1%
Real Income
0%
2007
2008
2009
2010
2011
2012
2013
2014
2015
2016
2017
2018
2019
2020
2021
2022
2023
2024
2025
2026
2027
-1%
-2%
-3%
15 © 2017 Environics Analytics5-Year Income Changes
Annualized Growth Rate of Nominal Income per Household (Pop 19+)
4.0%
3.0%
2.0%
1.0%
0.0%
Canada BC AB SK MB ON QC Atlantic Territories
4.0%
3.0%
2.0%
1.0%
0.0%
Toronto Montréal Vancouver Calgary Ottawa Edmonton Québec Winnipeg St. John's
Δ 2012 - 2017 Δ 2017 - 2022
16 © 2017 Environics Analytics5-Year Employment Changes
Employed per Household (Pop 15+)
75%
70%
65%
60%
55%
50%
Canada BC AB SK MB ON QC Atlantic Territories
2012 2017 2022 2022
75%
70%
65%
60%
55%
50%
Toronto Montréal Vancouver Calgary Ottawa Edmonton Québec Winnipeg St. John's
2012 2017 2022 2027
17 © 2017 Environics AnalyticsCultural diversity
Immigration – steady growth
Estimates Projections
5.00
10,000 4.50
4.00
TOTAL IMMIGRANTS IN 000S
8,000
3.50
ANNUAL CHANGE (%)
3.00
6,000
2.50
2.00
4,000
1.50
2,000 1.00
0.50
0 0.00
2006
2007
2008
2009
2010
2011
2012
2013
2014
2015
2016
2017
2018
2019
2020
2021
2022
2023
2024
2025
2026
2027
Total Immigrants Annual Percent Change
18 © 2017 Environics Analytics 17/04/2015Cultural diversity
Immigration – top 10 countries of birth
Percent Change
Country of Birth % of Immigrants
2011-2017
India 2.19% 0.54%
China 1.99% 0.32%
Philippines 1.79% 0.52%
UK 1.41% -0.19%
USA 0.76% -0.02%
Italy 0.68% -0.12%
Pakistan 0.64% 0.15%
Iran 0.56% 0.20%
Hong Kong 0.54% -0.08%
Vietnam 0.49% 0.01%
19 © 2017 Environics AnalyticsCultural diversity
Immigration – top 10 countries of birth (2017-2027)
1.10%
0.90%
0.70%
2017-2027 Change in Percent
0.50%
0.30%
0.10%
-0.10% India China Phillipines UK USA Italy Pakistan Iran Hong Vietnam
Kong
-0.30%
-0.50%
20 © 2017 Environics AnalyticsCultural diversity
Immigration – regional variation
12.00%
10.00%
8.00%
Percent Change
6.00%
4.00%
2.00%
0.00%
2011-2017
21 © 2017 Environics Analytics 17/04/2015Cultural diversity
Immigration – growth in smaller cities
Change in %
Census Metropolitan Area % Immigrants Immigrants
2011-2017
Brandon (MB) 22.85% 11.0%
Charlottetown (PE) 17.25% 9.4%
Wood Buffalo (AB) 21.75% 7.0%
Saskatoon (SK) 16.99% 6.1%
Steinbach (MB) 28.46% 5.8%
Regina (SK) 15.45% 4.9%
Winnipeg (MB) 24.94% 4.5%
Canmore (AB) 18.33% 3.5%
Calgary (AB) 28.58% 3.3%
Montréal (QC) 25.49% 3.1%
Edmonton (AB) 22.25% 2.8%
North Battleford (SK) 10.41% 2.5%
Vancouver (BC) 42.48% 2.5%
Brooks (AB) 18.09% 2.5%
Red Deer (AB) 13.20% 2.4%
Thompson (MB) 9.95% 2.4%
Toronto (ON) 47.75% 2.2%
Prince Albert (SK) 6.44% 2.1%
High River (AB) 15.43% 2.0%
Yellowknife (NT) 13.29% 2.0%
Lethbridge (AB) 13.99% 2.0%
Wetaskiwin (AB) 13.71% 1.9%
Whitehorse (YT) 13.67% 1.8%
Abbotsford - Mission (BC) 25.22% 1.7%
Ottawa - Gatineau (QC/ON) 20.00% 1.6%
Yorkton (SK) 6.10% 1.5%
Grande Prairie (AB) 8.44% 1.5%
22 © 2017 Environics AnalyticsCultural diversity
Immigration – growth in smaller cities
Change in %
Census Metropolitan Area % Immigrants Immigrants
2011-2017
Brandon (MB) 22.85% 11.0%
Charlottetown (PE) 17.25% 9.4%
Wood Buffalo (AB) 21.75% 7.0%
Saskatoon (SK) 16.99% 6.1%
Steinbach (MB) 28.46% 5.8%
Regina (SK) 15.45% 4.9%
Winnipeg (MB) 24.94% 4.5%
Canmore (AB) 18.33% 3.5%
Calgary (AB) 28.58% 3.3%
Montréal (QC) 25.49% 3.1%
Edmonton (AB) 22.25% 2.8%
North Battleford (SK) 10.41% 2.5%
Vancouver (BC) 42.48% 2.5%
Brooks (AB) 18.09% 2.5%
Red Deer (AB) 13.20% 2.4%
Thompson (MB) 9.95% 2.4%
Toronto (ON) 47.75% 2.2%
Prince Albert (SK) 6.44% 2.1%
High River (AB) 15.43% 2.0%
Yellowknife (NT) 13.29% 2.0%
Lethbridge (AB) 13.99% 2.0%
Wetaskiwin (AB) 13.71% 1.9%
Whitehorse (YT) 13.67% 1.8%
Abbotsford - Mission (BC) 25.22% 1.7%
Ottawa - Gatineau (QC/ON) 20.00% 1.6%
Yorkton (SK) 6.10% 1.5%
Grande Prairie (AB) 8.44% 1.5%
23 © 2017 Environics AnalyticsSUMMARY • Canada population estimate for 2017 is 36.5 million • Canada will grow to just over 40 million by 2027 • Population growth is stronger in the west than the east • Housing shift towards multi-family dwelling units • Given current economic conditions, we expect steady, but slow, growth in the Canadian economy • Top three immigrant groups are still growing • Immigrant growth is occurring in smaller cities 24 © 2017 Environics Analytics
2017 data update

25             © 2017 Environics Analytics
2017 DATA Update
More than 30 data products updated and/or enhanced
          SPRING RELEASE                       SPECTRA RELEASE         FINANCIAL RELEASE
     Demographics                    Geography                   Financial
     • DemoStats                     • Spectra Trade Areas       • HouseholdSpend
     • DaytimePop                    Segmentation                • FoodSpend
     • AccultuRates                  • PRIZM5 Spectra            • AgeByIncome
     • CrimeStats                    Behavioural                 • WealthScapes
     • Neighbourhood View™           • Homescan                  • WealthScapes Lite
     Segmentation                    Business/Location           • WealthScapes Daytime
     • PRIZM5                        • TDLinx                    • WealthScapes Fundraiser
     • DELTA5                                                    • LiquidAssets
     • PRIZM5 QC                     ENVISION5 - Spectra
     Psychographic                                               Behavioural
     • SocialValues                                              • TravelCanada
     Behavioural                                                 • CommunityLife
     • MoneyMatters                                              • GreenLiving
     • Numeris                                                   • GivingBack
     • Vividata
     • AskingCanadians™ Mobile
     • AskingCanadians™ Social
     • AskingCanadians® eShopper
     • IHS Automotive
     • CommunityHealth
     Business/Location
     • BusinessProfiles
     • Businesses
     • Shopping Centres
     • TrafficCounts
     • Points of Interest
26                                 © 2017 Environics Analytics
demographic
DemoStats: authoritative today and 10 years into the future
What it is
• Current-year estimates for 760 variables
• Projections for 486 of those variables for 3, 5 and 10 years into the future
How it’s used
• Market Intelligence
• Site Analysis
• Consumer Insights
• Target Group Creation
• Personification
• List Rentals
ENVISION 5 Sample Demographic
Reports
27 © 2017 Environics Analyticsdemographic
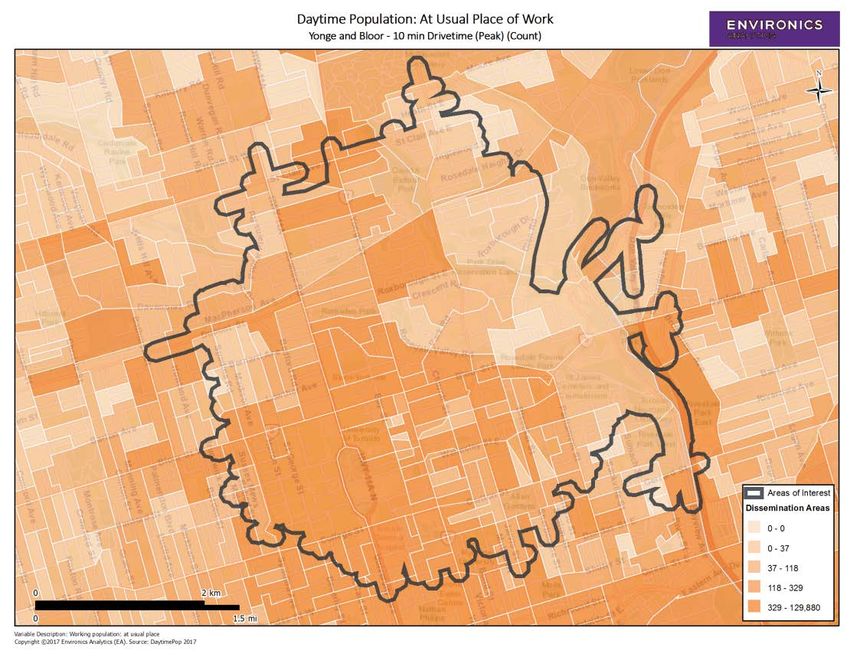
Daytimepop: calculates customers during daytime to determine
demand and reach
What it is
• Estimate of the population that’s
reachable in any geographic area
during daytime hours
• Consists of ten variables
• Provides a breakdown of
populations at home and at
work.
How it’s used
• Market Intelligence
• Consumer Insights
• Location Analysis
28 © 2017 Environics Analyticsdemographic AccultuRates: Helps users understand the diversity within diverse populations What it is Identifies six levels of acculturation within Canada’s two largest visible minority groups: Chinese and South Asian populations. How it’s used • Market Intelligence • Messaging • Consumer Insights • Personification • Cultural Marketing • List Rentals 29 © 2017 Environics Analytics
segmentation

30             © 2017 Environics Analytics
Segmentation
PRIZM5: Canada’s most popular segmentation system
What it is
Segmentation system that classifies Canada’s
neighbourhoods into 68 unique lifestyle types—down to the
postal code level.

How it’s used
•    Consumer Insights
•    Target Group Creation
•    Personification
•    Messaging
•    Brand Strategy

31                                  © 2017 Environics Analytics
Segmentation
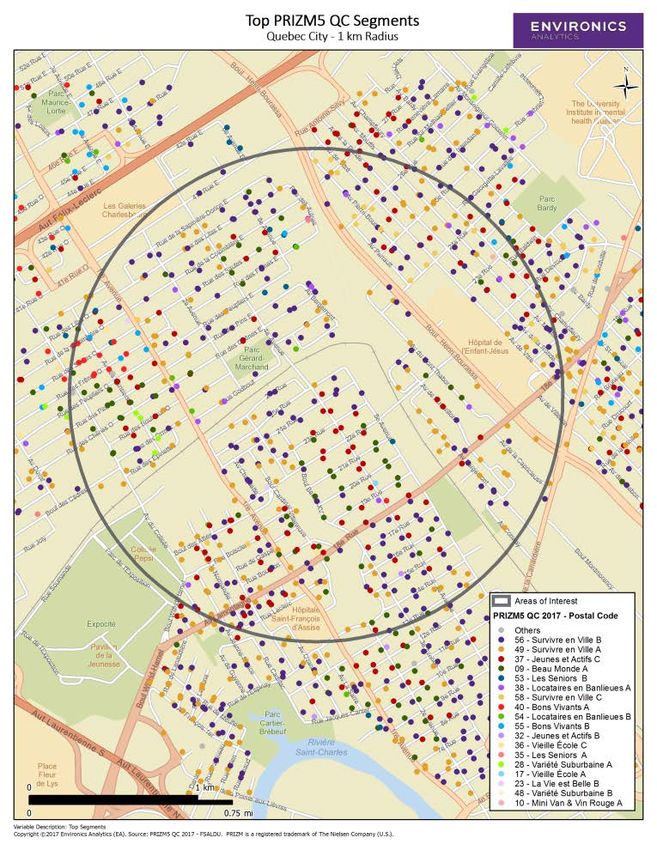
PRIZM5 QC: captures unique qualities of Quebec lifestyles
What it is
• Extension of PRIZM5
• Designed to assist
companies in better
understanding the
Quebec marketplace
• 58 segments at the
postal code level
How it’s used
• Consumer Insights
• Target Group Creation
• Personification
• Messaging
• Brand Strategy
32 © 2017 Environics AnalyticsSegmentation
DELTA5: more segments for finer analysis
What it is
• Segmentation system consisting of
150 segments at the postal code
level
• Based on key dimensions such as
age, income, education, marital
status and dwelling type
How it’s used
• Consumer Insights
• Target Group Creation
• Personification
• Messaging
• Brand Strategy
33 © 2017 Environics AnalyticsFINANCIAL 34 © 2017 Environics Analytics
Financial
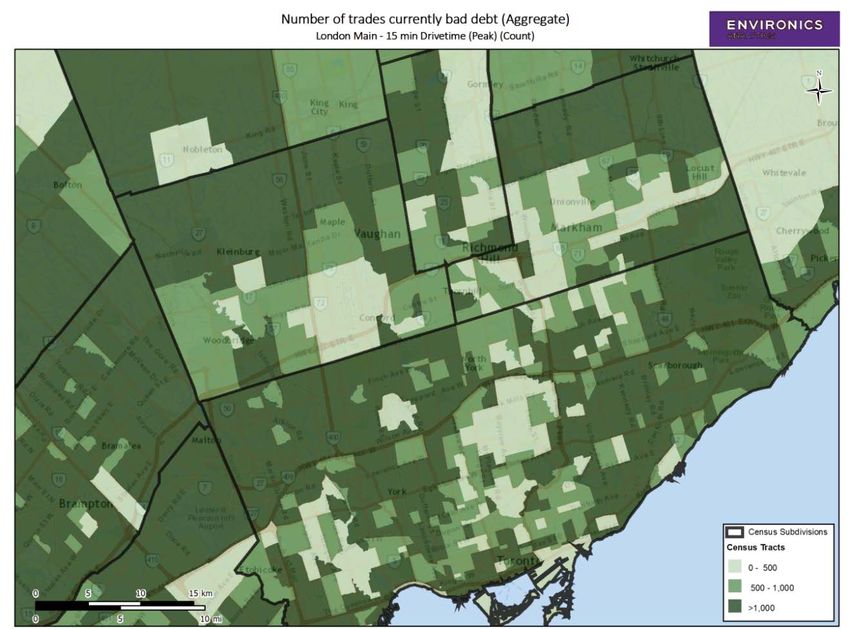
Neighbourhood View™: privacy-compliant, aggregated credit data
What it is
• Privacy-compliant, aggregated credit data from Equifax Canada
• Data has been grouped into four separate modules
• Age, Balance, Credit, Delinquency
• Debt Type
• Credit Risk
• Mortgages
• Postal Code, DA and above
How it’s used
• Market Intelligence
• Consumer Insights
• Personification
• Risk Analysis
• Financial Analysis
• Product Promotion
35 © 2017 Environics AnalyticsFinancial MoneyMatters: Leading source for consumer financial data What it is • MoneyMatters Powered by Canadian Financial Monitor • National coverage of 1,852 variables • 14 data categories • Provides consumer information on personal banking, investments, credit and insurance • Postal Code, DA and above How it’s used • Market Intelligence • Consumer Insights • Target Group Creation • Personification • Product Development • Product Promotion • Competitive Analysis 36 © 2017 Environics Analytics
Psychographic, HEALTH and opticks

37              © 2017 Environics Analytics
Psychographic
SocialValues: Surveying the Canadian mindset annually since 1983
What it is
•    Measures human motivation
     and social relations
•    242 variables encompassing
     94 values/trends and 147
     attitudes
•    Postal code, DA and above

How it’s used
•    Consumer Insights
•    Target Group Creation
•    Personification
•    Messaging
•    Brand Strategy

38                                © 2017 Environics Analytics
Health
communityHealth: Understanding the health of canadians
What it is
• Based on Canadian Community Health
Survey administered by Statistics
Canada
• 582 variables
• Health-related topics: including
ailments, health care utilization, self-
esteem and fitness level
• Postal code, DA and above
How it’s used
• Market Intelligence
• Consumer Insights
• Target Group Creation
• Personification
• Differentiated Messaging
• Resource Allocation
• Community Outreach
39 © 2017 Environics AnalyticsOpticks
Vividata: details traditional and new media usage—and more
What it is
• Canada’s leading syndicated
study for single-source data on
print readership, non-print media
exposure, product usage and
lifestyles
• 4,103 variables
• Postal code, DA and above
How it’s used
• Market Intelligence
• Consumer Insights
• Target Group Creation
• Personification
• Differentiated Messaging
• Media Planning
• Brand Strategy
40 © 2017 Environics AnalyticsOpticks
Numeris: authoritative data on lifestyle and media preferences
What it is
• Numeris: Leading supplier of radio and
television audience ratings services to the
Canadian broadcast advertising industry
• Numeris RTS (Return to
Sample): National survey on
product consumption,
leisure activities, retail
behaviour and media habits
• 3,000+ variables
• Postal Code, DA and above
How it’s used
• Market Intelligence
• Consumer Insights
• Target Group Creation
• Personification
• Differentiated Messaging
• Media Planning
• Brand Strategy
41 © 2017 Environics AnalyticsOpticks
Askingcanadians™: offers insights into Canadians’ online, social and
mobile behaviour
What it is
• AskingCanadians™ eShopper: 613 variables covering
wide range of online shopping behaviour—from
product research to purchase preferences
• AskingCanadians™ Mobile: 825 variables
on mobile ownership, usage of devices,
features and consumer attitudes
• AskingCanadians™ Social Media:
600 variables detailing social media
behaviour for all segments of
Canadian society
How they’re used
• Market Intelligence
• Consumer Insights
• Target Group Creation
• Personification
• Differentiated Messaging
• Brand Strategy
42 © 2017 Environics AnalyticsBusiness and LocationWare 43 © 2017 Environics Analytics
business
BusinessProfiles: Details the competitive landscape for effective
business strategies
What it is
•    Based on infoCanada data
•    BusinessProfiles: 129 variables covering over 1.2 million Canadian businesses by SIC or
     NAICS code, employee size range and sales volumes

How it’s used
•    Market Intelligence
•    Competitor Analysis
•    Site Planning
•    Merchandising
•    Optimizing store layouts
•    Targeting business prospects

44                                      © 2017 Environics Analytics
LOCATIONWare
valuable data for evaluating competitive landscape and specific sectors
What it is
This suite of data products features geocoded location files from infoCanada, Rogers Publishing,
Kalibrate and TomTom.
Businesses Shopping centres
infoCanada Rogers Publishing
1.2 million records 3,124 records
Points of interest Trafficcounts
TomTom Kalibrate
1.2 million records 73,250 records
22 variables
45 © 2017 Environics AnalyticsWhat’s coming 46 © 2017 Environics Analytics
2017 DATA Update
SPECTRA Products—and more—to be released in june                               June

        CensusPlus                          PRIZM5
                                            DELTA5          CommunityHealth
        DemoStats
        DaytimePop                          PRIZM5 QC
        AccultuRates           SPECTRA
        CrimeStats             PRIZM5 Spectra
                                                           BusinessProfiles
                               Homescan
                                    SocialValues           BusinessProfiles Lite
                               TDLinx
                               ENVISION5 Spectra

     MoneyMatters          Numeris
     Neighbourhood View    Vividata (PMB/NADbank)       Businesses
     HouseholdSpend        AskingCanadians Mobile       Shopping Centres
     FoodSpend             AskingCanadians Social       TrafficCounts
     AgebyIncome           AskingCanadians eShopper     Points of Interest
     WealthScapes          IHS Automotive Services
     WealthScapes Lite
     LiquidAssets
47                        © 2017 Environics Analytics
questions?
John Nelligan
Sandra Albanese Senior Vice President, Product Management
Research Director, Demographic Data and Client Service
sandra.albanese@environicsanalytics.com john.nelligan@environicsanalytics.com
environicsanalytics.com/webcasts
© 2017 Environics AnalyticsYou can also read