1Q22 results Investor and analyst update - 18th May 2022 - Banpu

Page created by Tracy Horton
 
CONTINUE READING
1Q22 results Investor and analyst update - 18th May 2022 - Banpu
1Q22 results
Investor and analyst update
18th May 2022
1Q22 results Investor and analyst update - 18th May 2022 - Banpu
DISCLAIMER

The information contained in this presentation is intended solely for your reference.

This presentation contains “forward-looking” statements that relate to future events, which are, by their nature, subject to significant risks and uncertainties.
All statements, other than statements of historical fact contained in this presentation including, without limitation, those regarding Banpu’s future financial
position and results of operations, strategy, plans, objectives, goals and targets, future developments in the markets where Banpu participates or is seeking
to participate and any statements preceded by, followed by or that include the words “believe”, “expect”, “aim”, “intend”, “will”, “may”, “project”, “estimate”,
“anticipate”, “predict”, “seek”, “should” or similar words or expressions, are forward-looking statements.

The future events referred to in these forward-looking statements involve known and unknown risks, uncertainties and other factors, some of which are
beyond our control, which may cause the actual results, performance or achievements, or industry results to be materially different from any future results,
performance or achievements expressed or implied by the forward-looking statements.

These forward-looking statements are based on numerous assumptions regarding our present and future business strategies and the environment in which
Banpu will operate in the future and are not a guarantee of future performance. Such forward-looking statements speak only as of the date on which they
are made. Banpu does not undertake any obligation to update or revise any of them, whether as a result of new information, future events or otherwise.
The information set out herein is subject to change without notice, its accuracy is not guaranteed, has not been independently verified and it may not
contain all material information concerning the Company.

Banpu makes no representation, warranty or prediction that the results anticipated by such forward-looking statements will be achieved, and such forward-
looking statements represent, in each case, only one if many possible scenarios and should not be viewed as the most likely or standard scenario. No
assurance given that future events will occur or our assumptions are correct. Actual results may materially differ from those provided in the forward-looking
statements and indications of past performance are not indications of future performance. In no event shall Banpu be responsible or liable for the
correctness of any such material or for any damage or lost opportunities resulting from use of this material. Banpu makes no representation whatsoever
about the opinion or statements of any analyst or other third party. Banpu does not monitor or control the content of third party opinions or statements and
does not endorse or accept any responsibility for the content or use of any such opinion or statement.

Banpu’s securities have not been and will not be registered under the U.S. Securities Act of 1933, as amended, or the securities laws of any state of the
United States, and may not be offered or sold within the United States, except pursuant to an exemption from, or in a transaction not subject to, the
registration requirements of such act or such laws.

This presentation does not constitute an offer to sell or a solicitation of an offer to buy or sell Banpu’s securities in any jurisdiction.

                                                                                                                                                                    2
1Q22 results Investor and analyst update - 18th May 2022 - Banpu
Highlights   Antifragile      Financial   Energy      Energy       Energy
1Q22         Transformation   Summary     Resources   Generation   Technology

                                                                                3
1Q22 results Investor and analyst update - 18th May 2022 - Banpu
1Q22 highlights

                                             Robust Cash Flow Generation               ESG Leadership Recognition
                                              EBITDA for the quarter was $596M
     Accelerating Banpu’s                                                             ESG leadership recognitions across
                                               with strong contribution from Coal      the Banpu Group, with initiatives
  Sustainability Transformation               and Gas businesses and significant         being implemented to further
 Significant progress in Greener, Smarter        incremental contribution from         decarbonize the existing portfolio
  businesses through developments in:                   Greener assets

         Vietnam, Japan, Thailand,
         and Indonesia Renewables
         +105 MW committed capacity
         from acquisitions of 2 solar
         assets and Solar ESCO rooftop            Energy Prices Strong                  Growing Vietnam Presence
         platform in Vietnam; completion
         of 1 asset in Japan; rooftop and    Gas price averages $4.66/MMBtu and           Banpu has established a strong
         floating solar in Thailand; and 1   coal price averages at $275/t in 1Q22,   presence in Vietnam with a renewable
         solar rooftop in Indonesia.           driven by increasing demand and          portfolio of over 280 MW committed
                                                         supply tightness              capacity across various technologies

                                                                                                                              4
1Q22 results Investor and analyst update - 18th May 2022 - Banpu
Banpu: international versatile energy provider
       ENERGY RESOURCES        ENERGY GENERATION       ENERGY TECHNOLOGY

      NATURAL GAS EXTRACTION    GAS-FIRED            BATTERY
                                 POWER              PRODUCTION

      COAL MINING                                        EV
                               COAL-FIRED
                                 POWER             MANUFACTURING
                                                      & SALES

                                                                           E-FERRY / E-BOAT

                               RENEWABLES
                                                    MOBILITY AS
                                                     A SERVICE
      SOLAR EPC
       AND O&M

                                                                  CAR SHARING

     SMART CITY &
                               ENERGY                             RIDE HAILING
       ENERGY
                               TRADING
     MANAGEMENT
                                                                  EV CHARGING

                                                                                              5
1Q22 results Investor and analyst update - 18th May 2022 - Banpu
Banpu: ESG leadership and credit rating recognition

                                                                                                                                         In 2021, BPP demonstrated high ESG standards
                                                                                                                                         through sustainable and responsible operations

                                                                                                                                                          S&P SUSTAINABILITY
                                                                                                                                                          YEARBOOK MEMBER

                                                                                                                                                          RISING STAR
                                                                                                                                                          SUSTAINABILITY AWARD

      rating for third consecutive                    class distinction, the only                Recognized as one of the top                             4TH YEAR LISTED IN THSI
      year for demonstrating                          company in the industry                    100 Best Emerging Market
      resiliency towards long-term                    out of 29 companies                        Performers, out of a universe
      ESG risks and excellent risk                    being assessed to                          of 843 companies from 31
      management and mitigation                       achieve the award                          different countries
      relative to peers                                                                                                                                   AWARDED RESPONSIBLY
                                                                                                                                                          SOURCED GAS (RSG)
                                                                                                                                                          CERTIFICATION
                                                                                                                                                          WITH GOLD RATING
                                                                                                                                                          by Project Canary TrustWell, a
                                                                                                                                                          3rd party certification company

consecutive year included            for Sustainability                 consecutive year in the          Highest distinction in SET’s
as a constituent of DJSI for         Reporting Award in 2021            THSI for sustainable             Sustainability Excellence         ratings with a ‘stable’ outlook on
conducting business with             for transparent disclosure         operations and responsible       Award for being awarded the     the company and senior unsecured
the highest ESG standards            of ESG information                 investment principles            Best Sustainability Award for          debentures reflecting the
                                                                                                         at least 3 consecutive years     company’s stable business growth

                                                                                                                                                                                            6
1Q22 results Investor and analyst update - 18th May 2022 - Banpu
Highlights   Antifragile      Financial   Energy      Energy       Energy
1Q22         Transformation   Summary     Resources   Generation   Technology

                                                                                7
1Q22 results Investor and analyst update - 18th May 2022 - Banpu
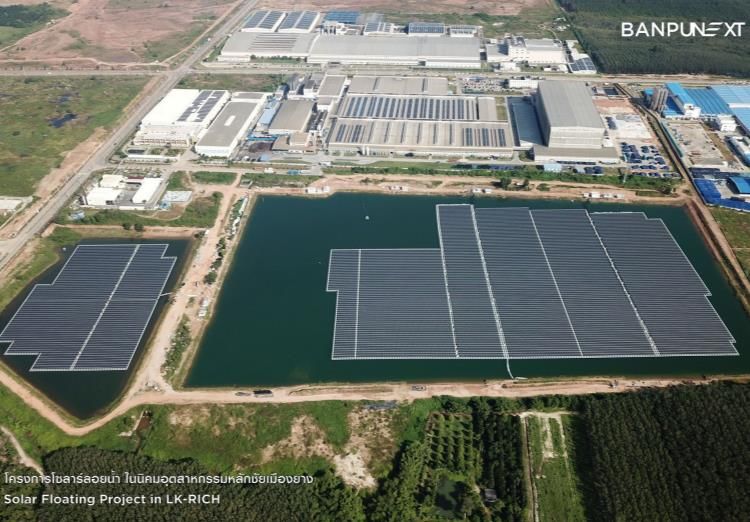
Supply chain disruptions driving commodity prices higher into 2022
GLOBAL MARKET UPDATES                                                                  COMMODITY PRICES RALLY EXTENDS IN 1Q22
                                                                                       MONTHLY NEWCASTLE COAL INDEX                   Prices as of April 2022
      Tension over Russia – Ukraine war                                                Unit: US$/t                                            $318/t
                                                                                        350
      RELIANCE ON RUSSIA’S NATURAL RESOURCES
                                                                                        300
      45%      of Europe’s coal and gas imports       Russia’s invasion of              250
                                                      Ukraine shocked global            200
      17%      of global coal production
                                                      markets, causing global           150
                                                      supply chain disruptions          100
      10%      of global oil production
                                                                                         50
                                                                                                                                            5-year average:
                                                                                                                                                $100/t
                                                                                          0
      Inflation, interest rate hikes, potential recession?                             MONTHLY HENRY HUB PRICE
      INFLATION RATE                      INTEREST RATE HIKES                          Unit: US$/MMBtu
                                                                                                                                          $6.60/MMBtu
      US consumer price                   The Fed approved a 0.25% rate hike             7
      reached 40-year highs               in March 2022. Fed policymakers                5
                                          expect interest rate to climb to around
      6.8%            8.5%                1.9% by the end of the year to                 3
       Nov’ 2021      Mar’ 2022                                                                                                             5-year average:
                                          address the significant rise in inflation.                                                         $2.98/MMBtu
                                                                                         1

      Resurgence of Covid-19                                                             -1
      While the world has been readjusting to the ‘New Normal’,                        MONTHLY BRENT PRICE
      outbreaks continue to occur in China’s manufacturing hub                         Unit: US$/bbl                                        $105/bbl
      and several European countries, leading to shut down.
                                                                                       100

      Rising commodity supply costs
      Commodity productions are impacted by labor shortages due to                      50                                                   5-year average:
                                                                                                                                                 $59/bbl
      Covid-19 pandemic. Increasing oil prices are further affecting
      coal production costs mostly due to higher mining and                              0
      transportation costs as well as higher royalty payment.                             2016         2017   2018   2019   2020   2021      2022
                                                                                                                                                                8
1Q22 results Investor and analyst update - 18th May 2022 - Banpu
Banpu: antifragile portfolio
                ENERGY                                             ENERGY                                          ENERGY
              RESOURCES                                         G E N E R AT I O N                               TECHNOLOGY
              GROWTH CATALYST                         RESPONSIBLE BASE LOAD PROVIDER                        CAPTURING ENERGY TRENDS
   Well-positioned through existing production and   Maintain operational excellence, cost controlling    Scale up portfolio by growing existing and
    reserves to capture upside from the market           measures and expand HELE portfolio               investing into new disruptive businesses

    MINING                                            THERMAL                                            TECHNOLOGY

    GAS                                               RENEWABLES                                         E V, B AT T E R Y, E M S

         CLEANER FUEL TRANSITION                          GREEN MEGAWATTS GROWTH                           ESTABLISH DIGITAL PLATFORM
      Expand lower-carbon gas upstream and               Expand renewables assets, focusing on            Continued development of Banpu platform
      midstream portfolio in strategic locations     geographies with favorable and stable conditions              to consolidate services
                                                                                                                                                       9
1Q22 results Investor and analyst update - 18th May 2022 - Banpu
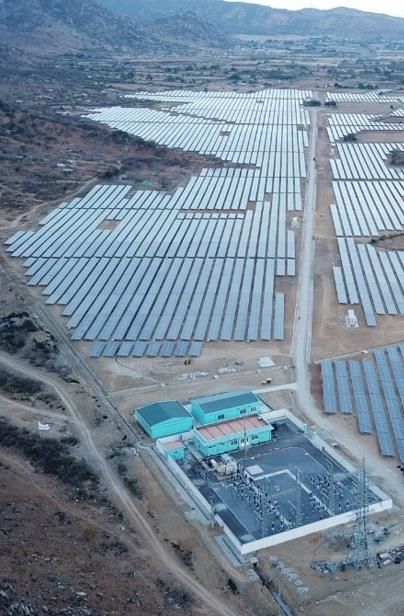
Banpu portfolio strategy 2022-25
                                                                                    NEW DISRUPTIVE
        NTIFRAGILE

    A   Weathering impacts of volatile commodity markets and
        global disruptions, while well-positioned to capture upside
                                                                                   GROWTH MARKETS
                                                                              Explore antifragile growth opportunities
                                                                              in new S-curve disruptive industries to
                                                                              position Banpu for transformative and
   ENERGY                     ENERGY                           ENERGY         diversified growth
 RESOURCES                 G E N E R AT I O N                TECHNOLOGY
                                                                                     4 . 0 Te c h nol o gy

                                                                                     S m a r t Ag r i c u l t ur e

                                                                                     H e a l t hcar e

                                                                              A
                                                                                     UGMENTATION
                    G R E E N E R , S M A RT E R T R A N S F O R M AT I O N          Utilizing expertise and core
                                                                                     competencies to capitalize on

    A
        CCELERATION                                                                  new business opportunities
        Leveraging high commodity price landscape to accelerate Greener,
        Smarter transformation and invest in new disruptive growth markets

                                                                                                                         10
Highlights   Antifragile      Financial   Energy      Energy       Energy
1Q22         Transformation   Summary     Resources   Generation   Technology

                                                                                11
Banpu consolidated financial summary 1Q22

                                              KEY FIGURES                                  KEY TAKEAWAYS

                                                                         1   Strong Coal business performance: from solid
              EBITDA                                          $596 M         production volume and higher ASP, compared to
                                                                             relatively strong levels of 4Q21, driven by strong
              Strong result driven by Coal and Gas                           demand and supply tightness
              business contribution, supported by
              commodity price levels. Stable contribution
                                                                             Robust Core Gas business contribution:
              from Power and other businesses.                           2
                                                                             supported by high average local price* levels and
                                                                             stable production volumes
              NPAT                                              $311 M
              Strong performance, with strong                                Strategic positioning: Coal and Gas businesses
                                                                         3
              EBITDA generation and improved                                 well-positioned to benefit from current commodity
              operational results                                            price levels and demand

              ND/E                                              1.10 x
              ND/E improved from 1.31x in the                            4   Greener, Smarter investments: cashflow generation
              previous quarter                                               captured from Greener Investments including: Nakoso
                                                                             IGCC, Australia Solar, Temple I CCGT, Japan Solar,
                                                                             Vietnam Wind and Vietnam Solar in the near-term

Note: *Average local price = Henry Hub - basis differential                                                                        12
Banpu consolidated sales revenues – 1Q22

                   USD million                                                                         -12% QoQ
                                                                                                       +71% YoY

                                                                                       1,427
                                                                                        48             Others*
                                                                                        102    1,256   +28% QoQ
                                                                                                61     +52% YoY

                                                                                        314     126    Power
                                                                                                       +23% QoQ
                                                                                                       +88% YoY
                                                                                                279    Gas
                                                                                        205            -11% QoQ
                                                                       736                             +50% YoY
                                                                          40                    147    Coal Australia
                                                                          67                           -28% QoQ
                       Others*
                                                                                                       -9% YoY
                       Power                                             186
                       Gas
                       Coal Australia                                    162            758
                                                                                                643    Coal Indonesia
                       Coal Indonesia
                                                                                                       -15% QoQ
                                                                                                       +129% YoY
                                                                         281

                                                                       1Q21             4Q21   1Q22

Note: *Revenue from others includes coal trading, fuel business and other businesses                                    13
Banpu consolidated EBITDA – 1Q22

      USD million                                -10% QoQ
                                                 +117% YoY

                                   666
                                                  Power
                                    27            +36% QoQ
                                          596     -13% YoY
                                          37
                                                  Gas
                                   207            -19% QoQ
                                                  +54% YoY
                                          167
                                                  Coal Australia
                                    33            +9% QoQ
                                                  +15% YoY
                                    35     36
                                           48     Coal China
                            274                   +35% QoQ
        Energy Technology
                                                  +185% YoY
        Power                40
        Gas
        Coal Australia      108    370            Coal Indonesia
                                          316     -15% QoQ
        Coal China
                             32                   +254% YoY
        Coal Indonesia       17
                             89
                                    (7)   (7)     Energy Technology
                            (12)
                            1Q21   4Q21   1Q22
                                                                      14
Banpu consolidated NPAT – 1Q22
    1Q22 NET PROFIT AFTER TAX
     USD million                                                                                                                                               Non-recurring items:
                            596                                                                                                                                • FX gain USD:THB $10.4 M
                                                                                                                                                               • Other non-recurring $191.9M
                                                                                                                                                               • Derivative loss ($148 M)
                                                                      (133)            - D&A                                                                     - Coal swap ($19.7 M)
                                                                                                                                                                 - Gas hedging ($100.8 M)
                                                                      (52)             - Interest                                                                - Electricity Contract ($33.4 M)
                                                                                                                                                                 - CCS & IRS* $5.9 M
                                                                      (75)             - Tax
                                                                                                                                                                                               311
                                                                      (80)             - Minority                  256                                54

                                                                     D&A                                             NP                         NON - RECURRING                                 NPAT
                    EBITDA AS REPORTED
                                                                INTEREST & TAX                                 FROM OPERATION                         ITEMS
                                                                   MINORITY

    4Q21 NET PROFIT AFTER TAX                                                                                            1Q21 NET PROFIT AFTER TAX
                                                                       Non-recurring items:
     USD million                                                       • FX loss USD:THB ($10.6 M)                        USD million                                                                     Non-recurring items:
                        666                                            • Other non-recurring ($9.5 M)                                                                                                     • FX gain USD:THB $29.4 M
                                                                       • Derivative loss ($214.7 M)                                                                                                       • Other non-recurring ($31.3 M)
                                                                         - Coal swap ($77.9 M)                                                                                                            • Derivative loss ($4.9 M)
                                         (135)    - D&A
                                                                         - Oil hedging $2.5 M                                                                                                               - Coal swap ($1.5 M)
                                                                                                                                          274                                                               - Oil hedging $0.8 M
                                          (61)    - Interest             - Gas hedging ($147.1 M)
                                                                         - FX $2.3 M                                                                                - D&A                                   - Gas hedging ($7.9 M)
                                          (50)    - Tax                                                                                                    (126)                                            - FX $8.8 M
                                                                         - CCS & IRS* $5.6 M
                                          (81)    - Minority   339                                                                                          (45)    - Interest                              - CCS & IRS* ($5.1 M)
                                                                                                                                                            (20)    - Tax
                                                                                                                                                            (26)    - Minority   32
                                                                               (235)
                                                                                                    105                                                                                             (7)
                                                                                                                                                                                                                         51

                      EBITDA               D&A               NP           NON - RECURRING               NPAT                             EBITDA              D&A                NP          NON - RECURRING              NPAT
                        AS            INTEREST & TAX        FROM                ITEMS                                                      AS           INTEREST & TAX         FROM               ITEMS
                     REPORTED            MINORITY                                                                                                          MINORITY          OPERATION
                                                          OPERATION                                                                     REPORTED

Note: *cross currency swap, interest rate swap                                                                                                                                                                                              15
Highlights   Antifragile      Financial   Energy      Energy       Energy
1Q22         Transformation   Summary     Resources   Generation   Technology

                                                                                16
U.S. gas market update
   RESILIENT DEMAND PROJECTION                                                                US NATURAL GAS PRODUCTION
   Unit: Bcf/d
                                                                                              Unit: Bcf/d                 2021 act. prod. (LHS)         2021 act. export (RHS)
                           Actual                                 Forecast                                                2022 act. prod. (LHS)         2022 act. export. (RHS)
    120
                                                                                               105                        2022 fcst. prod. (LHS)        2022 fcst. export. (RHS)   50.0
    100
     80                                                                                                                                                                            40.0
                                                                                                95
     60                                                                                                                                                                            30.0
     40                                                                                         85
                                                                                                                                                                                   20.0
     20
                                                                                                75        Production drop from extremely
       0                                                                                                                                                                           10.0
           1Q21 2Q21 3Q21 4Q21 1Q22 2Q22 3Q22 4Q22 1Q23 2Q23 3Q23 4Q23                                    cold weather in the US
                                                                                                65                                                                                 0.0
                     Residential        Commercial   Industrial   Power      Other
                                                                                                      Jan Feb Mar      Apr May Jun        Jul      Aug Sep Oct Nov Dec

      ▪ Majority of US gas demand is domestic consumption. Price is largely determined by
        local demand and supply with indirect linkage to oil via associated gas production.   U.S. STORAGE LEVEL
      ▪ U.S. gas production averaged at 95.5 Bcf/d in April, 1.5 Bcf/d lower than recent      Unit: Bcf                                  Forecast
        peak in December 2021 due to snow in some producing regions and seasonal              4,000
        maintenance on pipelines. Gas production is forecasted to average at 96.7 Bcf/d for
                                                                                              3,500
        2022 up from 93.5 in 2021, driven by high natural gas and crude oil price levels
        supporting drilling activities.                                                       3,000
                                                                                              2,500
      ▪ U.S. LNG exports averaged at 11.6 Bcf/d in April, slightly down from all-time peak
                                                                                              2,000
        of 12.0 Bcf/d in March. LNG exports are expected to continue at high levels into
        2022 averaging at 12.0 Bcf/d, up 23% from 2021, supported by strong demand from       1,500
        Asia and Europe.                                                                      1,000
                                                                                                500
      ▪ Natural gas inventories in April 2022 ended at 1.6 Tcf, 17% below 5-year average
        due to higher demand for heating as a result of below-normal temperature. At the          0
        end of 2022 injecting season, the inventories are forecasted to end at 9% below the       Jan-21 May-21 Sep-21 Jan-22 May-22 Sep-22 Jan-23 May-23 Sep-23
        5-year average.                                                                                               Storage          3yr - Low          3yr - High

Source: EIA Short-Term Energy Outlook (May 2022)                                                                                                                                          17
U.S. gas: gas prices expected to remain high amid low storage level
 US RIG COUNT VS HENRY HUB PRICE                                                                                              COMMENT

 US OIL AND NATURAL GAS RIG COUNT                                                                    HENRY HUB SPOT PRICE     ▪   Natural gas prices in 2Q22 increased from
 Unit: Rigs                                                                                                   Unit: $/MMBtu
                                                                                                                                  the previous quarter driven by continued
 1,400                                                                                                                  9.5       surge in gas demand in Europe and supply
                                                                                                          EIA’s         9.0       disruptions globally
                                                                                                          forecast**    8.5
 1,200                                                                                                                  8.0   ▪   Capital spending is expected to increase
                                                                                                                        7.5       significantly in 2022 relative to 2021 in
                                                                                                                        7.0
 1,000                                                                                       Henry Hub
                                                                                                                        6.5
                                                                                                                                  response to higher crude oil and natural gas
                                                                                               futures*                 6.0       prices but remain low in total compared to
  800                                                                                                                   5.5       2015-2019 average as operators continue to
                                                                                                                        5.0
                                                                                                                        4.5       prioritize on cash flow generation.
  600                                                                                                                   4.0   ▪   With the increase in capital spending, oil and
                                                                                                                        3.5
                                                                                                                        3.0       gas rigs are expected to continue to increase
  400                                                                                                                   2.5       in 2Q22, up 13% from 1Q21 but remain at
                                                                                                                        2.0       levels 28% lower than 1Q19.
  200                                                                                                                   1.5
                                                                                                                        1.0   ▪   Henry Hub futures remain around $7.5-
                                                                                                                        0.5
     0                                                                                                                  0.0       8.0/MMBtu levels in 2022 but signal a decline
                                                                                                                                  after 1Q23 to around $4.5-5.0/MMBtu levels.

            Natural gas rig count                Oil rig count              Oil and natural gas rig count forecast

            Henry Hub natural gas price

  Note: *As of May 10th, 2022, **Short-Term Energy Outlook (May 2022)
  Source: IHS Markit report (May 2022) and Baker Hughes US natural gas rotary rig count (May 2022)
                                                                                                                                                                                   18
Banpu Gas: 1Q22 highlights
       US DRY GAS CONSUMPTION 2019 BY STATE* (Bcfe)
                                                         2,500 - 5,000 Bcf             500 – 749 Bcf
                 Banpu shale
                                                         1,000 - 2,499 Bcf             250 – 499 Bcf
                 gas operations
                                                         750 – 999 Bcf                 0 – 249 Bcf     Average local price**
                                                                 Pennsylvania
                                                                Marcellus Shale
                                                                0.9 Tcfe 1P reserves
                                                                                                       $4.80/Mcfe
                                                                                                            -8% QoQ

                                                                                                          Sales volume

                                                                                                        60 Bcfe
                                                                                                            -3% QoQ

                                                                                                             EBITDA

                                         Texas
                                                                                                        $167 M
                                                                                                            -19% QoQ
                             Barnett Shale
                         3.3 Tcfe 1P reserves

*Source: EIA
**Average local price = Henry Hub - basis differential                                                                         19
Banpu Gas: 1Q22 performance
1Q22 highlighted our ability to capture pricing and deliver strong production despite some winter freezes and inflationary price
environment. EBITDA of $167 M in 1Q22.

  SALES VOLUMES                                      TOTAL REALIZED REVENUE                       EBITDA
  Unit: Bcf*                                         Unit: US$M                                   Unit: US$M

                                                                  312
                                                                   1
                                                                         280    Other income
                                                                          4     from trading JV

                                                                                                               203           Other income
                                                          186                                                   1            from trading JV
                                                                  254                                                 167
                                                            49           230                                           4
                                                                                Barnett
         62                 62    60                                                                           150
                                                                                                        108
                                                                                                                      126    Barnett
                                                            111                                           49
          48                 48    47    Barnett

                                                                                                          42
                                                                   57     46    Marcellus                       52     37    Marcellus
          14                 14    13    Marcellus          26                                            17
        1Q21               4Q21   1Q22                     1Q21   4Q21   1Q22                           1Q21   4Q21   1Q22

Note: *Bcf = Billion cubic feet                                                                                                                20
Global thermal coal market
COAL DEMAND AND SUPPLY CHANGE – 2022E VS 2021                                                                                  TRENDS
                                                                                                                               DEMAND
Unit: Mt                SUPPLY            DEMAND
                                                                                                                               High CV coal demand remains strong due to high natural gas prices and efforts
                                                                                                                               by European buyers to diversify away from Russian coal. Lower demand from
                                                                                                                               price-sensitive buyers who are mostly lower CV coal consumers. Buyers in
                                                                                                                               countries with domestic supply could start diverting some demand to domestic
                                                                                                                               supply.
                                                                                  PACIFIC                                      ▪ China: Slower economic growth from Covid-19 lockdowns will dent coal
                                   ATLANTIC                                                                    RUSSIA*            demand. Government’s intervention to stabilize coal prices and unofficial
                                                                                                                                  ban on Australian coal are expected to continue.
                                                                                                                               ▪ India: Sustained rally in seaborne coal prices will keep thermal coal imports
                                                                                                                                  subdued although government urged power producers to ramp up imports.
                                            -3                                   -17
                                    -8                                                                                         ▪ JKT: High natural gas prices continue to keep coal competitive against gas.
                                                            +1                            -26                   -20               Japan’s announcement of ban on Russian coal imports although no detailed
              +1                                                                                   CHINA                          plan yet is likely to increase demand for Australian coal.
                                                          EUROPE
             USA                                                                                            OTHER N. ASIA      ▪ Europe: EU announced plans to ban all forms of Russian coal imports
                                                                                                                                  starting from 10th August, while UK’s ban will be effective at the end of
                                                                                                                -1                2022. EU is expected to increase coal-fired generation by postponing coal
                                                                                      SOUTH ASIA                                  plant closures amid high natural gas prices.
                                                                                                   -20                OTHERS

                            +6                                                            -6                                   SUPPLY
                                                                                                   INDONESIA             -3
                                                                                                                               Geopolitical tensions are going to change global coal trade flows into more
                        COLOMBIA                                                                                               inefficient markets, keeping coal prices elevated. Supply tightness is
                                                                                                                               expected to persist throughout the year especially on high CV products.
                                                                                                      -13                      ▪ Indonesia: wet weather impeded the ability to ramp up exports to
                                                                  +1                                             +1               recoup the losses incurred during the export ban coupled with weak low
                                                                                                             AUSTRALIA            CV demand.
                                                                 SOUTH
                                                                 AFRICA                                                        ▪ Australia: wet weather and labour shortage from Covid-19 pandemic
                                                                                                                                  curbed output. Supply is expected to improve from April but export to
                                                                                                                                  Europe will be limited.
                                                                                                                               ▪ Others: Russian coal export is expected to perform well before the
                                                                                                                                  enforced ban on 10th August and will fall after that. Rail issues in South
                                                                                                                                  Africa persist. In Colombia, Prodeco production could restart in 4Q22.
                                                                                                                                  Growth of thermal coal export from US seems to be limited due to high
Note:*Russia exports to non-CIS countries only, JKT = Japan, South Korea and Taiwan                                               domestic demand and logistic constraints.                                      21
Banpu ASPs vs thermal coal benchmark prices
BANPU ASP VS BENCHMARK PRICES                                                                                                   COMMENTS

                                                                                                                                ▪   Seaborne thermal coal market has been extremely volatile during 1Q22, mainly
Unit: US$/t; A$/t for CEY                                             Monthly NEX
                                                                                                                                    due to the sudden policy changes in Indonesia, Ukraine crisis, strong gas price,
                                                       350
                                                       300                                                                          coupled with the supply tightness in major coal export countries.
                                                       250
                                                       200                                                                      ▪   On 26 January 2022, GCNewc hit US$263/t, due to the Indonesian coal export
                                                       150                                                                          ban and the wet weather in NSW Australia. After Indonesia restarted exports from
340                                                    100
                                                        50                                                           US$318/t       the end of January 2022, the coal market started softening, on the 18th of
                                                         0
300                                                                                                                                 February, GCNewc dropped to US$226.t level,

                                                             2007
                                                                    2009
                                                                           2011
                                                                                  2013
                                                                                         2015
                                                                                                2017
                                                                                                       2019
                                                                                                              2021
                                                                                                                                ▪   Since end of February 2022, the market surged significantly, mainly due to the
260                                                                                                                                 panic caused by Ukraine crisis, GCNewc hit US$427/t on 7 March 2022, which
                                                                                                                                    became the historical record so far.
220                                                                                                     Monthly                 ▪   After the panic buying, the coal market started stabilizing through to mid March,
                                                                                                          NEX
                                                                                                                                    dropping to about US$200/t within 2 weeks, hitting US$230/t level on 22 March
180
                                                                                                                                    2022, which is the lowest price level in March.
                                                                                                                     US$151/t   ▪   Supported by the supply shortages in major coal export countries, particularly due
140
                                                         Quarterly                                                   A$136/t
                                                                                                                                    to the wet weather conditions in NSW, Australia and Kalimantan, Indonesia and
                                                         Centennial ASP
100                                                                                                                                 the prolonged Ukraine crisis, the tight market situation is expected to continue for
                                                                                                                                    the foreseeable future.
                                       Quarterly
 60                                                                                                                             ▪   Group ASPs in 1Q22 continue to increase, particularly for export portions.
                                       ITM ASP
                                                                                                                                ▪   Key price metrics:
 20
                                                                                                                                     ▪    ITM ASP 1Q22 : US$151.1/t* (+5% QoQ)
       Jul-16

       Jul-17

       Jul-18

       Jul-19

       Jul-20

       Jul-21
      Jan-16

      Jan-22
      Apr-16

      Oct-16

      Apr-17

      Oct-17

      Apr-18

      Oct-18

      Apr-19

      Oct-19

      Apr-20

      Oct-20

      Apr-21

      Oct-21

      Apr-22
      Jan-17

      Jan-18

      Jan-19

      Jan-20

      Jan-21

                                                                                                                                     ▪    CEY ASP 1Q22 : A$135.8/t* (+7% QoQ)
                                                                                                                                          ASP Domestic A$78.3/t (+5% QoQ), ASP Export A$258.6/t (+28% QoQ)

Note: *Includes post shipment price adjustments as well as traded coal
                                                                                                                                     ▪    NEX (May 13, 2022)**: US$397.82t
     **The Newcastle Export Index (NEX)
                                                                                                                                                                                                                           22
Banpu Mining: group coal sales and pricing status 2022e
 2022e COAL SALES* SOURCE – DESTINATION ANALYSIS                                                                 COAL SALES PRICING STATUS
                                                   13.0 Mt
                                                                                                                 INDONESIA

                                                     6.6                                       5.4 Mt                                         2022e
                                                                               0.9 Mt
                                                                                0.9
                                                                                                  2.6                          Unsold
                                                                                                  2.8
                                                                              S KOREA                                                   21%
                                                                                               JAPAN                                                         Fixed
                                                     6.4                                                                                              31%
                                                                                                                        Unpriced
                                                                                                                                      2%      21.8
                 0.7 Mt           0.8 Mt
                                                   CHINA
                                                                     0.9 Mt
                                                                                      2.2 Mt                                                  Mt***
                                                   1.4 Mt             0.7
                  INDIA        BANGLADESH                            TAIWAN       PHILIPPINES           2.4 Mt                              46%
                                               THAILAND          0.2 Mt                                                                Indexed
                                                                                                        OTHERS
                                               0.8 Mt           VIETNAM

                                              MALAYSIA                                          2.7              AUSTRALIA
Total coal sales: 39.0 Mt**                                 4.5 Mt
                                                                                                                                              2022e
    Indonesia coal (21.8 Mt)
    Australia coal (10.6 Mt)
    China coal (6.6 Mt)
                                                                                                                             Unsold
                                                       INDONESIA                                                                        24%
    Including 2.0 Mt coal trading                                                        5.8 Mt

Notes:
*Sales from Indonesia are included on 100% basis,
                                                                                                                                              10.6
                                                                                                                                                       53%   Domestic
sales from Australia and China are included on equity
basis. Excluding Mongolia coal                                                                                           Indexed      15%     Mt***
**Illustrative target; Includes coal sales from domestic
                                                                                        AUSTRALIA
production in China                                                                                                                         8%
***Target sales; Coal sales includes third-party
sourced coal                                                                                                                        Fixed
                                                                                                                                   export
                                                                                                                                                                        23
Banpu Mining: 1Q22 highlights

                     Mongolia
                              (100%)
                                                                                       Production volume*
               China
                           Gaohe and Hebi
                              123 Mt reserves
                       (CV: 6,500 – 7,000 kcal/kg)
                                                                                         8.0 Mt
                                                                                           -15% QoQ

                                                                                         Sales volume*

                                 ITM
                                                        Indonesia
                                                                                         8.7 Mt
                    293 Mt reserves                                                        -17% QoQ
             (CV: 5,950 – 6,250 kcal/kg)

            Operating
                                                                                            EBITDA
                                                                  Centennial
            Under development

     Banpu’s portfolio of coal assets
                                                     Australia   261 Mt reserves
                                                                 (CV: 6,700 kcal/kg)    $400 M
     Coal reserves at end 2021 shown in bold
     CV figures are air-dried basis
                                                                                           -9% QoQ

  Note: *Based on 100% basis                                                                                24
Banpu Mining: operational summary
2022E COAL OUTPUT                                                          ROM PRODUCTION AND KEY UPDATES

                                                                                                                           ▪ Delayed Longwall relocations
           MONGOLIA                                                                                                          impacted 1Q22 production.
              COAL
                                                                                                          2.9              ▪ Reduced production is
                                                                                        2.4   2.1                            associated to domestic sales.
                                                                           AUSTRALIA                1.7         -17% QoQ
                                                                              COAL**                            -29% YoY   ▪ 2Q22 – Longwall mines are
                             CHINA COAL*                                                                                     operating above plan.
                             2022 target: 10.3 Mt
                                                                                        1Q21 4Q21 1Q22 2Q22e               ▪ All mines continue to incur
                                                                                                                             Covid-19 related absenteeism.

                                                                                                                           ▪ Production 1Q22 achieved
                                                                                              4.9                            according to the target at 3.8 Mt
                                                                                        4.0         3.8   3.8                despite the export ban ruling in
                                                                                                                             Indonesia during January 2022.
                                                                           INDONESIA                            -5% QoQ
                                                                               COAL*                            -23% YoY   ▪ Additional mining equipment
                                                                                                                             capacity from mining contractor
                                                                                                                             to support production output in
           INDONESIA COAL*                                                                                                   this year.
        2022 target: 17.5 - 18.8 Mt                                                     1Q21 4Q21 1Q22 2Q22e

    Coal operations
    2022e target output                                                                                                    ▪ Gaohe: Production and sales in
                                                                                                                             1Q22 remained stable amid high
                                                                              CHINA &   2.5   2.5   2.6   2.5                coal prices from strong demand.
                                                    AUSTRALIA COAL**                                            +4% QoQ
        Open-pit mine
                                                    2022 target: 10.7 Mt    MONGOLIA                            +4% YoY    ▪ Hebi: Lower production and sales
        Underground mine                                                       COAL*                                         in 1Q22. A new longwall panel is
                                                                                                                             expected to start test run in 2Q22
        Under development                                                               1Q21 4Q21 1Q22 2Q22e                 and improve production for the
                                                                                                                             quarter.

                                                                                                                                                                  25
Banpu Mining: average production cost breakdown
    AUSTRALIA COAL – AVERAGE PRODUCTION COST1
    Unit: A$/t
                                      88
                                                                                                               93                                                     ▪ Global environment continues to
                                                           87
                                                                                                                                                                        drive costs up (i.e. steel and
                            74
                                                                                                                           Depreciation                                 fuel) in addition to supply cost
                                                                                                                           Cash overhead                                pressure.
                                                                                                                           Coal handling & preparation
                                                                                                                           General expense                            ▪ 1Q22 – Lower production
                                                                                                                           Repair and maintenance                       volumes impacting cost per ton.
                                                                                                                           Stores and supplies                        ▪ Mine site teams are focusing on
                                                                                                                                                                        strict cost control measures.
                                                                                                                           Labor

                          FY20 FY20                      1Q22 2Q22 3Q22 4Q22                                FY22e
    INDONESIA COAL – AVERAGE TOTAL COST2
    Unit: US$/t
                                                            74                                                  77
                                       59                                                                                                                           ▪ Average total cost per ton (excl.
                            49                                                                                                                                        royalty) rose to $56/t in 1Q22 due to
                                                            18                                                  19          Royalty
                                       12
                             6                                                                                                                                        increase in fuel price which
                                                            56                                                  58                                                    significantly impacted mining and
                                       47                                                                                   SG&A expenses                             coal transportation costs. FY22e
                            43                                                                                              D&A expenses                              cost is also expected to increase
                                                                                                                            Other production costs3                   from the effect of high fuel price.
                                                                                                                                                                    ▪ Higher ASP due to high coal prices
                                                                                                                            Mining cost                               which increase the royalty cost
                                                                                                                                                                      significantly compared to the FY21.

                          FY20      FY21                 1Q22 2Q22 3Q22 4Q22                                 FY22e
Note: 1 These figures do not include selling, distribution and royalty costs; based on ‘sold’ production, 2 Coal business only, 3 including repair and maintenance, salaries and allowances, inventory adjustment, others etc.   26
Highlights   Antifragile      Financial   Energy      Energy       Energy
1Q22         Transformation   Summary     Resources   Generation   Technology

                                                                                27
Banpu Energy Generation: 4,187 MW committed capacity

                                                                                                   Japan
                                China

                                            Laos
                                                                                                                                                     8 countries
                                                                                                                                                  operations across the
                                                           Vietnam
                                                                                                                                                       Pacific Rim
                                                                                                                   USA

                           Thailand

                                                                           Indonesia

                                                                                                                                          3,244 MW                943 MW
                                                                                                                                        committed thermal    committed renewables
       Solar power plant                Solar rooftop                                                                                    equity capacity*      equity capacity**
       portfolio                        portfolio

       Solar floating                   Wind power
       portfolio                        plant portfolio
                                                                                    Australia
       Banpu Power’s thermal
       power plant portfolio

 *Note: Based on Banpu Power’s equity capacity, **Banpu Renewable Power businesses are owned by Banpu NEXT (50% Banpu PLC, 50% Banpu Power)                                         28
Banpu Thermal Power: 1Q22 highlights

                                                                   539 MWe**
                                                                                                                       EBITDA
                                                                   CHP
                                                                                   Japan
                     China
                                                                   613 MWe gross
                                                                                   73 MW NAKOSO IGCC
                                                                                   543 MW gross
                                                                                                                 $37 M
                                                                                                                  +36% QoQ
                   396 MW SLG IPP
                         1,320 MW gross

                                                   Laos
                                                     751 MW HPC IPP
                                                                                                                 Achieved EAF
         Thailand                                    1,878 MW gross                       USA
           717 MW BLCP IPP
                   1,434 MW gross
                                                                                                           77%              78%
                                                                                                            at HPC              at BLCP
                                                                                    768 MW TEMPLE I CCGT
                                                                                    768 MW gross

                                                                                                           76%              85%
                                                                                                           at Nakoso        at Temple I
           Banpu Power’s thermal
           power plant portfolio

  Note: *Based on Banpu Power’s equity capacity, **MW equivalent                                                                          29
Banpu Thermal Power: 1Q22 updates

                       BLCP                                                                                   HPC                                                                          SLG
                       Plant improvement plan in 1Q22                                                         Completed yearly maintenance of                                              Fully operational and entering the
                       to improve plant reliability to                                                        unit 2 for 44 days as planned, to                                            wholesale electricity market to raise
                       serve demand from EGAT.                                                                improve efficiency and plant                                                 the selling price of electricity, as well
                                                                                                              reliability                                                                  as a policy of securing coal supply
                      ▪ Reported EAF of 77.7% due to                                                          ▪ Reported EAF of 76.7% due to                                               contracts with SOE to mitigate the
                        planned major overhaul for Unit 1                                                       planned major overhaul for Unit 2                                          fluctuation of coal costs.
                      ▪ Total revenue reported at THB                                                                                                                                      ▪ Report net power sold of
                                                                                                              ▪ Total revenue reported at THB                                                 876 GWh
                        3,341 M, EBITDA at THB 150 M                                                            4,583 M, EBITDA at THB 2,557 M
                      ▪ Reported share of loss at                                                                                                                                          ▪ Impact from high coal cost
                                                                                                              ▪ Reported share of profit                                                     result in a reported share
                        THB 83 M                                                                                at THB 642 M                                                                 of loss at RMB 49 M

                       China CHP                                                                              Nakoso IGCC                                                                  Temple I
                       Continued to improve financial                                                         Higher power sold after completed                                            Fully recognized revenue in this
                       performance by entering wholesale                                                      its plant improvement plan in 4Q21                                           quarter with better plant efficiency
                       electricity market and centralized                                                     with additional contribution and                                             and higher power sold
                       coal procurement system to lessen                                                      cash flow stream.
                       impact from high coal cost.                                                            ▪ Reported EAF of 76%                                                        ▪ Report EAF of 85%
                      ▪ Reported revenue of RMB 493 M                                                         ▪ Reported net generation                                                    ▪ Reported net generation of
                                                                                                                of 789 GWh                                                                   754 GWh
                      ▪ Total EBITDA of RMB 48 M
                                                                                                              ▪ Reported share of profit at                                                ▪ Total EBITDA of USD 5 M
                      ▪ Reported share of profit at                                                             THB 238 M
                        RMB 18 M                                                                                                                                                           ▪ Reported share of loss at
                                                                                                                                                                                             USD 27 M (Unrealized loss
                                                                                                                                                                                             from derivative USD 23 M)

 Note: *Equivalent Availability Factor (EAF) is a percentage of a given operating period in which a generating unit is available without any planned and unplanned shutdown or deratings                                               30
Banpu Renewable Power: diversified Asia-Pacific portfolio*

                                                                                              Japan
                                    China
                                                                                              243 MW
                                      177 MW

                                                     Vietnam
                                                                                                                                          943 MW
                                                                                                                                     committed renewables
                                 Thailand                  118 MW                                                                  capacity across Asia-Pacific
                                            22 MW               100 MW
                                             48 MW
                                                               62 MW

                                                                     Indonesia
                                                                     6 MW

                                                                                                                       687 MW            138 MW               118 MW
                                                                                                                      committed solar  committed solar       committed wind
  Banpu NEXT’s portfolio
                                                                                                                      power capacity rooftop and floating       capacity
         Solar power plant
         portfolio
                                   Solar rooftop
                                   portfolio                                                 Australia                                  solar capacity
         Solar floating            Wind power
         portfolio
                                                                                                      167 MW
                                   plant portfolio

Note:*Banpu Renewable Power businesses are owned by Banpu NEXT (50% Banpu PLC, 50% Banpu Power), committed capacity                                                           31
Banpu Renewable Power: 1Q22 updates
                                 China Solar
                                 Capacity factors slightly lowered due to unfavorable    Vietnam Solar
                                 weather conditions with lower power sold YoY.
                                                                                         Acquired 3 new operating solar farms (Ha
                                 ▪ Average capacity factor was 13.0%                     Tinh Solar in 4Q21, Nhon Hai Solar and
                                 ▪ Power sold was 50 GWh, -8% YoY                        Chu Ngoc Solar in 1Q22) with a total
                                 ▪ Reported revenue of RMB 45 M with profit              capacity of 100 MW.
                                   contribution of RMB 12 M
                                                                                        ▪ Feed in tariff (FIT) for US cents 9.35/kWh
                                                                                        ▪ PPA with EVN for 20 years
                                  Japan Solar                                           ▪ Capacity factor average c. 14-16%
                                  Higher power sold from COD of projects in pipeline,
                                  slightly lower capacity factor.

                                  ▪ Average capacity factor was 8.2%, -1% YoY
                                                                                        Vietnam Wind
                                  ▪ Power sold was 35 GWh, +22% YoY
                                  ▪ Reported TK distribution of JPY 121 M
                                                                                        El Wind Mui Dinh
                                                                                        ▪ Average capacity factor was 32.2%
                                                                                        ▪ Power sold was 26.2 GWh
                                  Australia Solar                                       ▪ Profit contribution of USD 0.5 M
                                  Continued integration of plant operations and
                                  management. Optimization of generation and energy     Vinh Chau project
                                  value through plant improvement initiatives.
                                                                                        ▪ Construction completion and under pre-
                                 ▪ Average capacity factor was reported at 20.5%          commissioning activities
                                 ▪ Power sold was 53 GWh

 Note: Banpu Power has 50% shareholding in Banpu NEXT                                                                                  32
Highlights   Antifragile      Financial   Energy      Energy       Energy
1Q22         Transformation   Summary     Resources   Generation   Technology

                                                                                33
Banpu Energy Technology: growth targets 2025

       SOLAR: ROOFTOP                ENERGY STORAGE                     E-MOBILITY                 SMART CITIES &           ENERGY
         & FLOATING                     SYSTEMS                  39.3% in UMT, 30% Beyond Green,
                                                                                                   ENERGY MGMT.             TRADING
                                                                   21.5% in FOMM, 20% in EVolt,
       Including 49% in Solar Esco     47.7% in Durapower                17.54% in Haupcar           100% ownership         100% ownership

1Q22
              138                           1.0                   2,457 passengers/day
                                                                      ride hailing via Muvmi             21                  440
                 MW                          GWh                   252 electric vehicles               projects                GWh
           committed capacity        (0.5 GWh on equity basis)       under fleet management           Includes energy       Electricity sales
                                            Li-ion battery                                          management, smart
                                         production capacity           116 Chargers                  infrastructure, etc.

                                                                        1 E-ferry sold

                 MW
             (under review)          (1.4 GWh on equity basis)

                                                                                                                                                34
Banpu Energy Technology: 1Q22 updates
                 SOLAR:                                        ENERGY
                                                                                                                  SMART CITIES                              ENERGY
                 ROOFTOP &                                     STORAGE                 E-MOBILITY
                                                                                                                  & ENERGY MGMT.                            TRADING
                 FLOATING                                      SYSTEMS

                SOLAR ROOFTOP                                                                          SOLAR FLOATING

                                                                         BANPU NEXT ACCELERATES PLANS FOR THAILAND’S MEGA SOLAR INDUSTRIAL ESTATE PROJECTS

                                                                                                                       • Banpu NEXT expanded its solar portfolio in several
                                                                                                                         Thai industrial estates by preparing to begin power
                                                                                                                         distribution in the middle of 2022. The company
                                                                                                                         demonstrated success of the solar floating projects in
                                                                                                                         LK Rubber Industrial City Hub of 16 MW, currently
                                                                                                                         95% construction progress. Moreover, Banpu NEXT
     IBP’S NEW CONTRACT SIGNING                                                                                          handled a major solar floating project for Apex Green
     PT. CPI (Cahaya Power Indonesia), a subsidiary of                                                                   Industrial Estate with a total production of 32 MW, the
     IBP, in which IBP is a subsidiary of Banpu Next,                                                                    largest private solar floating project in Thailand.
     has signed a solar rooftop PPA in Indonesia with a                                                                • Banpu NEXT aims to install all types of solar systems
     total capacity of 5.9 MW in 1Q22                                                                                    in Thailand for all industry sectors by 2022,
                                                                                                                         emphasizing on industrial estates and large sites.
     NEW CONTRACT SIGNING IN THAILAND                                                                                  • Banpu NEXT, through a digital platform and real-time
     Banpu NEXT has signed a contract with SUMMER                                                                        system monitoring application assists businesses in
     LASALLE PHASE 3 and S.C.S. SPORTSWEAR                                                                               creating sustainable value, lowering electricity costs,
     Co., Ltd. for a solar rooftop installation with a total                                                             increasing energy efficiency and transitioning to an
     capacity of 982 kWp                                                                                                 environmentally friendly green industry

     COMPLETED DIVESTMENT FROM SUNSEAP
     Divestment of 47.5% shareholding in Sunseap to EDPR,
     a listed renewables company incorporated in Spain, for
     US$347.8 M was completed in February 2022.

Note: Banpu NEXT equity basis                                                                                                                                                      35
Banpu Energy Technology: 1Q22 updates (Cont’d)
           SOLAR:                                    ENERGY
                                                                                                                           SMART CITIES                          ENERGY
           ROOFTOP &                                 STORAGE                         E-MOBILITY
                                                                                                                           & ENERGY MGMT.                        TRADING
           FLOATING                                  SYSTEMS

                  E-MOBILITY EXPANSION                                            BANPU NEXT ECOSERVE                                   ELECTRICITY SALES

  MUVMI NEW AREA EXPANSION                                                 JOINT VENTURE WITH SP GROUP                             INCREASED LONG-TERM SALES TARGET
  MuvMi has expanded operating areas from 7 to 10 areas (including On-     Banpu NEXT EcoServe and SP Group, a leading             WITH STRATEGIC ADJUSTMENTS
  nut, Victory Monument, and Grand Bangsue Station). Moreover, MuvMi       utilities group in Singapore and Asia Pacific, signed   • Secure all electricity supply to deliver to
  just celebrated 2 million trips since operated in 2018                   a joint venture agreement on 5th April 2022. This          clients for the next 12 months.
                                                                           joint venture will enhance capabilities to develop      • Adjust strategy and risk management
  BEYOND GREEN BRANCHES EXPANSION                                          district cooling systems, cross-border renewable           system in responding to current market
  Beyond Green has expanded to 16 branches covering all regions in         energy certificates (RECs) platform and smart city         conditions of Japan’s electricity market.
  Thailand, in order to serve customers and provide services regionally.   solutions businesses.

  INCREASED SHAREHOLDING IN EVOLT AND HAUP CAR
  Total investment of c. US$2.2 M. in Tranche 2 Series A funding
  in Evolt and Haup Car, resulting in increased shareholding to
  20% and 17.54% in Evolt and Haup Car, respectively.

                                                                                                                                                                                   36
APPENDIX

           37
Banpu: ‘integrated energy solutions’ 2022

    ENERGY RESOURCES               ENERGY GENERATION     ENERGY TECHNOLOGY

    Shale Gas                       Renewable Power      Solar: Rooftop & Floating

             ~700         MMcfed             805 MW                 138 MW
             Net production                  Committed              Committed
                                             capacity               capacity

    Mining                          Thermal Power        Clean Energy Tech
                                                                1.0 GWh (100% basis)
                                                                Li-ion batteries

             39.0         Mt                 3,244 MW           E-mobility services
                                                                E-mobility solutions
             Coal sales                      Committed
                                             capacity           Smart Cities &
                                                                Energy Management
                                                                440 GWh
                                                                electricity trading

                                                                                       38
Natural gas: reserve and production term

                             Reserve                                         Production

          DEFINITION                                        PRODUCTION UNIT
          • Natural Gas Reserve Definitions in the US are   • In the US, production is measured in 1000 cubic
            defined by the SEC and are the same as used       feet (MCF)
            for oil:
                                                                  •   1000 MCF = 1 MMCF
                 • Proved Developed Producing (PDP)
                                                                  •   1,000,000 MCF = 1 BCF
                 • Proved Developed Not Producing
                     (PDNP)                                       •   1000 BCF = 1 TCF
                • Proved Undeveloped (adjacent to a               •   1 MCF = 28.3 Meters3
                  producing well) (PUD)                           •   1 MCF = 1.0 Million BTU (MMBTU) or
               • Probable (in the same area as                        Decatherms (dry gas)
                  production but not adjacent) (PROB)             •   1 BCF = 1.0 Trillion BTU
               • Possible (contingent on additional               •   1 Meter3 = 35.3 MCF
                  drilling) (POSS)
                                                                  •   1 Billion Meters3 = 35.3 BCF
          • Reserves have to be economically viable.

                                                                                                                39
2022 indicative guidance
                ILLUSTRATIVE AND INDICATIVE ONLY

                UNIT GUIDANCE (US$/MCF)                            COMMENTS
                REVENUE
                Reserves (Tcf)                     3–4
                Production volume (Mmcfd)          600 – 700
                Average differential to            $0.20 - $0.50   Difference selling points and Henry Hub (NYMEX basis)
     NET BACK

                Henry Hub
                GCP&T costs                        $0.90 - $1.10   Gathering, compression, fractionation and transportation costs

                Pipeline revenue                   $0.02 - $0.05   Applicable to Chaffee Corners volume only
                COSTS
                Lease operating expense and        $0.60 - $0.80   Main component of operating costs
                production tax
                G&A                                $0.25 - $0.45   Recurring general and administration costs
                Taxes                              21%             Currently benefit from tax shield due to NOL
                DD&A                               $0.42 - $0.48   Depreciation, depletion and amortization
                Drilling and completion costs      $0.22 - $0.28   Costs incurred to drill and to make the well ready for production

                                                                                                                                       40
China: high coal prices curtail buying interest in the seaborne market
CHINA THERMAL COAL IMPORTS/EXPORTS*                                                                                                   1Q22
 Unit: Mt
                                                                                                                                      ▪ GDP growth decelerated to 4.8% year-on-year in Q1 due to Covid-19 outbreaks.
                                 QUARTERLY (ANNUALIZED)                                                     ANNUAL                    ▪ The QHD price rose to above RMB1,500/t in Q1 despite the government aim to
                                                                                                                                        stabilize it below RMB900/t.
                                                                                                                                      ▪ Strong demand in January and February due to colder than normal weather, low
                                                                                                                                        inventory at ports, various industries resuming operation in March and falling imports
    IMPORT

                                                                                                                                        were the key drivers behind the soaring domestic coal prices.
                                                                         303
                                                                                                                                      ▪ Strict travel restrictions to prevent further spreading of the pandemic impacted truck
               279              293                                             284
                                       237
                                                           221    231                                224
                                                                                                              260
                                                                                                                      240               transport for coal.
                                                    195
                       139
                                             170
                                                                                       150                                            ▪ High import prices played a vital role in the tightness as cost of domestic coal lower
                                                                                                                                        than imported coal drove buyers to buy more domestic coal and tightened domestic
   EXPORT

                                                                                                                                        supply.
                   3    4       2      0      2      0      1      0      2      1      1

               3Q19    4Q19    1Q20   2Q20   3Q20   4Q20   1Q21   2Q21   3Q21   4Q21   1Q22
                                                                                                      1       1        1              ▪ Indonesian export ban also contributed to weak thermal coal imports in Q1.
              Sources: Banpu MS&L                                                                    2020    2021    2022E            ▪ Despite the weaker coal demand from power generation and industrial activities,
                                                                                                                                        China continues to boost its domestic coal supply to ensure energy security.
                                                                                                                                        Domestic raw coal output registered a 10.3% year-on-year growth in Q1.
CHINA DOMESTIC COAL PRICES
 Unit: RMB/t                                                                                                                          OUTLOOK
2,000                                                                                                                                 ▪ China’s GDP is expected to slow further to 4.4% in Q2 due to full and partial
                              > 5,800 kcal/kg                                                                                           lockdowns across China in March and April which caused coal demand to fall.
1,800
                              > 5,500 kcal/kg
1,600                         > 5,000 kcal/kg
                                                                                                                                      ▪ The government will cap term contract price at RMB570-770/t from 1 May, this
1,400                                                                                                                                   discourages end-users from restocking until end of April.
1,200                                                                                                                                 ▪ The government is helping Gencos to sign more contract volume with miners. So,
1,000                                                                                                                         1,350     Gencos will have little interest spot demand cargos in the shoulder season.
 800                                                                                                                                  ▪ Domestic coal production will remain strong.
                                                                                                                              1,100
 600                                                                                                                                  ▪ China has cut import tariffs for all coal to zero from 1 May 2022 to 31 March 2023 on
                                                                                                                               950      concerns over supply stem from expectations of a strong rebound in power demand
 400
                                                                                                                                        when the lockdowns end, and the warmer months roll round.
 200
            2016                2017                2018                 2019                 2020          2021             2022     ▪ More incentives are provided to accelerate the economic recovery. We expect power
                                                                                                                                        demand to recover from mid-May.
                                                                                                                                      ▪ However, soaring seaborne prices continued to curtail China’s buying interest.
  Note: *Includes lignite but excludes anthracite imports/exports
  Source: www.sxcoal.com/cn 12 April 2022                                                                                                                                                                                        41
India: high seaborne coal prices depressed imports
INDIA THERMAL COAL IMPORTS*                                                                          1Q22
Unit: Mt                                                                                             ▪ Total electricity generation remained strong and grew by c. 3% year-on-year in
                        QUARTERLY (ANNUALIZED)                                      ANNUAL             Q1. Yearly growth in coal-based generation stood at 2%.
                                                                                                     ▪ Domestic coal production in Q1 was 263 Mt, up 8% year-on-year. Coal
                                                                                                       dispatches were 223 Mt, increased by 10% year-on-year but remained well
                                                                                                       below production level. This is mainly because of insufficient wagon’s
                                                                                                       availability for coal transportation.
                                                                                                     ▪ However, domestic supply growth still failed to keep pace with demand
                                                                                                       growth, forcing producers to continue prioritizing supply to power sector.
                                                                                                     ▪ Non-power sectors have been forced to meet their coal requirements through
                                                                                                       costly imports and/or domestic spot supply.
                                                                                                     ▪ Limited availability in spot market increased competition and pushed domestic
                                                                                                       spot prices higher.
                                                                                                     ▪ Many imported coal-based plants continued to operate at low utilization rates
                                                                                                       in Q1 with the average plant load factor (PLF) standing at just 42% compared
                                                                                                       to 61% in Q1 last year.
                                                                                                     ▪ Cement makers largely remained out of the seaborne market, relying instead
                 183                              178
           173                       172                                                               on domestic petcoke, only a few are understood to be seeking for imports.
   150                                     154
                                                                             148                     Outlook
                              133                                                    137      132
                                                                      115                            ▪ As India enters summer, coal-based generation is expected to surge
                        107                             108    110
                                                                                                       significantly. Hence coal supply, both domestic and imported, must be ramped
                                                                                                       up significantly to sustain summer demand and enter monsoon season with
                                                                                                       ample stocks.
                                                                                                     ▪ Government has urged power producers to ramp up imports substantially to
                                                                                                       avert any further supply shocks.
                                                                                                     ▪ Government also allows power producers to pass on the incremental fuel cost
                                                                                                       through pass-through in electricity tariffs.
  3Q19           1Q20         3Q20         1Q21         3Q21         1Q22E   2020    2021    2022E   ▪ However, a surge in seaborne coal prices keep many buyers to continue
                                                                                                       scouting for domestic coal but logistical bottlenecks limit domestic supply and
                                                                                                       increase risk of power shortage.
Note: *Includes lignite grade imports                                                                ▪ Upside coal imports require a correcting seaborne coal prices.
Source: Commodity Insights, Banpu MS&L
                                                                                                                                                                                         42
Coal quarterly output summary
       AUSTRALIA OPERATIONS: COAL OUTPUT (MT) – ROM OUTPUT ON EQUITY BASIS
       Mines                                                   CV (kcal/kg)*                             3Q21                                4Q21                     1Q22                     2Q22e
       Western operations                                                                                  1.2                                1.3                      0.8                       1.5
       Springvale                                                   6,700                                  0.4                                0.7                      0.1                       1.0
       Clarence                                                     6,700                                  0.4                                0.3                      0.4                       0.3
       Airly                                                        6,700                                  0.4                                0.3                      0.3                       0.2
       Northern operations                                                                                 1.5                                0.8                      0.9                       1.4
       Mandalong                                                    6,700                                  1.2                                0.6                      0.7                       1.1
        Myuna                                                       6,700                                  0.3                                0.2                      0.2                       0.3
       Total Australia coal                                                                                2.7                                2.1                      1.7                       2.9

       INDONESIA OPERATIONS: COAL OUTPUT (MT) – ROM OUTPUT ON 100% BASIS
       Mines                                                    CV (kcal/kg)*                         3Q21                                   4Q21                     1Q22                     2Q22e
                                                                                               Output    Strip ratios                 Output    Strip ratios   Output    Strip ratios   Output     Strip ratios
                                                                                                (Mt)       (bcm/t)                     (Mt)       (bcm/t)       (Mt)       (bcm/t)       (Mt)        (bcm/t)
        Indominco                                               5,950 – 6,250                    1.8         11.5                       1.9         9.6          1.5          9.8         1.7          10.6
        Trubaindo                                                                                1.0         11.6                       1.2         9.0          0.7         15.5         0.7          14.8
                                                                6,550 – 6,700
        Bharinto                                                                                  1.4               6.3                1.2           6.6        1.1           8.8        1.2            7.9
        Kitadin-Embalut**                                            5,800                        0.3              24.4                0.4          15.5        0.2          17.9         -              -
        Jorong                                                       5,300                        0.2              11.8                0.2          15.5        0.3          11.5        0.2           15.9
       Total Indonesia coal                                                                       4.6              10.7                4.9           9.6        3.8          11.1        3.8           10.8

       CHINA OPERATIONS: COAL OUTPUT (MT) – ROM OUTPUT ON 100% BASIS
       Mines                                                   CV (kcal/kg)*                             3Q21                                4Q21                     1Q22                     2Q22e
       Gaohe                                                                                              2.3                                 2.3                      2.5                      2.3
       Hebi                                                                                               0.2                                 0.2                      0.1                      0.2
       Total China coal                                                                                   2.5                                 2.5                      2.6                      2.5

 Note: *CV figures are air-dried basis ** Kitadin-Embalut has ceased its operation and entered mine closure period in February 2022                                                                               43
Key external and corporate events

                                                        US inflation exceeded                            BoT maintained                                     Russia launches           Federal Reserve         US inflation
                                                          6%, highest level in                            its policy rates                                       invasion in          raised the policy       records
                                                                      30 years                                  at 0.50%                                             Ukraine             rate by 0.25%        41-year high
                     INDIRECT

                                                                                                                                                                                                              inflation rate
                                                                                                                                                                                                              of 8.4%
  EXTERNAL EVENTS

                                 Henry Hub        Newcastle coal                 46 countries pledged to stop                     Newcastle coal                          Newcastle coal              Henry Hub
                     DIRECT

                                    price hit     price index                    development of unabated CFP                      price index returns                         price index         price lowers to
                                $6.3/MMBtu        surpasses $250/t               and phase-out of unabated                        to $200/t levels                    surpasses to $350/t            $5.5/MMBtu
                                                                                 coal power by 2040-50

                                                                        4Q21                                                                                 1Q22
  CORPORATE EVENTS

                                                  Announcement of                  Kesennuma       Ha Tinh Solar             Achieved COD                                      Solar Esco JSC
                                                Sunseap divestment                 Solar started   acquisition                 of Shirakawa                                      acquisition in
                                                                                    commercial                                solar in Japan                                          Vietnam
                                                                                      operation

                                                       Engie Services            3Q21 results                                              Chu Ngoc and        Completion of              FY21 &
                                                           (Thailand)            presentation                                              Nhon Hai solar          Sunseap            4Q21 results
                                                          Acquisition                                                                         acquisition        divestment           presentation

                                                                                                                                                                                                                           44
FX impact analysis guidance on P&L

CURRENCY EXPOSURE      NPAT IMPACT 1Q22 (US$M)   APPROXIMATE FX EXPOSURE (US$M)       NPAT 5% SENSITIVITY 2Q22 (US$M)
                                                         NET LIABILITY   NET ASSET   Assuming 5% depreciation of local currencies against USD

                                                                                                                               ▪ BOT cut
                                                                                                                                 forecast growth
Banpu: AUD asset,                                                                                                                for 2022 to
                                                 -1700                                        THB                                3.2% and 2023
THB bond, and Other                                                                                              86              to 4.4%

                                                                         300
                                    7.0
                                                                                         AUD -15

 ITMG: IDR asset and         -1.6                                                                           ▪ BI cut forecast 2022 GDP to
 liabilities                                                             290
                                                                                                              4.5%-5.3%
                                                                                           IDR

                                                                                                 -9

                                                                                                           ▪ RBA cut forecasted growth
 CEY: USD asset and                        5.0    -160                                     AUD -8            for 2022 to 4.25% and 2023
 liabilities                                                                                                 to 2%

                                                                                              NET
Net
                                          10.4
                                                                                                               54

                                                                                                                                                   45
Banpu consolidated balance sheet – 1Q22
1Q22 CONSOLIDATED FINANCIAL POSITION                               DEBT FX STRUCTURE                                 GEARING RATIOS

USD million

         CASH EQUIVALENT                                                               RMB Float
                                                                                         1%
                 1,632                                                                                      AUD         Net debt / Equity 1 (x)
                                                                                                          Fixed 1%

                                                                                   THB        USD Fixed                       1.47x               1.31x
                                          TOTAL BORROWINGS                         Float        12%                                                       1.10x
                                                    6,000             AUD          16%
                                                                      Float
                                                                       5%
                                                                                                      THB
                                                                                                      Fixed
               ASSETS                                                                                 33%
                                                                                   USD
                9,851                                                              Float
                                            OTHER LIABILITIES                      32%
                                                                                                                        Net market gearing 2 (%)
                                                    2,163

                                                 TOTAL
                                             SHAREHOLDERS’                                                                     59%                 57%
                                                EQUITY                                                                                                    52%
                                                    3,320

                                                                              Total gross debt: US$6 billion
            TOTAL ASSETS                   TOTAL LIABILITIES AND                  As of 31 March 2022                         2020                2021    1Q22
                                          SHAREHOLDERS' EQUITY

      Note:
      1 Net debt to book value of shareholders' equity
      2 Net debt to enterprise value (enterprise value
        = net debt + book value of shareholders' equity)

                                                                                                                                                                  46
Banpu group EBITDA breakdown
                                                                                                                       530 666 596
                                                                                                            308
                     USD million                                                      & holding
                                                                                     companies
                                                                                                            2Q21 3Q21 4Q21 1Q22

          100%                                     68%                                                                                    79%
                                                                                                   AACI OVERHEAD                                                                                     U.S. SHALE GAS
                                                                                                                                                                                                               207 167
                       33   55    8    8                        287 368 322                                                                                                                              122
                                                         133                                                                                      37        3       27        37                   71
                                                                                                  -1        -1        -1        -5
                      2Q21 3Q21 4Q21 1Q22                2Q21 3Q21 4Q21 1Q22                      2Q21 3Q21 4Q21 1Q22                             2Q21 3Q21 4Q21 1Q22                             2Q21 3Q21 4Q21 1Q22

                                                                    Indominco                                    Gaohe                                          BLCP
                    All figures are
                    100% basis                                       89   99    91                      193 149 187
                                                               59                                   119                                     50%         14      9
                                                                                        45%                                                                              12        0
                    except for
                                                                                                                                                       2Q21 3Q21 4Q21 1Q22
                    Centennial                              2Q21 3Q21 4Q21 1Q22                    2Q21 3Q21 4Q21 1Q22

                    which is equity                                 Trubaindo
                                                                                                                                                                    HPC
                                                                                                                  Hebi
                    basis                                                 148
                                                                     79         89
                                                               20                                                                                      117 69            94    78
                                                                                                                                            40%
                                                                                        40%             -    -13 -13 -17
                                                            2Q21 3Q21 4Q21 1Q22
                                                                                                    2Q21 3Q21 4Q21 1Q22                                2Q21 3Q21 4Q21 1Q22
                                                                    Bharinto
                                                                    105 110 116                                                                                  BIC*
                                                               46
                                                                                                                                                        0       2                  7
                                                            2Q21 3Q21 4Q21 1Q22                        -1        -1        -1        -1                                  -3
                                                                                                   2Q21 3Q21 4Q21 1Q22                                 2Q21 3Q21 4Q21 1Q22
                                                                     Kitadin
                                                                                                                                                                                                                                        70%
                                                                          24    27
                                                               5     8                                                                                          Luannan                      Zhending
                                                                                                                                                                                                                              Zouping
                                                            2Q21 3Q21 4Q21 1Q22                                                                         3                                                                                2
                                                                                                                                                                0                  2          0           3                   1    3
                                                                     Jorong                                                                                              -3             -2          -1                   -1
                                                                                                                                                    2Q21 3Q21 4Q21 1Q22                2Q21 3Q21 4Q21 1Q22            2Q21 3Q21 4Q21 1Q22

                                                               -3    -2   -4    -2
                                                            2Q21 3Q21 4Q21 1Q22

 Note: all ownership 100% unless otherwise shown                                                                                                                                                  Consolidated        NOT consolidated
 *BIC = Banpu Investment China
                                                                                                                                                                                                                                              47
Banpu group net debt breakdown

                                                                                                                                                                              Consolidated
                                                                                                   4,477 4,425 4,792 4,368
             USD million
                                                                                                                                                                              NOT consolidated
                                                                                       & holding
                                                                                      companies                                                                               Net debt

                                                                                                                                                                              Net cash
                                                                                                   2Q21   3Q21   4Q21    1Q22

                                   65%        INDONESIA COAL     100%      AUSTRALIA COAL                              100%     AUSTRALIA POWER                79%       POWER

                                                                        AUD million
                                                                                                                 AUD million
                                                                                                                                                                       426    356
                               -350                                     613 604 560 565
                                       -470                                                                             156     161                     198     212
                                                -655
                                                                                                                 N/A                    79
                                                          -886
                                                                    2Q21 3Q21 4Q21 1Q22                          2Q21   3Q21    4Q21   1Q22             2Q21    3Q21   4Q21   1Q22
                               2Q21    3Q21     4Q21      1Q22
                    Note: Cash $922 M, Debt $36 M

                         45%                        CHINA COAL                                                                     50% THAILAND POWER          40%      LAOS POWER                    100% CHINA POWER

                                      Gaohe                                                                                            BLCP                          HPC                                BIC*
                               117 94
                                                                                                                               300 301 295 275          1,670 1,529 1,563 1,435
                                                                                                                                                                                                 16    13   11   17
                                              -69 -94
                                                                                                                               2Q21 3Q21 4Q21 1Q22      2Q21    3Q21   4Q21   1Q22               2Q21 3Q21 4Q21 1Q22
                              2Q21 3Q21 4Q21 1Q22
                          Note: Cash $121 M, Debt $52 M

 Note: all ownership 100% unless otherwise shown
 *BIC = Banpu Investment China                                                                                                                                                                                         48
Banpu consolidated: operating profit

        USD million                                               1Q22    4Q21    1Q21    QoQ%   YoY%
      Total sales revenues*                                       1,256   1,427   736     -12%   71%
      Sales revenue – Coal**                                      828     991     461     -16%   80%
      Sales revenue – Gas                                         279     314     186     -11%   50%
      Sales revenue – Power                                       126     102      67     23%    88%
      Cost of sales                                               (666)   (735)   (508)
      Gross Profit*                                               590     692     227     -15%   159%
      Gross profit – Coal**                                       427     503     121     -15%   253%
      Gross profit – Gas                                          153     199     105     -23%   46%
      Gross profit – Power                                         9       -4      16      na    -45%
      GPM                                                         47%     49%     31%
      GPM – Coal                                                  52%     51%     26%
      GPM – Gas                                                   55%     63%     56%
      GPM – Power                                                  7%     -4%     23%

 Note: * including other businesses   ** including coal trading                                         49
Banpu consolidated: operating profit

    USD million                 1Q22    4Q21    1Q21   QoQ%   YoY%
   Gross Profit                 590     692     227    -15%   159%
   GPM                          47%     49%     31%
   SG&A                         (112)   (124)   (81)
   Royalty                      (85)    (106)   (44)
   Income from associates        62      57      43
   Other income and Dividend     12      19      11
   Mining property               (5)     (6)     (8)
   EBIT                         463     531     148    -13%   213%
   EBIT – Coal                  320     344      44    -7%    623%
   EBIT – Gas                   130     179      82    -28%   59%
   EBIT – Power                  23      18      36    28%    -41%
   EBIT – Energy Technology     (10)    (10)    (14)   n.a.   n.a.
   EBITDA                       596     666     274    -10%   117%
   EBITDA – Coal                400     439     138    -9%    191%
   EBITDA – Gas                 167     207     108    -19%   54%
   EBITDA – Power                37      27      40    36%    -13%
   EBITDA – Energy Technology    (7)     (7)    (12)   n.a.   n.a.

                                                                     50
Banpu consolidated: net profit

        USD million                                                     1Q22    4Q21    4Q20   QoQ%   YoY%

      EBIT                                                              463     531     148    -13%   213%

      Interest expenses                                                 (50)    (47)    (43)
      Financial expenses                                                 (2)     (2)     (2)
      Income tax (core business)                                        (60)    (76)    (20)
      Minorities                                                        (80)    (81)    (26)
      Net profit before extra items                                     271     325      58    -16%   367%

      Non-recurring items*                                              192     (12)     (5)
      Gain (Loss) on Derivatives Transactions                           (148)   (215)    (5)
      Income tax (non - core business)                                   (0)     (8)     (0)
      Deferred tax income (expenses)                                    (15)     26     (26)
      Net profit before FX                                              300     115      21    160%   1307%

      FX translation                                                     10     (11)     29
      Net Profit                                                        311     105      51    197%   512%

      EPS (US$/share)                                                   0.046   0.017   0.01

 Note: * income from non-core assets and other non-operating expenses                                         51
Centennial: income statement
   USD million                   1Q22      4Q21      1Q21      QoQ%   YoY%
  Sales volume (Mt)               1.5       2.2       2.6      -32%   -43%
  Sales revenue                  147.1     205.3     162.3     -28%   -9%
  Cost of Sales                  (136.4)   (194.4)   (164.7)
  Gross Profit                    10.7      10.9      (2.4)    n.a.   n.a.
  GPM                             7%        5%        -1%
  SG&A                           (19.3)    (25.0)    (20.3)
  Royalty                         (8.4)    (12.6)    (10.6)
  Other income                    1.6       2.1       1.4
  Other expenses                    -         -         -
  EBIT                           (15.3)    (24.6)    (31.9)    n.a.   n.a.
  Interest expenses               (7.8)     (7.9)     (5.6)
  Financial expenses              (0.5)     (0.9)     (0.7)
  Gain (loss) on exchange rate    5.0       7.6       0.2
  Gain (loss) on derivative       0.3      (14.0)     (2.4)
  Corporate income tax              -         -         -
  Deferred tax income             6.2       15.2      12.1
  Net Profit                     (12.2)    (24.6)    (28.3)    n.a.   n.a.

                                                                             52
Australia coal: quarterly equity rom output
       Total equity ROM (Mt)
                                                                                                                                                                       PLANNED
                                                                ACTUAL                                                                                               (INDICATIVE
           5.0                                                                                                                                                          ONLY)

           4.5
           4.0
           3.5                                                                                                                                                               3.2
                                                                                                                                                    2.9                                           2.9
                                                                             2.7

                                                                                                                                                                                                                 NORTHERN
           3.0
                            2.4                     2.3
           2.5                                                                                       2.1                                                                     1.5
                                                                                                                            1.7                     1.4                                           1.2
           2.0                                                               1.5
                            1.3                     1.1                                              0.8
           1.5

                                                                                                                                                                                                                 WESTERN
                                                                                                                           0.9
           1.0                                                                                                                                                               1.7                  1.7
                                                    1.2                      1.2                     1.3                                            1.5
           0.5              1.1                                                                                            0.8
           0.0
                          1Q21                    2Q21                     3Q21                   4Q21                    1Q22                   2Q22e                      3Q22e                4Q22e

                                                                     2021                                                                                       2022e
            LW move         Jan     Feb    Mar    Apr     May     Jun      Jul   Aug   Sep     Oct    Nov     Dec       Jan    Feb      Mar   Apr    May       Jun    Jul    Aug    Sep   Oct    Nov    Dec

            Mandalong            4                                    7                                2                           3                            3                           3
            (100%)              wks                                  wks                              wks                         wks                          wks                         wks
            Springvale                                                                                                             7
            (100%)                                                                                                                wks

                                                                                                                                 Normal production              Bolt-up/commissioning            LW relocation

            Note: 1 Production generally responds to the timing of longwall changeovers (i.e., lower production results during a longwall changeover period)
                  2 As of 1 December 2019, Centennial’s economic interest in each of Angus Place and Springvale became 100%.

                                                                                                                                                                                                                            53
54
You can also read