Huntington's disease mice and human brain tissue exhibit increased G3BP1 granules and TDP43 mislocalization - Yeo Lab
←
→
Page content transcription
If your browser does not render page correctly, please read the page content below
Huntington’s disease mice and human brain tissue exhibit
increased G3BP1 granules and TDP43 mislocalization
Isabella I. Sanchez, … , Robert C. Spitale, Leslie M. Thompson
J Clin Invest. 2021;131(12):e140723. https://doi.org/10.1172/JCI140723.

 Research Article   Neuroscience

Chronic cellular stress associated with neurodegenerative disease can result in the persistence of stress granule (SG)
structures, membraneless organelles that form in response to cellular stress. In Huntington’s disease (HD), chronic
expression of mutant huntingtin generates various forms of cellular stress, including activation of the unfolded protein
response and oxidative stress. However, it has yet to be determined whether SGs are a feature of HD neuropathology.
We examined the miRNA composition of extracellular vesicles (EVs) present in the cerebrospinal fluid (CSF) of patients
with HD and show that a subset of their target mRNAs were differentially expressed in the prefrontal cortex. Of these
targets, SG components were enriched, including the SG-nucleating Ras GTPase-activating protein-binding protein 1
(G3BP1). We investigated localization and levels of G3BP1 and found a significant increase in the density of G3BP1-
positive granules in the cortex and hippocampus of R6/2 transgenic mice and in the superior frontal cortex of the brains of
patients with HD. Intriguingly, we also observed that the SG-associated TAR DNA-binding protein 43 (TDP43), a nuclear
RNA/DNA binding protein, was mislocalized to the cytoplasm of G3BP1 granule–positive HD cortical neurons. These
findings suggest that G3BP1 SG dynamics may play a role in the pathophysiology of HD.

Find the latest version:
https://jci.me/140723/pdf
The Journal of Clinical Investigation                                                                                                                                RESEARCH ARTICLE

Huntington’s disease mice and human brain tissue
exhibit increased G3BP1 granules and TDP43
mislocalization
Isabella I. Sanchez,1 Thai B. Nguyen,1 Whitney E. England,2 Ryan G. Lim,3 Anthony Q. Vu,4,5 Ricardo Miramontes,3
Lauren M. Byrne,6 Sebastian Markmiller,4,5 Alice L. Lau,7 Iliana Orellana,8 Maurice A. Curtis,9,10 Richard Lewis Maxwell Faull,9,10
Gene W. Yeo,4,5 Christie D. Fowler,1 Jack C. Reidling,3 Edward J. Wild,6 Robert C. Spitale,2,11 and Leslie M. Thompson1,3,7,8
Department of Neurobiology & Behavior, 2Department of Pharmaceutical Sciences, and 3Institute for Memory Impairment and Neurological Disorders, University of California, Irvine, California, USA.
1

4
    Department of Cellular and Molecular Medicine, and 5Institute for Genomic Medicine and UCSD Stem Cell Program, University of California San Diego, La Jolla, California, USA. 6UCL Huntington’s Disease
Centre, UCL Queen Square Institute of Neurology, University College London, United Kingdom. 7Department of Psychiatry & Human Behavior, and 8Sue and Bill Gross Stem Cell Center, University of
California, Irvine, California, USA. 9Department of Anatomy and Medical Imaging, Faculty of Medical and Health Science, and 10Centre for Brain Research, Faculty of Medical and Health Science, University of
Auckland, Auckland, New Zealand. 11Department of Chemistry, University of California, Irvine, California, USA.

                Chronic cellular stress associated with neurodegenerative disease can result in the persistence of stress granule (SG)
                structures, membraneless organelles that form in response to cellular stress. In Huntington’s disease (HD), chronic expression
                of mutant huntingtin generates various forms of cellular stress, including activation of the unfolded protein response and
                oxidative stress. However, it has yet to be determined whether SGs are a feature of HD neuropathology. We examined the
                miRNA composition of extracellular vesicles (EVs) present in the cerebrospinal fluid (CSF) of patients with HD and show that
                a subset of their target mRNAs were differentially expressed in the prefrontal cortex. Of these targets, SG components were
                enriched, including the SG-nucleating Ras GTPase-activating protein-binding protein 1 (G3BP1). We investigated localization
                and levels of G3BP1 and found a significant increase in the density of G3BP1-positive granules in the cortex and hippocampus
                of R6/2 transgenic mice and in the superior frontal cortex of the brains of patients with HD. Intriguingly, we also observed
                that the SG-associated TAR DNA-binding protein 43 (TDP43), a nuclear RNA/DNA binding protein, was mislocalized to the
                cytoplasm of G3BP1 granule–positive HD cortical neurons. These findings suggest that G3BP1 SG dynamics may play a role in
                the pathophysiology of HD.

Introduction                                                                                                interfere with general protein synthesis to optimize cell survival
Huntington’s disease (HD) is a progressive, inherited neurode-                                              and stress recovery (6). One of these translation factors, eIF2α,
generative disease caused by an expanded CAG repeat in exon 1                                               is inactivated in HD due to ER stress. This alteration is proposed
of the huntingtin (HTT) gene (1), encoding an expanded polyglu-                                             to play an important role in striatal cell death (7). Overall, these
tamine repeat tract within the HTT protein. Although HD is char-                                            studies suggest a direct connection between the regulated expres-
acterized by pathology that most prominently affects neurons of                                             sion of translation factors, but any evidence of how these are reg-
the striatum, human autopsy studies show that other brain areas                                             ulated is not understood.
are also impacted.                                                                                               HD appears to involve progressive spreading of neuropathol-
     The expression of mutant HTT gives rise to cellular stress                                             ogy (8), and recent findings suggest that the spreading effect that
responses, including oxidative and endoplasmic reticulum (ER)                                               is characteristic of many neurodegenerative disorders could be
stress, potentially as a neuroprotective strategy against cellu-                                            mediated by extracellular vesicles (EVs) (9, 10). EVs that contain
lar toxicity (2–5), which converge on key translation factors and                                           RNA, protein, and lipids can transfer their contents to other cells
                                                                                                            and mediate intra- and intercellular signaling (11, 12) and could
                                                                                                            facilitate the spread of pathology between brain regions (9). One
Conflict of interest: EJW reports a grant and personal fees from F. Hoffmann-La
                                                                                                            type of EVs are exosomes, 40 to 150 nm vesicles of multivesicular
Roche Ltd and personal fees from Triplet Therapeutics, PTC Therapeutics, Shire
Therapeutics, Wave Life Sciences, Mitoconix, Takeda, Loqus23. All honoraria for the
                                                                                                            body (MVB) origin secreted by several cell types, including neural
consultancies were paid through the offices of UCL Consultants Ltd., a wholly owned                         cells, that can be isolated from biofluids, including the cerebrospi-
subsidiary of University College London. GWY is a cofounder, member of the Board of                         nal fluid (CSF) (13). Due to the lack of consensus on specific exo-
Directors, member of the Scientific Advisory Board, equity holder, and paid consultant                      some markers and the recommendations put forth by the Interna-
for Locana and Eclipse BioInnovations.
                                                                                                            tional Society of Extracellular Vesicles (14), we will use the generic
Copyright: © 2021, American Society for Clinical Investigation.
Submitted: May 28, 2020; Accepted: April 28, 2021; Published: June 15, 2021.
                                                                                                            term EV for cell-secreted nanovesicles.
Reference information: J Clin Invest. 2021;131(12):e140723.                                                      The composition of EVs is highly regulated. Comparisons
https://doi.org/10.1172/JCI140723.                                                                          between in cellulo RNA content and EV RNAs demonstrate selec-

                                                                                                                                                                                                         1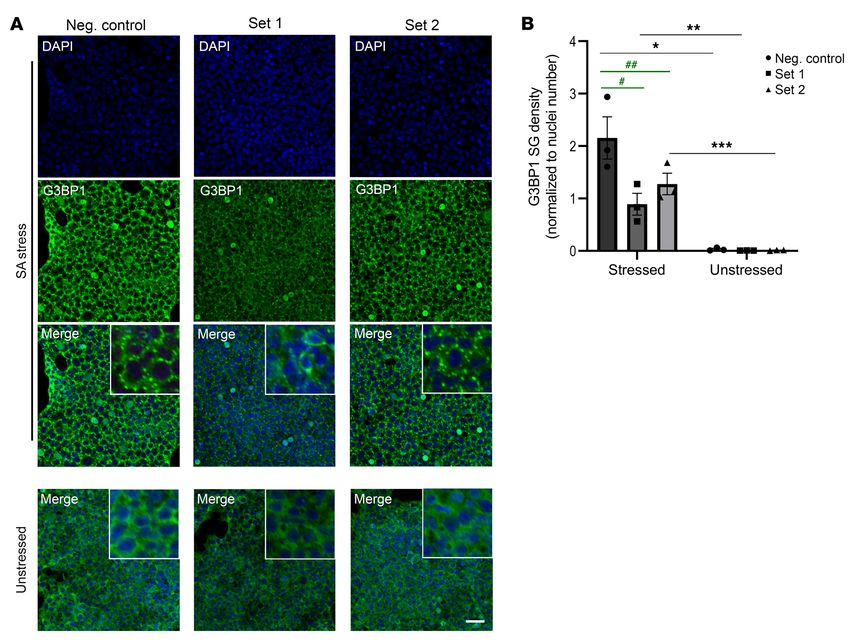
RESEARCH ARTICLE                                                                                          The Journal of Clinical Investigation

                                                                              cortex, and a similar pattern of immunoreactivity was detected in
Table 1. Clinical features of patient CSF samples used for EV                 the human parietal cortex and hippocampus. Intriguingly, we also
miRNA extraction and next generation sequencing studies                       observed TAR DNA-binding protein 43 (TDP43) mislocalization
Clinical features        Huntington’s disease          Healthy controls       from having exclusively nuclear staining in control tissue to nucle-
Number of subjects                10                         10
                                                                              ar and cytoplasmic staining in HD brain, similar to that observed
Mean age, years                  51.1                       50.4              in ALS/FTD, where persistent SG formation is also observed (29).
Sex, female/male                 5/5                        5/5
CAG nucleotide repeat           40–45                       N/A               Results
length                                                                        Characterization of HD and control CSF extracellular vesicles.
Disease stageA                 Early HD                      N/A              Because EV-packaged miRNAs distributed via the CSF can alter
A
 Standard disease stage according to total functional capacity (112).         gene expression (9) and have potential to serve as biomarkers
                                                                              (30), we investigated whether differential miRNA packaging
                                                                              into CSF EVs occurs to alter the miRNA profile of patients with
                                                                              HD compared with unaffected individuals. EVs were isolated by
tive enrichment of specific EV RNA (15), suggesting regulation of             membrane affinity column centrifugation from 10 HD patient
RNA loading into EVs (16, 17). MicroRNAs, small RNA molecules                 and 10 control CSF samples, and RNA contents extracted for
(~22 nucleotides) that regulate posttranscriptional gene expres-              miRNA sequencing. CSF samples, provided through HDClarity,
sion by acting as guide molecules to promote the degradation or               were acquired by lumbar puncture (see Methods). Patient demo-
translational repression of their target mRNAs, are enriched in               graphic characteristics are summarized in Table 1. Given that the
EVs. The human genome encodes approximately 2000 miRNAs                       profile of CSF miRNAs varies between vesicular and nonvesicular
and it is predicted that they collectively regulate one third of the          fractions, and that the distribution of their mode of transport can
genes in the genome (18). Given that environmental stressors,                 differ between normal and pathological conditions (31, 32), we
including heat shock and hypoxia, can modify the miRNA com-                   employed a membrane affinity-based approach to isolate miRNAs
position of EVs (19), it is plausible that disease-mediated cellular          from CSF EVs, which ensures that nonvesicular CSF miRNAs are
stress, such as that caused in neurodegenerative disease, can mod-            washed out prior to final elution. To characterize the size distri-
ify the miRNA composition of CSF EVs.                                         bution of the EV fractions collected, we performed fluorescent
     Cell-to-cell shuttling of miRNAs via EVs is a critical mediator          nanoparticle tracking analysis (F-NTA) on a subset of 5 HD and
of transcriptional regulation in recipient cells (9, 20). There is evi-       control CSF samples. This NTA method prevents the inclusion of
dence that selected groups of miRNAs are altered in HD cells and              protein aggregates, membrane fragments, and background parti-
tissues (21–24), which suggests that miRNA dysregulation might                cles present in heterogeneous biofluid samples. Each sample was
be involved in gene expression changes detected in the HD brain,              measured in triplicate, and videos of data collection (Supplemen-
and in turn affect cellular function. A recent study identified an EV         tal Videos 1–20; supplemental material available online with this
miRNA secreted from the choroid plexus, a tissue located in the               article; https://doi.org/10.1172/JCI140723DS1) were analyzed to
ventricles, which produces the majority of the CSF, that regulates            give the mean, mode, and estimated concentration for each parti-
adult neurogenesis at the subependymal zone by repressing trans-              cle size (Supplemental Figure 1). Because EV subtypes are gener-
lation of neural fate determinants (25). Thus, EV miRNAs secreted             ally characterized by size, and the CSF is likely to contain a hetero-
into the CSF of patients with HD could be taken up by brain tissues           geneous mixture of EVs, we analyzed EV particle concentration
situated near the ventricular zone and regulate the translation of            by EV size increments of 25 nm. We did not detect a significant
selected proteins, thereby playing a role in the propagation of               difference in concentration of any EV size subtype between HD
pathology in the brains of patients with HD.                                  and control CSF samples (Figure 1A). Similarly, we did not detect
     To investigate the composition of EV miRNAs secreted into the            a significant difference in mode diameter size, or overall particle
CSF, we isolated EVs from HD and control CSF to assess changes                concentration (Figure 1, B and C).
in packaged miRNAs. Among the genes targeted by dysregulated                       Cerebrospinal fluid extracellular vesicles from patients with HD
miRNAs are stress granule (SG) components, including the Ras                  contain miRNAs that target SG-associated genes. During the miRNA
GTPase-activating protein-binding protein 1 (G3BP1), a critical               Library Kit construction process, each individual miRNA mole-
effector of SG assembly (26) and central node of the core SG net-             cule was tagged with a Unique Molecular Index (UMI). Following
work (27) in eIF2α-mediated mechanisms of SG formation. Cells                 sequencing and trimming, reads were analyzed for the presence
respond to stress signals through formation of SGs, cytoplasmic               of UMIs and an average of approximately 10 million reads was
assemblies of protein, and RNAs that form in response to stressors            generated per mapped sample. Differential expression analysis
such as hypoxia, heat-shock, and sodium arsenite, which all inhibit           of the HD versus control samples was carried out using DESeq2.
translation initiation (28). We examined whether this enrichment              We did not detect any statistically significant differences after cor-
of SG targeting miRNAs in CSF could be reflected by SG pathology              recting for multiple comparisons using the Benjamini-Hochberg
in HD tissues. We evaluated R6/2 mouse and human HD postmor-                  method. A subsequent sample size analysis (33) was carried out
tem brain tissue for altered G3BP1 granule dynamics and found                 using a coefficient of variation estimated from this DESeq2 differ-
that there is a marked increase in G3BP1 granules in the superior             ential expression analysis, which suggested that 143 samples per
frontal cortex of both R6/2 and human brains. This increase was               group would be needed to observe significant differences of about
particularly noted in pyramidal neurons of the superior frontal               a 2-fold change in expression. This calculation suggested a lim-

    2                                     J Clin Invest. 2021;131(12):e140723 https://doi.org/10.1172/JCI140723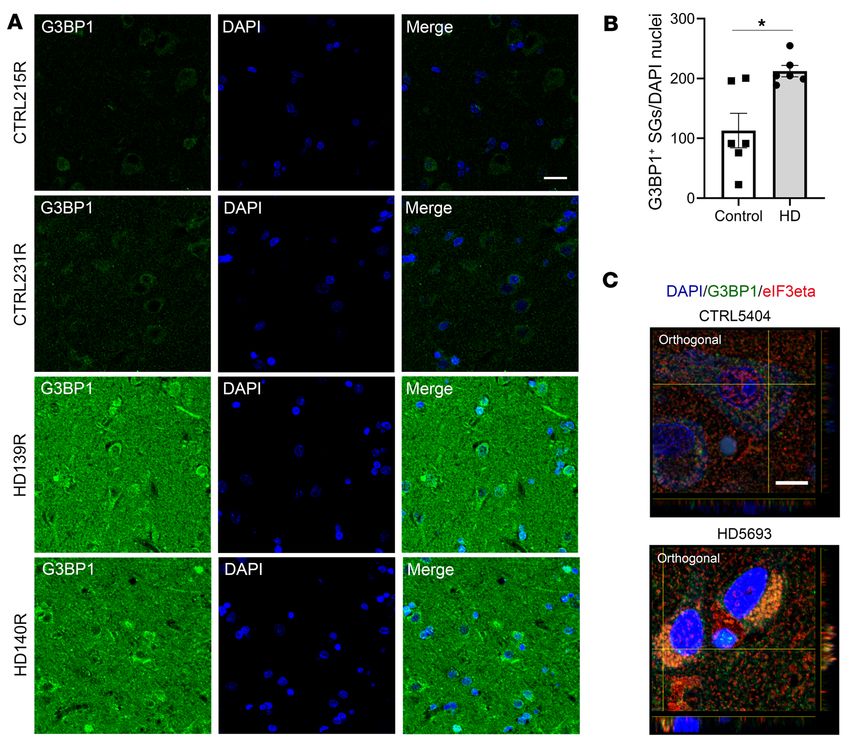
The Journal of Clinical Investigation RESEARCH ARTICLE
Figure 1. Characterization of CSF EV concentration and size using NTA. (A) A subset of CSF samples (n = 5 HD, 5 control) was used to determine the size
distribution of EVs using F-NTA. CSF EV particle concentration was characterized by EV size subgroups in increments of 25 nm (2-way ANOVA, Bonfer-
roni’s multiple comparisons test, P > 0.05), as well as by (B) mode size (Student’s t test, unpaired, 2-tailed, P > 0.05), and (C) concentration (Student’s t
test, unpaired, 2-tailed, P > 0.05). Data are representative of 1 independent experiment performed in triplicate with 5 HD and 5 control samples. Error bars
depict mean ± SEM.
itation in the ability to identify statistically significant expression translation of SG mRNAs, or indirectly induce the translation of
changes. However, we sought to investigate the potential func- SG mRNAs by silencing upstream negative regulators of SG com-
tional relevance of the CSF EV miRNAs detected in our studies by ponents. We asked whether SG genes are significantly enriched in
overlapping the predicted gene targets of the miRNAs detected in the list of gene targets belonging to these 41 miRNAs, and found
CSF EVs with a publicly available data set of genes that are differ- that 120 of 4689 CSF EV miRNA gene targets belong to the list
entially expressed (DEGs) in the prefrontal cortex of patients with of 464 mammalian SG genes (18), which is significantly higher
HD (34), a brain region proximal to the CSF which has the poten- than expected by chance (P = 0.002) (Figure 2B). G3BP1 was one
tial to serve as the recipient of CSF EV cargo. Our reasoning here of the SG genes that fit these criteria and is upregulated in the HD
is that miRNAs in the CSF may be coming from different cell types prefrontal cortex, together with other SG genes including TIAL1,
and thus some miRNAs could be very highly expressed in locally
released EVs to impart biology in close-proximity target cells, all
the while being undetectable from bulk CSF isolation.
Previous studies have integrated miRNA and mRNA expres-
sion profiles to better understand miRNA–mRNA interactions in
specific biological contexts (35, 36). Similarly, using the results
from the DESeq2 differential expression analysis of CSF EV mi
RNAs, we generated a list of 22 differential miRNAs (Supplemen-
tal Table 1) with a P value less than 0.05 before correcting for mul-
tiple comparisons, and another list of 59 miRNAs (Supplemental
Table 2) with log2FC values larger than a magnitude of 2 (81 mi
RNAs total) (Figure 2A). We next performed a target analysis on
the 81 miRNAs and generated a list of predicted mRNA targets.
The list of mRNA targets was then overlapped with a data set of
DEGs from the prefrontal cortex of patients with HD (34), and the
number of targets ranged from 72 to 2509 DEGs for each miRNA.
Since the expression level of a miRNA is negatively correlated to
the expression level of its target gene, we filtered out miRNAs
whose fold changes were not the inverse of their target genes 50%
or more of the time. This resulted in a list of 41 miRNAs that target
DEGs in the HD prefrontal cortex, and whose differential expres-
sion in HD CSF EVs is negatively correlated to at least 50% of their
prefrontal cortex DEG targets (Supplemental Table 3, GO enrich-
ment analysis of predicted gene targets in Supplemental Table 4). Figure 2. EV miRNAs in the CSF of patients with HD target SG-related
A high number of the miRNAs targeted the SG gene G3BP1, which mRNAs that are differentially expressed in the prefrontal cortex of
is a key SG nucleator, acting as the molecular switch that triggers patients with HD. (A) Workflow used to identify CSF EV miRNAs with like-
lihood of functional relevance based on overlap with RNA sequencing data
phase separation during SG formation (27). Therefore, we used
from the prefrontal cortex of patients with HD (34). (B) Overlap of 4689
this filtering approach to evaluate whether SG-related genes are CSF EV mRNA targets and 464 mammalian SG genes (74) is significantly
targets of these miRNAs detected in CSF EVs. In the context of SG higher than what is expected based on a genome larger than 21,000 genes
component regulation, miRNAs may either directly repress the (P < 0.002 using Fisher’s exact test).
J Clin Invest. 2021;131(12):e140723 https://doi.org/10.1172/JCI140723 3
RESEARCH ARTICLE                                                                                          The Journal of Clinical Investigation

                                                                              G3BP1 seed strength compared with the miRNA cocktail consisting
Table 2. Selected SG genes that are differentially expressed in               of 4 miRNAs. Although protein loading levels were normalized to
the prefrontal cortex of patients with HD                                     total protein load, as an additional control we measured hnRN-
SG gene                                 Log2 fold change                      PA2/B1 protein expression, which was not predicted to be a cotar-
                                                                              get of the miRNA cocktail based on seed strength scores. Indeed,
G3BP1                                      0.5599621
hnRNPH1                                   0.45091672                          hnRNPA2/B1 protein expression did not change with miRNA
hnRNPF                                    0.43315658                          treatment (Supplemental Figure 2, A and C–E). To investigate the
TIAL1                                     0.38008666                          temporal dynamics mediated by Set 1 miRNAs, we used 293T cells
hnRNPH3                                   0.34137037                          that express G3BP1 as a fusion protein with GFP (293T-G3BP1-
hnRNPA2B1                                 0.28290343                          GFP; ref. 44) and monitored overall GFP signal using the Incu-
hnRNPHC                                    0.24311714                         cyte S3 imaging system over a period of 36 hours in the presence
AGO1                                      –0.2403521                          of the set of microRNA mimics with the strongest effect (Set 1) or
hnRNPA0                                   –0.2603349                          nontargeting miRNA negative control. Cells transfected with the
FUS                                       –0.2683134                          Set 1 miRNA mimics had significantly lower G3BP1-GFP levels
Log2 fold change values from ref. 34.                                         at the 11, 12, 15, 17, and 25 hour time points when compared with
                                                                              cells transfected with the nontargeting miRNA negative control
                                                                              (P < 0.0001; Supplemental Figure 2, F and G). Of note, there were
                                                                              small frame shifts in the imaging plane that resulted in a small pop-
FUS, and various hnRNP RNA binding proteins (Table 2). Of note,               ulation of cells not being imaged repeatedly, which could explain
one of the 41 miRNAs was miR-1322, identified as a potential pro-             the difference in statistical significance between time points. We
dromal biomarker for HD in CSF samples containing both vesic-                 also performed an ordinary 2-way ANOVA with Bonferroni’s mul-
ular and extravesicular miRNAs (37). The majority of miR-1322                 tiple comparison, which showed significant differences at all time
binding sites are located in their targets’ coding domain sequences           points after 6 hours (P < 0.0001).
(CDS), many of which code for polyglutamine repeats, and include                   We hypothesized that treatment with the Set 1 miRNA cocktail
HTT (38). Overall, these results suggest that miRNAs packaged in              would result in lower SG seed formation (45) and thus decrease
vesicles may serve as regulators of stress response genes. As an              SG density upon cellular stress induction. SGs can be induced in
initial step to validate whether they do indeed target G3BP1, we              mammalian cells as a result of sodium arsenite treatment, a form
investigated whether miRNA overexpression is sufficient for the               of oxidative stress (46, 47). To test whether the miRNA cocktail
inhibition of G3BP1-positive granules in vitro.                               treatments have an effect on SG formation in vitro, we repeat-
     G3BP1 protein levels and G3BP1-positive granule density are              ed the transfection experiments in 293T cells using both sets of
reduced in 293T cells with the overexpression of miRNAs that are              miRNA mimics and subjected them to sodium arsenite treat-
predicted to target G3BP1. To determine whether the miRNAs pre-               ment to induce SG formation, detected by immunofluorescence
dicted to target G3BP1 could in fact regulate mRNA and protein                with an antibody against G3BP1. To quantitate SGs in 3D space,
expression of G3BP1, we tested sets of miRNA mimics in human                  we employed a masking method using the Imaris software that
immortalized 293T cells. The 293T cells have a high transfection
efficiency and are commonly employed to investigate SG dynamics
in vitro (39). The filtered CSF EV miRNAs obtained from patient
CSF were ranked based on predicted strength of miRNA repression
on G3BP1, or G3BP1 seed strength, using TargetScan and miRmap
(40, 41). We created a composite list of ranked miRNAs with high-
est seed strength toward G3BP1 (Figure 3 and Table 3) and select-
ed the following miRNAs to carry out transfection studies in vitro:
4 miRNAs that were upregulated (Set 1: miR-6129, miR-4725-3p,
miR-4700-5p, miR-449a) and 3 that were downregulated (Set 2:
miR-605-3p, miR-4476, and miR-1322) in HD CSF EVs. There is
evidence that combinatorial miRNA overexpression can achieve
greater specificity and minimize off-target effects (42, 43). There-
fore, to test the effect of these miRNAs on G3BP1 protein expres-
sion, we overexpressed locked nucleic acid (LNA) miRNA mimics
in the 293T cells using a combinatorial approach. 293T cells were
transfected with either a negative control miRNA, Set 1 miRNAs,
or Set 2 miRNAs, and protein expression was evaluated by Western
analysis. Protein expression of G3BP1 was significantly reduced in
Set 1–treated cells (P = 0.0190, Supplemental Figure 2, A and B; see
complete unedited blots in the supplemental material), and trend-             Figure 3. Selection of G3BP1-targeting miRNAs for overexpression stud-
ed lower in cells treated with Set 2 but was not statistically signif-        ies in HEK293T cells. Workflow of miRNA ranking, and selection, based on
icant, potentially because these 3 mRNAs had a lower combined                 predicted strength of miRNA repression on G3BP1, or G3BP1 seed strength.

   4                                      J Clin Invest. 2021;131(12):e140723 https://doi.org/10.1172/JCI140723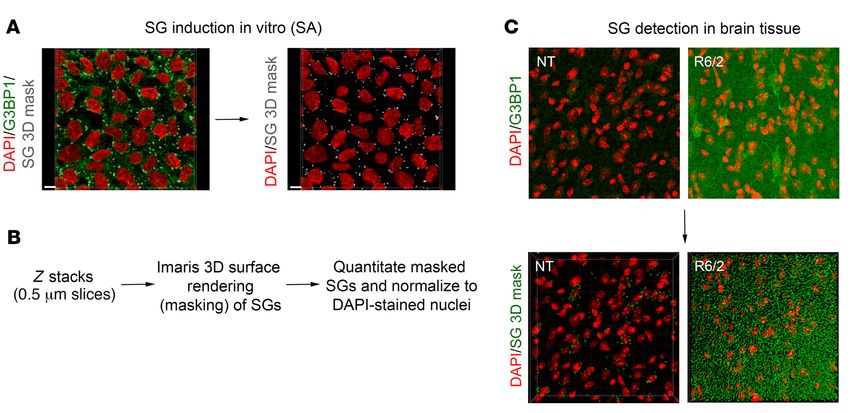
The Journal of Clinical Investigation                                                                                     RESEARCH ARTICLE

                                                                               ed in other neurodegenerative diseases using established SG
Table 3. Ranked list of selected miRNAs with context++ and                     markers (29, 48, 49), we investigated whether G3BP1-associated
miRmap scores                                                                  granules are present as a consequence of chronic mutant HTT
miRNA                      Context++ score            miRmap score             expression in vivo. We evaluated whether G3BP1 granule for-
                                                                               mation could be detected in brain tissue from 12-week-old R6/2
miR-6129                       –0.44                      99.35
miR-4725-3p                    –0.23                      98.88                mice, which express a transgene encoding human amino termi-
miR-4700-5p                    –0.11                      98.21                nal exon1 and have a rapidly progressing phenotype (50). First, to
miR-449a                       –0.03                      96.04                quantitate granules in 3D space, we employed a masking method
miR-605-3p                     -0.15                        –                  using the Imaris surface rendering tool as above using SA-induced
miR-4476                         0                         95.4                SGs in 293T cells (Figure 4A) and developed the parameters to
miR-1322 A                     –0.01                      49.05                detect G3BP1 granules in brain tissue (Figure 4, B and C), allow-
miRNA selected based on overlap with previously published HD CSF
A                                                                              ing for the quantitation of G3BP1 puncta and not diffuse G3BP1
miRNA sequencing results (37).                                                 background. Using this method on 12-week-old R6/2 mouse
                                                                               brain sections, localization and intensity of the G3BP1 protein
                                                                               and granule density were evaluated by immunofluorescence and
                                                                               confocal microscopy. A statistically significant increase in G3BP1
allowed for the detection of punctate structures over diffuse back-            immunoreactivity and granule density was detected in the cortex
ground signal. Specifically, the Imaris surface rendering tool was             (P = 0.021 and 0.001, respectively; Figure 6, A–C), and of gran-
used to create a mask of G3BP1 SGs in vitro (Figure 4A). Stressed              ule density in region CA1 of the hippocampus (P = 0.028; Figure
cells that were treated with the 4-miRNA cocktail in Set 1 had a               6, D–F). We did not detect any significant differences in G3BP1
significantly lower SG density (P = 0.0026) compared with cells                staining or density in the striatum at the 12- or 8-week time points
transfected with a negative control miRNA. Similarly, stressed                 (Supplemental Figures 4 and 5).
cells treated with the 3-miRNA cocktail in Set 2 also had a signifi-                Because HTT aggregation has been implicated in the fibril-
cantly lower SG density compared with the negative control treat-              lation of the SG marker TIA1 in R6/2 hippocampus (51, 52), we
ed cells (P = 0.0294) (Figure 5, A and B, and Supplemental Figure              assessed the potential colocalization of G3BP1-positive granules
3). These findings suggest that miRNAs identified in CSF EVs can               with HTT at 12 weeks. We first tested the EM48 antibody, which
modulate G3BP1 expression and associated G3BP1 granule biolo-                  recognizes HTT inclusions (53), but did not detect G3BP1 colo-
gy, and that SG formation in HD may be dysregulated.                           calization with EM48-positive nuclear inclusions (Supplemental
     Increased G3BP1 SG density and immunoreactivity in the R6/2               Figure 6A). However, we detected modest degrees of fluorophore
mouse cortex and hippocampus. Based on our finding that G3BP1                  colocalization between G3BP1 and HTT with 3B5H10 (which rec-
is a target of CSF EVs from patients with HD, the notion that HD               ognizes monomeric and small oligomeric polyQ species of mutant
induces a form of chronic stress, and that SGs have been detect-               HTT, ref. 54), 5490 (which recognizes wild type and mutant HTT,

Figure 4. Quantitation of G3BP1 SGs using the Imaris 3D masking method. (A) SGs were induced in vitro with SA treatment, and detected by immunoflu-
orescence with an antibody against G3BP1 (green). The Imaris surface rendering tool was used to detect G3BP1 SG puncta (gray). Scale bar: 10 μm. (B) Using
in vitro–induced SGs, parameters were set for the detection of G3BP1 granules in brain tissue. Z stacks were obtained at a thickness of 0.5 μm per slice,
and analyzed using the surface rendering tool for quantitation of G3BP1 puncta. The number of puncta was normalized to the number of nuclei (DAPI) per
frame. (C) The same pipeline was applied to detect G3BP1 granules in brain tissue, allowing for the quantitation of G3BP1 puncta and not diffuse G3BP1
background signal. Original magnification ×100.

                                         J Clin Invest. 2021;131(12):e140723 https://doi.org/10.1172/JCI140723                                       5
RESEARCH ARTICLE The Journal of Clinical Investigation
Figure 5. G3BP1-mediated stress granule induction is regulated
by miRNAs in 293T cells treated with sodium arsenite. (A) G3BP1
immunofluorescence (green) of unstressed cells and cells stressed
with sodium arsenite (SA). Cells were transfected with either a
negative control miRNA (Neg. control), a 3-miRNA cocktail (Set 1),
or a 4-miRNA cocktail (Set 2) (n = 3 per condition). Scale bar: 40 μm.
(B) Quantitation of SG density (normalized to DAPI-stained nuclei)
in both stressed and unstressed conditions suggests that treatment
with SA resulted in a significant SG density increase within each
condition (2-way ANOVA with Sidak’s multiple comparison test,
*P < 0.0001; **P = 0.0283; ***P = 0.0025). Furthermore, SG density
is significantly decreased in Set 1 and Set 2 treated cells compared
with cells treated with the negative control miRNA (2-way ANOVA
with Sidak’s multiple comparison test, #P = 0.0026; ##P = 0.0294).
Data are representative of at least 3 independent experiments and
analysis was done using 3 frames per condition, per replicate (n = 3
for each set). Error bars depict mean ± SEM.
ref. 55), and the polyQ antibody 1C2 (which preferentially binds exhibiting the highest overall cortical loss (62), suggesting that
expanded polyQs, refs. 56, 57) (Supplemental Figure 6, A–D). To these regions might be especially vulnerable to mutant HTT-
confirm that the observed increase in G3BP1 immunoreactivity in mediated cellular stress. We therefore investigated G3BP1 pathol-
R6/2 cortex and hippocampus is not due to a nonspecific increase ogy in the superior frontal and parietal cortices, as well as hippo-
in antibody binding due to the tissue preparation and fixation campus, based on pyramidal neurons being one of the principal
methods, we investigated the immunoreactivity of the RNA bind- cell types of this region and the fact that memory dysfunction is a
ing protein hnRNPA2/B1 (58) based on our observations that its clinical feature of HD (64).
immunoreactivity is decreased in the R6/2 hippocampus (Supple- First, we examined the superior frontal and parietal cortices,
mental Figure 7) and find that hnRNPA2/B1 immunoreactivity is and the hippocampus of 2 HD (pathological grade 2, which des-
not higher in the R6/2 brain. Lastly, because it has been suggest- ignates initial gross striatal atrophy, ref. 45) and 2 control post-
ed that G3BP2, a G3BP1 homolog expressed in mouse brain, also mortem brains (Table 4). We observed high G3BP1 immunore-
contributes to the formation of SGs (59, 60), we evaluated wheth- activity in the HD patient brains (Supplemental Figures 9–12),
er G3BP2 is involved in SG pathology in the R6/2 brain. Using particularly in the superior frontal cortex, where overall neuronal
the same analyses, we did not detect G3BP2-positive granular loss is also highest (62). We repeated the G3BP1 granule analysis
structures in R6/2 or nontransgenic brains (Supplemental Figure performed in the R6/2 mice in 6 HD (pathological grade 3) and 6
8), suggesting that G3BP1 and G3BP2 might not be functionally control superior frontal cortex postmortem samples (Table 4). We
redundant in in vivo SG formation. Overall, these results point found a statistically significant G3BP1 granule density increase in
toward stress-induced G3BP1-SG formation in R6/2 HD mouse the superior frontal cortex of HD brains compared with controls
cortex and hippocampus and a potential association with HTT. (P = 0.008), suggesting that this brain region is particularly reac-
Increased G3BP1-specific SG density in the superior frontal cortex tive to cellular stress in HD (Figure 7, A and B, and Supplemental
of patients with HD. We next investigated whether a G3BP1 phe- Figures 13–15). Because SGs are compositionally diverse and their
notype is detected in human HD patient brain tissue. While HD components depend on the type of stress the cell is exposed to
neurodegeneration is most overt in the striatum, neuronal loss has (45), we investigated the colocalization of G3BP1-positive gran-
also been detected in other areas, including pyramidal projection ules with other SG markers.
neurons of the cortex (61). Topologically selective cortical changes We first tested TIA1 antibodies. However, were not able to
are thought to explain some of the clinical heterogeneity among detect TIA1 staining in vivo as has been described for ALS tissue
patients (62, 63), with the superior frontal and parietal cortices (65, 66). We found that some G3BP1 granules colocalize with the
6 J Clin Invest. 2021;131(12):e140723 https://doi.org/10.1172/JCI140723The Journal of Clinical Investigation RESEARCH ARTICLE
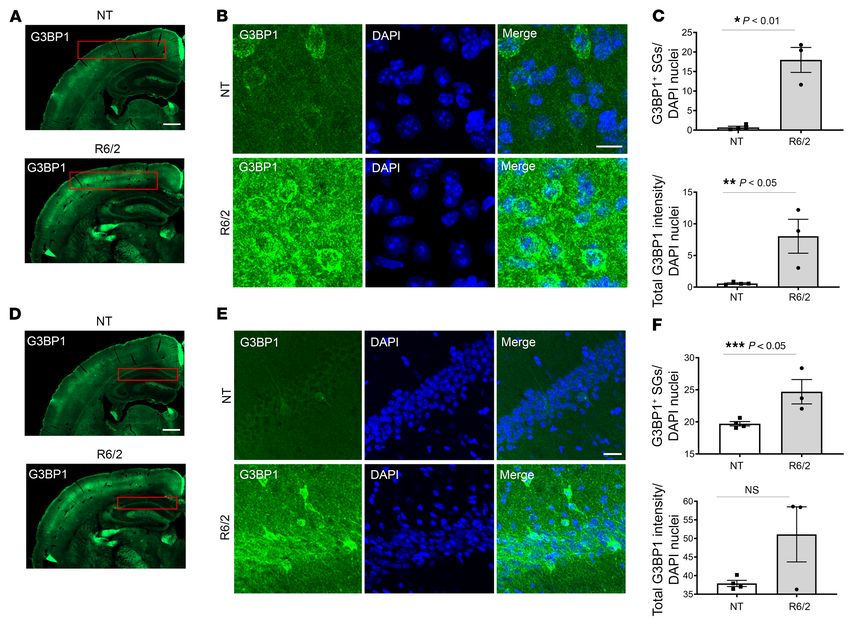
Figure 6. Increased G3BP1 granule density in the 12-week R6/2 cortex and hippocampus. (A and D) G3BP1 immunoreactivity (green) is higher in the R6/2
cortex and hippocampus CA1 region compared with the nontransgenic controls (boxed in red). Images shown are the same. (B and E) High magnification
images of cortical and hippocampal CA1 regions suggest that G3BP1 immunoreactivity varies between neural cell subtypes. (C) G3BP1 granule density and
G3BP1 immunoreactivity are significantly higher in the R6/2 cortex (Student’s t test, unpaired, 2-tailed, *P = 0.0014; **P = 0.0210), calculated using Imaris
image analysis software surface tool and CellProfiler, respectively, and normalized to the number of nuclei per frame (DAPI in blue). (F) The same analysis
was used to analyze the CA1 region of the hippocampus (boxed in red in D), which led to the detection of significantly higher granule density in the R6/2
(Student’s t test, unpaired, 2-tailed, ***P = 0.0285), but not G3BP1 immunoreactivity. Immunofluorescence was repeated at least 3 times and quantita-
tion was done for representative samples from each group using 4 frames per mouse brain (n = 3 R6/2; 4 NT). Error bars depict mean ± SEM. Scale bars:
500 μm (A); 10 μm (B, D); 200 μm (C).
translation initiation factor and SG marker eIF3eta (Figure 7C and (Figure 8A). Intriguingly, while TDP43 staining remained largely
Supplemental Figure 16), which colocalizes with poly(GR) dipep- nuclear in cells from control brain tissue, we observed mislocal-
tide repeat protein in the brains of c9FTD/ALS patients (49) and ized TDP43 in HD tissues that are immunoreactive for G3BP1,
supports the identification of the G3BP1 granules as SGs. This suggesting that TDP43 pathology characteristic of ALS/FTD also
colocalization is not present in all cases, which could indicate that occurs in HD, particularly under conditions of stress leading to
each of these markers represents a different SG subtype under formation of G3BP1 SGs in neurons. Colocalization of G3BP1 and
mutant HTT-mediated cellular stress, and that in vivo SGs may TDP43 was not detected.
assemble via more than just one canonical mechanism. TDP43 is a Processing bodies (P bodies) are membraneless organelles
predominantly nuclear SG-associated RBP that is mislocalized to that form through liquid–liquid phase separation. Unlike SGs,
the cytoplasm and recruited to cytoplasmic SGs upon stress induc- they are enriched with factors related to mRNA degradation and
tion (67), and its cytoplasmic mislocalization has been implicated decay (69). Previous work has shown that the assembly of SGs and
as a key pathogenic feature in neurodegenerative diseases such as P bodies is regulated independently by different pathways, and
amyotrophic lateral sclerosis (ALS) and frontotemporal demen- that they can physically interact under certain stresses (69, 70).
tia (FTD) (68). To determine whether the G3BP1 granule pheno- To our knowledge, the cellular localization of G3BP1 SGs relative
type shows colocalization with cytoplasmic TDP43, we costained to P bodies has not been investigated in the human HD brain. We
human superior frontal cortex samples with G3BP1 and TDP43 costained for G3BP1 and the P body–specific protein decapping
J Clin Invest. 2021;131(12):e140723 https://doi.org/10.1172/JCI140723 7RESEARCH ARTICLE The Journal of Clinical Investigation
ally, our results show aberrant G3BP1-specific pathology in HD
Table 4. Patient brain tissue samples mice and human brain tissue, and cytoplasmic mislocalization of
Case ID Diagnosis Age Sex PMI Brain area TDP43 in G3BP1-positive cells. Overall, our findings suggest that
SG dynamics might play a role in the pathophysiology of HD.
HC140-R HD-3 62 M 22 SFC
HC147-L HD-3 64 M 18 SFC
HC171-R HD-3 51 M 24 SFC Discussion
HC139-R HD-3 67 F 5 SFC SGs are assemblies of protein and RNAs that form in the cyto-
HC142-R HD-3 55 F 25 SFC plasm in response to stressors such as hypoxia, heat-shock, and
HC158-R HD-3 52 F 19 SFC sodium arsenite, which all inhibit translation initiation (73). Their
T-5608 HD-2 58 M 31 SFC, PFC, HIF elimination, in turn, depends on ATP-driven disaggregases, such
T-5693 HD-2 80 F 7 SFC, PFC, HIF as Hsp40 and Hsp70, and granulophagy through the ATP-depen-
H239-R Control 64 M 15.5 SFC dent VCP-autophagy pathway (74, 75). Pathologic SG accumula-
H245-R Control 63 M 20 SFC tion and persistence has been implicated in several neurodegen-
H231-R Control 65 M 8 SFC erative diseases (29, 68). However, although in vitro experiments
H215-R Control 67 F 23.5 SFC using fragments of the HTT protein suggest that expanded HTT
H238-R Control 63 F 16 SFC
interacts with SG-associated proteins and is redistributed to SGs
H230-R Control 57 F 32 SFC
under ER-stress conditions (71), it has not been demonstrated for
T-5382 Control 62 M 5.5 SFC, PFC, HIF
HD in human brain. In addition, bioinformatic studies determined
T-5404 Control 54 F 16.5 SFC, PFC, HIF
that the expression of 395 of 464 putative SG related components
PMI, postmortem interval; PC, parietal cortex; SFC, superior frontal cortex;
are altered in HD (76); of these 395 components, 195 are induced
HIF, hippocampal formation.
and 200 are repressed in HD patient brain. These findings support
the need for further investigations into potentially pathologic SG
dynamics in HD.
enzyme subunit 1a (DCP1a) in the human superior frontal cortex Perturbations of SG dynamics have been implicated in neuro-
(Figure 8B) and found that DCP1a and G3BP1 granules do not degenerative diseases such as ALS, FTD, and Alzheimer’s disease
colocalize with each other. However, they were observed in close (29), although the consequence of these changes is not yet clear.
proximity to each other within MAP2-positive neurons (Figure Our study provides evidence for the presence of a G3BP1 pheno-
8C), suggestive of potential interactions within the cytoplasm. type in the brains of the R6/2 mouse model and human HD, and
Mutant HTT and G3BP1 each interact with the SG-associ- the identification of miRNAs that may modulate G3BP1 granule
ated cell cycle associated protein 1 (CAPRIN1) in vitro under density via targeting expression of G3BP1. Our findings also show
thapsigargin-mediated ER stress (71). We costained for G3BP1 and that EV miRNAs altered in the CSF of patients with HD are predict-
CAPRIN1 in the human HD cortex, and found that while CAPRIN1 ed to target mRNAs that are differentially expressed in the HD pre-
granules were present in G3BP1-positive cells, CAPRIN1 did not frontal cortex, with SG genes being significantly overrepresented.
colocalize with G3BP1 in 3D space (Supplemental Figure 17). This The majority of our knowledge of SG biology is currently
discordance can be explained by the fact that the earlier study was based on in vitro experiments using a stress time course that is
done in vitro and used an exogenous ER stressor, which may not likely shorter than what an organism experiences in the context
adequately represent the mechanism involved in the formation of of a chronic neurodegenerative disease. Under acute stress con-
G3BP1 granules in the brains of patients with HD. ditions, SGs appear to provide a prosurvival benefit and are highly
Cells highly immunoreactive to G3BP1 display pyramidal neuron dynamic and show punctate structures (73, 77). Current hypothe-
features. Pyramidal cell loss is detected in various cortical regions ses regarding mechanism include the regulation of translation of a
in human HD, including the superior frontal cortex (62), the region specific subgroup of mRNAs or activation of prosurvival signaling
where we observed a significant increase in G3BP1 density. It has pathways (78). Efforts have been made to better understand SG
been proposed that pyramidal neurons residing in the deep layers biology in the context of chronic stress in vitro by using prolonged
of the cortex, which project directly to the striatum, are selec- nutrient starvation as a stressor, suggesting that chronic stress SGs
tively vulnerable to mutant HTT-mediated toxicity (72). While differ substantially from acute stress SGs by way of their contents,
G3BP1 appears to be widely expressed throughout the HD brain, decreased exchange with cytoplasmic mRNP pools, and promo-
a subgroup of cells demonstrates higher G3BP1 immunoreactivity. tion of cell death (79). Interestingly, SG depletion in the context of
These cells have pyramid-shaped cell bodies, are immunoreactive chronic starvation resulted in increased cell survival, corroborat-
for the pyramidal neuron marker Ca2+/calmodulin-dependent ing other findings in fly and mouse models of neurodegeneration
protein kinase 2 (CaMK2) and are primarily located in the cortical (80–82), and providing a rationale for further investigating thera-
ribbon of the cortex and areas CA1/CA2/CA3 of the hippocampus pies to target SG pathology in neurodegenerative disease.
(Figure 9). These findings suggest that pyramidal neurons might SG assembly is promoted by RNA binding proteins that oligo-
be especially vulnerable to cellular stress in HD. merize in response to cellular stress. One of these key proteins
Taken together, these findings show that CSF EV miRNAs is G3BP1 (28), which is dephosphorylated and oligomerizes as
from patients with HD are enriched for targeting the SG nuclea- a response to cellular stress, resulting in the nucleation of SGs
tor G3BP1, and that a subset of these miRNAs modulate G3BP1 (26). Recently, G3BP1 has been identified as a central node of
protein expression and G3BP1 granule density in vitro. Addition- the protein-RNA interaction network that triggers RNA-depen-
8 J Clin Invest. 2021;131(12):e140723 https://doi.org/10.1172/JCI140723The Journal of Clinical Investigation RESEARCH ARTICLE
Figure 7. Increased G3BP1 granule density in the superior frontal cortex of HD human brain. G3BP1 (in green) granules were immunostained, their density
calculated using Imaris image analysis software surface tool, and granules normalized to the number of nuclei per frame (DAPI in blue). (A and B) G3BP1
granule density is significantly higher in the superior frontal cortex of HD brains (grade 3) compared with controls (Student’s t test, unpaired, 2-tailed,
*P = 0.0085). Data are representative of 6 HD and 6 control human brain samples, and quantitation was done using 3 frames per sample (n = 6, n = 3). (C)
Costaining of SG markers G3BP1 and eIF3eta (red) in the superior frontal cortex demonstrates colocalization in an HD case compared with control. Data are
representative of 2 HD and 2 control samples (n = 2). Error bars depict mean ± SEM. Scale bars: 20 μm (A); 10 μm (C).
dent liquid–liquid phase separation during SG formation under from regulating translation, including interacting with lysosomes
eIF2α-mediated cellular stress (27). Previous reports demonstrate and mitochondria (84, 85), pathways which are implicated in HD
that mutant HTT-mediated ER stress results in PERK activation, pathogenesis (86, 87). Lastly, the miRNA cocktails used to target
leading to the phosphorylation of eIF2α and inhibition of general G3BP1 were designed based on whether the miRNAs were upreg-
protein synthesis (7), all of which are involved in SG formation in ulated or downregulated in HD CSF EVs. However, the strength of
vitro (45). This study found both total and phosphorylated eIF2α target repression could potentially be further optimized by group-
levels to be higher in the HD mouse cortex compared with stria- ing miRNAs in such a way that increases the combined G3BP1
tum, perhaps explaining why we detected a substantial increase seed-strength. Employing this type of in vitro system will narrow
of G3BP1 granule density in the cortex but not striatum. That is, if down miRNAs that are highly effective at modulating SG densities
the available eIF2α concentration is not large enough, the thresh- and can be used to inform future studies that focus on the impact
old for SG liquid–liquid phase separation might not be reached. A of SGs on disease progression.
limitation of this study is that we exclusively investigated G3BP1- The protein profile of SGs is stress- and cell type–specific (39,
mediated SG pathology, and the question remains whether the 88), suggesting that SG characterization experiments done in vitro
density of other SG subtypes is affected when G3BP1-positive may not adequately represent the state of SGs in the human brain.
granules are repressed with miRNAs. Similar to other studies (65, TDP43 has been associated with ALS/FTD, where it is mislocalized
66), we were unable to detect TIA1 staining in human tissue, but from the nucleus to the cytoplasm and forms cytoplasmic aggre-
we did observe eIF3eta costaining of G3BP1 granules as shown gates that, in some cases, colocalize with SG markers (67, 88, 89).
previously for in vivo SG formation (49, 83). Therefore, we pro- In the human HD cortex, TDP43 inclusions have been detected in
pose that the G3BP1 granules identified in vivo may represent SGs cytoplasmic inclusions and dystrophic neurites (90), but it remained
distinct from canonical SGs that form in vitro. For example, there a question whether these colocalized with SG markers. Our results
is increasing evidence that G3BP1 has multiple functions aside suggest that, while TDP43 is mislocalized to the cytoplasm in the
J Clin Invest. 2021;131(12):e140723 https://doi.org/10.1172/JCI140723 9RESEARCH ARTICLE The Journal of Clinical Investigation
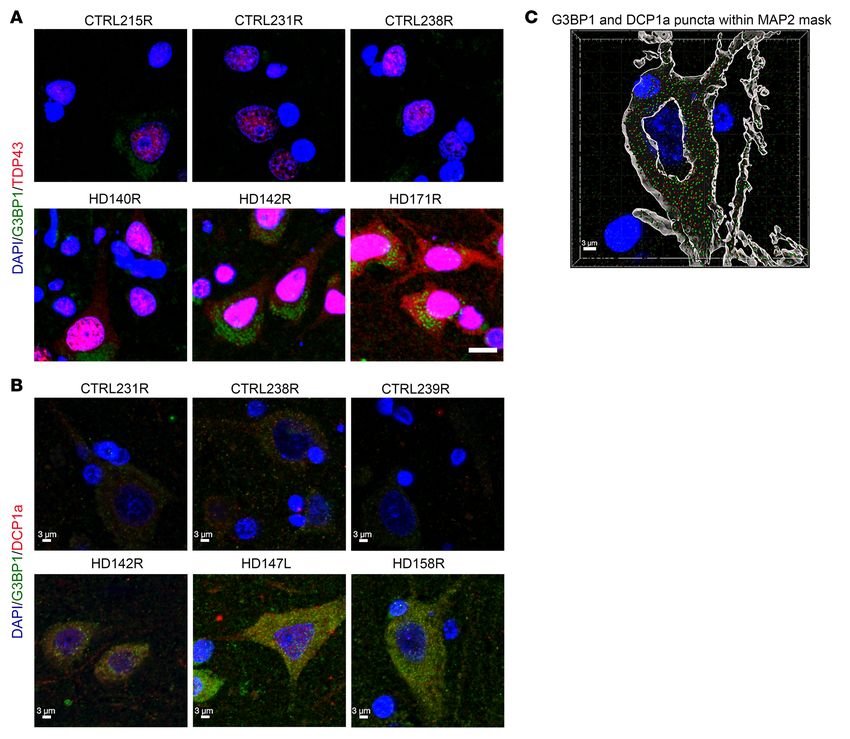
Figure 8. SG-associated protein TDP43 is mislocalized to the
cytoplasm in the superior frontal cortex of HD human brain,
and the P body marker DCP1a does not colocalize with G3BP1.
(A) The nuclear RBP TDP43 (red) was detected in the cytoplasm
of cells that are immunoreactive for G3BP1 (green), in the
superior frontal cortex of patients with HD. Comparatively, the
localization of TDP43 in cells from control patient brains was
largely nuclear. (B) DCP1a (red), a P body marker, was not found
to colocalize with G3BP1 (green) puncta. (C) Imaris SPOT analysis
of G3BP1 and DCP1a puncta was done using the Imaris software.
Neurons were identified by MAP2-positive staining (gray mask),
and the location of G3BP1 (in green) and DCP1a (in red) puncta
was determined within the neuronal cytoplasm. Data are rep-
resentative of 3 HD and 3 control human brain samples (n = 3).
Scale bars: 10 μm (A); 3 μm (B, C).
human HD cortex, it does not colocalize with G3BP1 SGs. The ponents, of which a majority are RNA binding proteins, have the
cytoplasmic mislocalization of TDP43 likely has important func- potential to cross-seed with protein aggregates via their low com-
tional implications with dysregulation of its critical nuclear roles, plexity domains (51, 95), exacerbating proteotoxicity. Converse-
including mRNA maturation, repression of cryptic exon expression, ly, some studies suggest that SGs might serve a more protective
splicing, and DNA double stranded break (DSB) response (89, 91). role in disease (48, 96). Testing of small molecule compounds
Indeed, missplicing and cryptic exon usage of Stathmin 2 through that modulate SG accumulation (44), miRNAs such as described
TDP-43 mislocalization has emerged as a potential biomarker for here, and other approaches to target SG formation will be infor-
expanded repeat C9orf72-associated ALS (92). An area of future mative in future studies to evaluate the consequence of altered
investigation will include staging of TDP-43 pathology in brain SG dynamics in HD.
areas impacted in HD, similar to that summarized for ALS, FTD, Our finding that pyramidal neurons demonstrate high G3BP1
and Alzheimer’s disease, which show TDP-43 deposits in different granule immunoreactivity, and previous findings of pyramidal
brain areas across the different disorders (summarized in ref. 93). neuron loss in the cortex of patients with HD (62), poses the ques-
It is important to note that we did not investigate modified forms tion of whether pyramidal neurons are especially vulnerable to
of TDP43, which may affect its localization and functional proper- mutant HTT-mediated cellular stress. If SGs are serving a protec-
ties (94). We also show that G3BP1 SGs did not colocalize with the tive role at any point during HD progression, this finding of high
P body marker DCP1a in the HD cortex, but these 2 structures were G3BP1 granule formation might also explain why neuron loss in
found to be adjacent to each other, consistent with previous reports the cortex is not as profound as that which is detected in the stri-
suggesting that although SGs and P bodies are separate entities, atum. Memory dysfunction is an important feature in the early
they participate in protein and RNA exchange (70). clinical presentation of HD (97). A meta-analysis of multiple stud-
One potential mechanism through which SGs might be det- ies identified episodic memory impairments in HD (63), a type
rimental in diseases where proteostasis is impaired is if SG com- of memory that relies heavily on the hippocampus and prefrontal
10 J Clin Invest. 2021;131(12):e140723 https://doi.org/10.1172/JCI140723The Journal of Clinical Investigation RESEARCH ARTICLE
Figure 9. Highly immunoreactive G3BP1-
positive cells have pyramid-shaped cell bod-
ies and express CaMK2. Costaining of G3BP1
(green) and the pyramidal neuron marker
CaMK2 (red), as well as cell morphology, sug-
gest that cells with high-density G3BP1-pos-
itive granules are likely to be pyramidal neu-
rons. This pattern of reactivity was observed
for HD and control cases. Nuclei were stained
with DAPI (blue). Data are representative of 2
HD and 2 control samples. Scale bar: 20 μm.
cortex (98). Interestingly, the hippocampus and cortex are areas of in the dysregulation of SG clearance by granulophagy — a type of
the brain with highest G3BP1 expression (99). In the hippocampus, selective autophagy (70).
high G3BP1 expression is detected in the cell bodies of the den- Last, because the EV miRNAs with strongest seed-strength
tate granule cell layer and CA pyramidal regions of hippocampal for G3BP1 are upregulated in the CSF of patients with HD, we
formation. Furthermore, G3bp1-KO mice demonstrate behavioral speculated that G3BP1 upregulation in the prefrontal cortex
defects linked to the CNS as well as altered Ca2+ homeostasis in would be even greater in the absence of these miRNAs. This is
hippocampal neurons, and behavioral studies suggest that G3BP1 corroborated by the fact that of the 75 miRNAs differentially
plays a role in synaptic transmission and plasticity in the hippo- expressed in the HD prefrontal cortex (101), 35 are predicted to
campus (99). It is tempting to speculate that SG pathology in pyra- target G3BP1, and 22 of those are upregulated in HD (P < 5.993
midal neurons of the cortex and hippocampus could be associated × 10 –10) (Supplemental Table 5). In contrast, there is no over-
with the memory impairments presented by patients with HD. lap between the prefrontal cortex and CSF EV differentially
Our SG time point study observations in 8- and 12-week-old expressed miRNAs, suggesting that both intrinsic and extrinsic
R6/2 mice suggest that G3BP1 immunoreactivity progressively miRNA-mediated repression of G3BP1 is at play. Future studies
increases, becoming statistically significant sometime between can investigate both the therapeutic potential of targeting SG
the 8- and 12-week time points. This has important implications pathology and to determine whether increased SG density in HD
for postmortem brain studies, as many of the available control affects the ability of cells to deal with additional environmentally
samples often originate from older individuals. Therefore, both induced stress, as this may elucidate mechanisms though which
postmortem interval and age matching are important parameters SG pathology contributes to neurodegeneration.
to consider when selecting postmortem cases to study SG pathol-
ogy in disease. Based on our findings and the potential for HTT Methods
aggregates to participate in cross-seeding with SG components, Methods for the following categories can be found in the supplemental
we speculate that the SG pathology in HD may result from an material: EV RNA isolation, library preparation, and next generation
accumulation of G3BP1 SGs that perhaps initially served a pro- sequencing; EV characterization by F-NTA; 293T cell transfection and
tective function, but develop into hyper-stable structures due to SG induction experiments; 293T-G3BP1-GFP microRNA mimic Incu-
chronic mutant HTT-mediated stress and compromised autoph- cyte S3 imaging; R6/2 mice and tissue processing; free-floating immu-
agy (74, 100). Specifically, HTT is essential for normal selective nofluorescence staining; paraffin-embedded immunofluorescence
autophagy in mice, and loss of WT HTT function may play a role staining; and microscopy.
J Clin Invest. 2021;131(12):e140723 https://doi.org/10.1172/JCI140723 11RESEARCH ARTICLE The Journal of Clinical Investigation
Study participants and CSF sample collection. CSF samples were SG analysis. SGs were quantified using the Imaris Surface tool
obtained from HDClarity (ClinicalTrials.gov identifier: NCT02855476). (Imaris Single Full software, BITPLANE). Using in vitro–induced SGs,
CSF was collected after an overnight fast by lumbar puncture and cleared parameters were set for the detection of SGs in brain tissue. Z stacks
by centrifugation before storage in polypropylene cryotubes at –80°C. were obtained at a thickness of 0.5 μm per slice, and analyzed using
Analysis of miRNA sequencing data. Reads containing ambiguous the surface rendering tool for quantitation of G3BP1 SG puncta. The
bases or with a mean quality score lower than 30 were removed from number of puncta was normalized to the number of nuclei (DAPI)
analysis using Prinseq (102), and UMIs were identified and extracted per frame. The same pipeline was applied to detect SGs in brain tis-
from the remaining reads using UMI-Tools (103). Reads were aligned sue, allowing for the quantitation of G3BP1 SG puncta and not diffuse
to all human mature miRNAs or pre-miRNAs from miRBase v22 (104) G3BP1 background signal. G3BP1 and hnRNPA2/B1 immunoreactiv-
using bowtie2 (105) with very sensitive parameters and a seed length of ity was quantified using an in-house script (CellProfiler Cell Image
8 bp with no mismatches allowed in the seed (106). Primary mappings Analysis software). Nuclei (DAPI stained) were counted using the
greater than or equal to 16 bp in length were retained for further anal- Imaris Spots tool and used for normalization of SG and G3BP1 immu-
ysis. Mapped reads were deduplicated with UMI-Tools (103) using the noreactivity quantitation. A previously described SG quantitation
unique grouping method, considering each unique UMI an individual approach (39) was also used for validation.
miRNA. Read counts for each miRNA were determined using samtools Statistics. All mouse and human tissue immunofluorescence and
(107). High-throughput sequencing data will be deposited in GEO. SG quantitation data were analyzed in GraphPad Prism software
Enrichment analysis. The PANTHER Classification System (108) using a Student’s 2-tailed t test, assuming equal variance. NTA data
was used to generate GO terms that are significantly overrepresented were analyzed in GraphPad Prism software using a 2-way ANOVA
in the miRNA targets list versus the background of all genes for all 3 with Bonferroni’s multiple comparison test or a Student’s 2-tailed t
GO aspects. For the enrichment analysis of SG genes in the miRNA test, assuming equal variance. The overlap of CSF EV miRNA targets
targets list versus the 464 SG genes (76), a Fisher’s exact test was used with mammalian SG genes was analyzed using a Fisher’s exact test,
to determine whether the number of overlapping genes was signifi- based on a genome larger than 21,000 genes. Differential expression
cantly higher than what was expected by chance based on a human for HD versus control miRNA sequencing samples was analyzed using
genome of more than 21,000 genes. the DESeq2 package (110) in R (111) with a significance cutoff of P
miRNA target prediction and data set overlap. An initial list of mi less than 0.05. Sample size calculation for miRNA sequencing exper-
RNAs was generated by pooling together miRNAs that were detected iments was done using an established statistical model to calculate
in the miRNA sequencing studies with P values less than 0.05 before sample size estimates for RNA sequencing data (33), where given any
correcting for multiple comparisons, and miRNAs with log2 fold 4 of Type I error, Type II error/power, sequencing depth, coefficient of
changes greater than or equal to 2 or less than or equal to –2, which variation, and samples per group, the fifth can be calculated. All 293T
were filtered based on interquartile range of the counts. IQR was cal- cell immunofluorescence, Western blot, and SG quantitation data
culated from the counts in the HD and control groups, and miRNAs were analyzed in GraphPad Prism software using a 1-way ANOVA with
were excluded if any count value was greater than quantile3 + 3*IQR Dunnett’s multiple comparison test, repeated measures 2-way ANO-
for either group. A list of predicted gene targets for the miRNAs that VA with Bonferroni’s multiple comparison test, or 2-way ANOVA with
passed the filtering process was generated using TargetScan (40). The Sidak’s multiple comparison test for SG density comparisons among
list of predicted gene targets for each miRNA was checked for overlap stressed and unstressed conditions. All data are mean ± SEM with a P
with a list of DEGs detected in the prefrontal cortex of patients with less than 0.05 considered statistically significant.
HD (34), and the number of overlapping targets that had an opposite Study approval. Mouse studies were carried out following the
fold change sign to the miRNA fold change were counted. Guide for the Care and Use of Laboratory Animals of the NIH and an
Seed strength ranking and LNA miRNA mimics. Seed strength values approved animal research protocol by the Institutional Animal Care
for all filtered miRNAs were acquired with TargetScan and miRmap, and Use Committee (IACUC) at the University of California, Irvine.
2 different open source software programs that combine multiple pre-
dictor features to predict the strength of miRNA repression on targeted Author contributions
mRNAs, in this case G3BP1 mRNA (40, 41). miRNAs were ranked from IIS designed research studies, conducted experiments, acquired
strongest to weakest seed strength values using each predictive model, a data, analyzed data, prepared figures, and wrote the manuscript.
composite list was made, and 7 miRNAs with the strongest seed strength TBN designed research studies, conducted experiments, and
values were selected for overexpression experiments. miRCURY LNA acquired data, and edited the manuscript. WEE and RGL ana-
miRNA Mimics (Qiagen) were used, as listed in Supplemental Table 6. lyzed data and edited the manuscript. AQV and GWY provided the
Postmortem human brain tissue. Brain tissue samples from human script for data analysis. RM analyzed data. CDF assisted with the
superior frontal cortex, parietal cortex, and hippocampal formation design of the research studies and interpretation of experiments.
were obtained from the New York Brain Bank at Columbia University SM generated 293T cells that express G3BP1 as a fusion protein
(109). Additional superior frontal cortex samples used for SG density with GFP. LMB processed and arranged shipment of CSF samples.
statistical analysis were obtained from the Neurological Foundation ALL harvested mouse tissue. IO harvested and processed mouse
of New Zealand Human Brain Bank. Paraffin-embedded samples tissue for free-floating immunohistochemistry. RLMF and MAC
from healthy controls (n = 8) and patients with Huntington’s disease collected, processed, pathologically analyzed, and arranged ethics
(pathological grade 2 and 3) (n = 8) were used for immunofluorescence approval and consent with the families for the human brain tis-
experiments (Supplemental Table 7). Patient demographic and clinical sue. JCR helped design the research studies and edited the man-
information is described in Table 4. uscript. EJW provided CSF samples and edited the manuscript.
12 J Clin Invest. 2021;131(12):e140723 https://doi.org/10.1172/JCI140723You can also read