ZNF768 links oncogenic RAS to cellular senescence - Nature
←
→
Page content transcription
If your browser does not render page correctly, please read the page content below
ARTICLE
                  https://doi.org/10.1038/s41467-021-24932-w                 OPEN

                  ZNF768 links oncogenic RAS to cellular
                  senescence
                  Romain Villot1,2, Audrey Poirier1,2, Inan Bakan1,2, Karine Boulay3,4, Erlinda Fernández 3,4, Romain Devillers1,2,
                  Luciano Gama-Braga2,5, Laura Tribouillard1,2, Andréanne Gagné 1,2, Éma Duchesne1,2, Danielle Caron2,3,
                  Jean-Sébastien Bérubé1,2, Jean-Christophe Bérubé1,2, Yan Coulombe2,6, Michèle Orain1,2, Yves Gélinas1,2,
                  Stéphane Gobeil5, Yohan Bossé 1,2, Jean-Yves Masson 2,6,7,8, Sabine Elowe2,5,6, Steve Bilodeau 2,6,7,8,
                  Venkata Manem1, Philippe Joubert1,2, Frédérick A. Mallette 3,4,9 & Mathieu Laplante 1,2 ✉
1234567890():,;

                  RAS proteins are GTPases that lie upstream of a signaling network impacting cell fate
                  determination. How cells integrate RAS activity to balance proliferation and cellular senes-
                  cence is still incompletely characterized. Here, we identify ZNF768 as a phosphoprotein
                  destabilized upon RAS activation. We report that ZNF768 depletion impairs proliferation and
                  induces senescence by modulating the expression of key cell cycle effectors and established
                  p53 targets. ZNF768 levels decrease in response to replicative-, stress- and oncogene-
                  induced senescence. Interestingly, ZNF768 overexpression contributes to bypass RAS-
                  induced senescence by repressing the p53 pathway. Furthermore, we show that ZNF768
                  interacts with and represses p53 phosphorylation and activity. Cancer genomics and
                  immunohistochemical analyses reveal that ZNF768 is often amplified and/or overexpressed
                  in tumors, suggesting that cells could use ZNF768 to bypass senescence, sustain proliferation
                  and promote malignant transformation. Thus, we identify ZNF768 as a protein linking
                  oncogenic signaling to the control of cell fate decision and proliferation.

                    ●    ZNF768 is phosphorylated and degraded upon RAS                              ●   ZNF768 binds and represses p53 and its overexpression
                         activation                                                                      suffices to bypass senescence
                    ●    ZNF768 depletion impairs proliferation and causes cellular                  ●   Elevated ZNF768 levels in human tumors may serve to
                         senescence                                                                      avoid cellular senescence and support proliferation

                  1 Centre  de Recherche de l’Institut Universitaire de Cardiologie et de Pneumologie de Québec (CRIUCPQ), Faculté de Médecine, Université Laval, Québec,
                  QC, Canada. 2 Centre de Recherche sur le Cancer de l’Université Laval, Université Laval, Québec, QC, Canada. 3 Chromatin Structure and Cellular Senescence
                  Research Unit, Maisonneuve-Rosemont Hospital Research Centre, Université de Montréal, Montréal, QC, Canada. 4 Département de Biochimie et Médecine
                  Moléculaire, Université de Montréal, Montréal, QC, Canada. 5 Centre de Recherche du Centre Hospitalier Universitaire de Québec, Université Laval, Québec,
                  QC, Canada. 6 Centre de Recherche du CHU de Québec—Université Laval, Axe Oncologie, Québec, QC, Canada. 7 Centre de Recherche en Données
                  Massives de l’Université Laval, Québec, QC, Canada. 8 Département de Biologie Moléculaire, Biochimie Médicale et Pathologie, Faculté de Médecine,
                  Université Laval, Québec, QC, Canada. 9 Département de Médecine, Université de Montréal, Montréal, QC, Canada. ✉email: mathieu.laplante@criucpq.
                  ulaval.ca

                  NATURE COMMUNICATIONS | (2021)12:4841 | https://doi.org/10.1038/s41467-021-24932-w | www.nature.com/naturecommunications                                1
ARTICLE                                                                 NATURE COMMUNICATIONS | https://doi.org/10.1038/s41467-021-24932-w

R
       AS proteins (HRAS, NRAS, and KRAS) are small GTPases                  N-terminal end resembling the heptapeptide repeats found in the
       that lie upstream of a broad signaling network controlling            C-terminal domain (CTD) of the large subunit (RPB1) of RNA
       proliferation. These proteins are often mutated and                   polymerase II (Pol II) (Supplementary Fig. 1D). Strikingly, large-
hyperactive in tumor cells1. Nearly 30% of human cancers harbor              scale protein sequence analyses using InterPro revealed that,
mutations in RAS genes. In response to mitogens, RAS activates               beyond RPB1, ZNF768 is the only human protein containing
the phosphoinositide-3-kinase (PI3K) and the mitogen-activated               such repeats (Supplementary Fig. 1E). In RPB1, these repeats are
protein (MAPK) pathways1. When active, these two signaling                   dynamically phosphorylated by various kinases, which play fun-
nodes promote cell growth by stimulating various processes                   damental roles in regulating RPB1 function20,21.
including protein, lipid and nucleotide biosynthesis2,3. The rise in            To define the relation between RAS activation and ZNF768, we
cell mass linked to the activation of these anabolic processes is a          first tested the impact of serum treatment on ZNF768 protein
critical feature allowing cell cycle entry and normal cell division.         levels in normal, RPE cells (Fig. 1A, B). Serum stimulation was
PI3K and MAPK activation also drive proliferation by promoting               associated with activation of both MAPK and PI3K signaling and
cell cycle progression and by repressing apoptosis through the               caused a significant decrease in ZNF768 levels (Fig. 1B). ZNF768
phosphorylation of numerous effectors4–6. Supporting the role of             was also destabilized in cells expressing a constitutively active
RAS signaling in promoting cell growth and proliferation, con-               form of RAS (RASG12V) (Fig. 1C). Supporting the connection
stitutive activation of this pathway was shown to promote the                between RAS activation and ZNF768, we found that inhibition of
development of various types of cancer in mice7.                             downstream effectors of RAS signaling such as MAP/ERK kinase
   Although RAS signaling is important to support proliferation,             1 (MEK1) or the mechanistic target of rapamycin (mTOR) with
unrestrained RAS activation in primary mammalian cells typi-                 PD098059 (Fig. 1D and Supplementary 1F) or Torin1 (Fig. 1E
cally triggers a cascade of molecular and cellular events leading to         and Supplementary Fig. 1G), respectively, led to a rise in ZNF768.
cellular senescence, a state of permanent cell cycle arrest in which         Importantly, these effects were not associated with changes in
cells remain metabolically active8. This process, termed                     ZNF768 mRNA expression (Supplementary Fig. 1H) but were
oncogene-induced senescence, has emerged as an important                     rather linked to increased ZNF768 protein stability (Fig. 1F, G).
cancer-protective response to oncogenic events, serving to elim-             We also observed that the effects of MEK and mTOR inhibitors
inate early neoplastic cells9–12. Hyperactive RAS promotes cel-              on ZNF768 were additive, indicating that both MAPK and PI3K
lular senescence through several complementary routes, which                 signaling control ZNF768 stability through parallel and com-
can differ depending on the cellular context. It is generally                plementary mechanisms (Fig. 1H).
accepted that oncogenic RAS triggers cellular senescence by                     The mTOR kinase nucleates two complexes known as
activating p53 and p16INK4-Rb pathways, by promoting the                     mTORC1 and mTORC2 (Fig. 1A). To better define which
degradation of pro-proliferation proteins and by activating the              mTOR complex affects ZNF768 stability downstream of RAS/
DNA damage response8,13–16. Bypass or evasion from cell                      PI3K, RAPTOR, or RICTOR were depleted in order to inhibit the
senescence has been proposed as a pivotal step in the pre-                   action of mTORC1 and mTORC2, respectively. These experi-
neoplastic phase leading to cancer17,18.                                     ments revealed that inhibition of mTORC2 (Fig. 1I), but not
   How exactly cells integrate RAS signaling to balance cellular             mTORC1 (Fig. 1J), promotes ZNF768 stability (Fig. 1K).
senescence and proliferation is not well understood. Furthermore,            Supporting these findings, inhibition of mTORC1 with rapamy-
the precise mechanisms by which cells support hyperactive RAS                cin had no effect on ZNF768 protein levels in all tested cell lines
signaling to bypass cellular senescence are incompletely char-               (Supplementary Fig. 1I). Protein kinase B/Akt (Akt) is directly
acterized. Here, we identify the transcription factor ZNF768 as a            phosphorylated on serine 473 by mTORC2 and serves as one of
protein phosphorylated and destabilized upon RAS activation.                 its major downstream effectors22. We found that both pharma-
We show that ZNF768 depletion impairs proliferation and                      cological and genetic inactivation of Akt were sufficient to
rapidly induces cellular senescence by modulating the expression             stabilize ZNF768 (Fig. 1L, M and Supplementary Fig. 1J).
of key cell cycle effectors and p53 target genes. We found that              Conversely, constitutive activation of Akt reduced ZNF768
ZNF768 levels are reduced in response to replicative-, stress- and           protein levels in various cell types (Fig. 1N and Supplementary
oncogene-induced senescence and that ectopic expression of                   Fig. 1K). In follow-up experiments, we found that proteasome
ZNF768 contributes to bypass of RAS-induced senescence, by                   inhibition with MG132 was sufficient to prevent Akt-mediated
hindering p53 activation. We then show that ZNF768 physically                degradation of ZNF768 (Fig. 1O). Collectively these experiments
interacts with p53 to repress its phosphorylation and its activity.          indicate that hyperactive growth factor signaling destabilizes
Cancer genomics and immunohistochemical analyses revealed                    ZNF768 by promoting its degradation by the proteasome.
that ZNF768 is frequently amplified and/or overexpressed in                      We next turned to the online tool PhosphoSitePlus to
various human malignancies, suggesting that ZNF768 could                     identify the residues in ZNF768 that were previously reported
contribute to the bypass of cellular senescence and to the pro-              to be phosphorylated in large-scale phosphoproteomics studies.
motion of oncogene-induced transformation. Thus, we identify                 As shown in Fig. 1P, 32 sites were identified in at least one mass
ZNF768 as a target of RAS linking growth factor signaling to the             spectrometry (MS) reference. Strikingly, we found that many of
control of cell proliferation.                                               these residues fell within, or near to the heptad repeats stretches
                                                                             in the N-terminal end of ZNF768 (Fig. 1Q). To confirm that
                                                                             ZNF768 is phosphorylated on these residues, we performed IPs
Results                                                                      using anti-PXS*P antibody and probed for ZNF768 by western
ZNF768 is a phosphoprotein destabilized upon RAS activation.                 blot. Using this approach, we showed that ZNF768 is
Analyses of phosphoproteomics studies indicate that ZNF768 is                phosphorylated on these motifs (Fig. 1R), and that oncogenic
part of a small group of uncharacterized transcriptional regulators          RASG12V increases ZNF768 phosphorylation (Fig. 1S, T).
potentially phosphorylated downstream of RAS (Supplementary                  Supporting the importance of phosphorylation for the regula-
Fig. 1A and Supplementary Data 1)19. ZNF768 is a 540-amino                   tion of ZNF768 stability, we found that serine to alanine
acid protein conserved in mammals (Supplementary Fig. 1B).                   mutations on residues S62, S69, S76, S83, and S139 increased
This protein contains C2H2 domains in its C-terminal section                 ZNF768 stability (Fig. 1U). Altogether, these results identify
and localizes to the nucleus (Supplementary Fig. 1B, C). A unique            ZNF768 as a phosphoprotein whose stability is reduced upon
feature of ZNF768 is the presence of amino acid stretches at the             RAS activation.

2                NATURE COMMUNICATIONS | (2021)12:4841 | https://doi.org/10.1038/s41467-021-24932-w | www.nature.com/naturecommunications
NATURE COMMUNICATIONS | https://doi.org/10.1038/s41467-021-24932-w ARTICLE
a b c d e
m
ru
U87
m
Hela
se
ru
h
Growth factors
8h
2h
Torin1 :
24
4h
no
1h
RASG12V
0h
se
RASG12V
h
8h
2h
PD098059 :
24
4h
1h
0h
ZNF768 70kDa tamox : - + - + 70kDa
70kDa
ZNF768
ZNF768
RAS PI3K P -Akt/PKB ZNF768 70kDa
55kDa P -Akt/PKB
P -ERK1/2 55kDa
RAF Pdk1 mTORC2 Akt/PKB 40kDa
55kDa
P -ERK1/2 40kDa
Akt/PKB
PD098059 MEK Akt Torin1 P -ERK1/2 40kDa ERK1/2 55kDa
ERK1/2 40kDa
40kDa
70kDa
ERK mTORC1 Nutrients ERK1/2 P -S6K
40kDa
Actin S6K 70kDa
Growth, survival, proliferation 40kDa
PD098059 - + - +
A P _1
2
f g h
2
IC _1
R_
i j
R_
_R OR
R
TO
Torin1 - - + +
TO
TO
T
sh P
FP
AP
125
IC
125
F
_G
_G
_R
_R
_R
ZNF768 70kDa
ZNF768 protein levels
ZNF768 protein levels
sh
sh
sh
sh
sh
100 100
(% of time 0)
ZNF768 ZNF768
(% of time 0)
70kDa 70kDa
75 P -Akt/PKB
75
* ** 55kDa
50 Akt/PKB RICTOR RAPTOR 130kDa
50 170kDa
Ctrl
* Ctrl *p=0.0007
55kDa
70kDa
25 25 Torin1 P -Akt/PKB P -S6K
PD098059 *p=0.0157 P -ERK1/2 40kDa 55kDa
70kDa
0 0 ACTIN S6K
8 0 2 4 6 8 ERK1/2
0 2 4 6 40kDa 40kDa
cycloheximide (h) cycloheximide (h)
k 125
l m 125
n o
Ctrl : + -
Myr-Akt : - - + +
ZNF768 protein levels
ZNF768 protein levels
100 ***p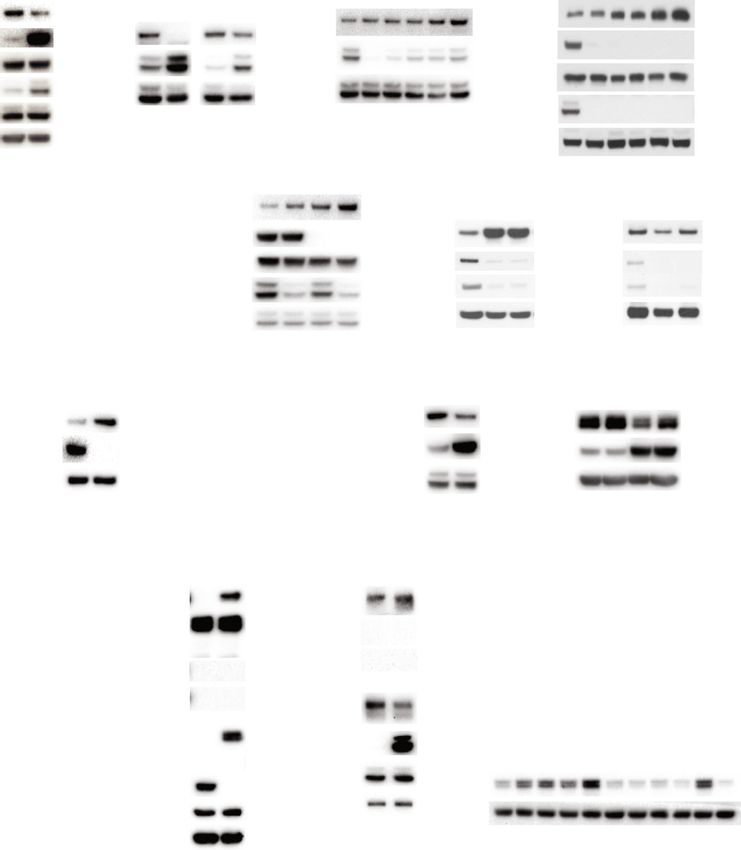
ARTICLE NATURE COMMUNICATIONS | https://doi.org/10.1038/s41467-021-24932-w
a U87 Hela MDA-MB231 293T Caco2 HT-29 HCT116 IMR90 RPE
1 2 1 2 1 2 1 2 1 2 1 2 1 2 1 2 1 2
8_ 68_ 8_ 68_ 8_ 68_ 8_ 68_ 8_ 68_ 8_ 68_ 8_ 68_ 8_ 68_ 8_ 68_
76 7 76 7 76 7 76 7 76 7 76 7 76 7 76 7 76 7
trl NF NF trl NF NF trl NF NF trl NF NF trl NF NF trl NF NF trl NF NF trl NF NF trl NF NF
h _C h_Z h_Z h _C h_Z h_Z h _C h_Z h_Z h _C h_Z h_Z h _C h_Z h_Z h _C h_Z h_Z h _C h_Z h_Z h _C h_Z h_Z h _C h_Z h_Z
S S S S S S S S S S S S S S S S S S S S S S S S S S S
ZNF768 70kDa
CASPASE 3 35kDa
Cleaved
15kDa
CASPASE 3
PARP
100kDa
Cleaved PARP
70kDa
b c 0 20 40 60 80 100 (min)
sh_ctrl
Hela 50 Sh_Ctrl
mitotic cells/total cells (%)
6 U87 20 Sh_ZNF768_1
Sh_Ctrl 40 Sh_ZNF768_2
5 Sh_Ctrl
(fold increase)
16 Sh_ZNF768_1
Cell number
Sh_ZNF768_1 160’ 40’
4 Sh_ZNF768_2 Sh_ZNF768_2 0 20 40 60 220 260 (min) 30
12
sh_ZNF768_1
3
***
***
*p=0.0002 8 ***p
NATURE COMMUNICATIONS | https://doi.org/10.1038/s41467-021-24932-w ARTICLE
depletion (Fig. 2C and Supplementary Fig. 2B). While performing AURKB, PLK1, and CDC20), genome replication (PCNA, CDC45,
the above experiments, we observed that some cells did not die and TOP2A) and genome stability (e.g., BRCA1, DDB2, EZH2,
following ZNF768 depletion. A portion of the cells surviving the MYBL2, and TOP2A) were severely repressed in ZNF768 depleted
acute loss of ZNF768 showed clear signs of cellular senescence, cells (Fig. 3E and Supplementary Data 4). Also, many bona fide
including enlarged flattened shape (Supplementary Fig. 2C to 2E), p53-target genes were significantly upregulated in these cells (e.g.,
increased senescence-associated β-galactosidase activity (SA-β- ICAM1, FAS, GADD45A, MDM2, SERPINE1, and CDKN1A/p21)
gal) (Fig. 2D and Supplementary Fig. 2F), and high expression of (Fig. 3E and Supplementary Data 5). Importantly, the effects of
genes that are part of the senescence-associated secretory phe- ZNF768 depletion on the expression of most of these genes were
notype (SASP) (Fig. 2E). Interestingly, we also observed that a reproduced in cells acutely and partially depleted from ZNF768
small fraction of cells surviving ZNF768 depletion could still using doxycycline-inducible cell lines (Supplementary Fig. 3B). In
proliferate and be amplified when cultures were maintained over these experiments, the reduction in the expression of genes reg-
a longer period of time. As shown in Fig. 2F, these cells displayed ulating the cell cycle preceded the transcriptional changes in p53
higher ZNF768 levels compared to the cells collected at early time targets, indicating that ZNF768 depletion sequentially affects gene
points following lentiviral infection, indicating that a minimal expression and that the transcription of cell cycle-related genes
level of ZNF768 is required to sustain proliferation in vitro. likely occurs independently of p53. Supporting this hypothesis,
In order to better define the phenotypes linked to ZNF768 we found that ZNF768 depletion repressed the expression of cell
depletion, we next generated doxycycline-inducible lentiviral cycle-related genes and impaired proliferation to the same extent
vectors to acutely control the timing and the intensity of ZNF768 in p53+/+ and p53−/− cells (Supplementary Fig. 3C–E). Inter-
knockdown. As shown in Supplementary Fig. 2G, this inducible estingly, we measured more SA-β-gal positive cells and higher
approach led to a less severe depletion of ZNF768. Partial CDKN1A/p21 expression in p53+/+ cells following ZNF768
ZNF768 depletion did not induce apoptosis in any of the cell lines knockdown (Supplementary Fig. 3F–H), arguing that the induc-
tested (Fig. 2G and Supplementary Fig. 2H). However, we found tion of cellular senescence in ZNF768 depleted cells strongly
that lowering ZNF768 levels was sufficient to reduce Cyclin B depends on p53. Altogether, these results indicate that ZNF768
expression, histone H3 phosphorylation and cell number controls proliferation through p53-dependent and independent
(Fig. 2G, H and Supplementary Fig. 2H, I). Cells partially processes.
depleted from ZNF768 were enlarged, displayed high levels of SA-
β-gal activity and showed a significant rise in the expression of
ZNF768 is degraded upon senescence entry. To define the
established SASP markers (Fig. 2I and Supplementary Fig. 2J, K).
relationship between ZNF768, cellular senescence and prolifera-
No signs of apoptosis were measured in these cells (Supplemen-
tion, we measured ZNF768 protein levels in response to repli-
tary Fig. 2L). Importantly, these phenotypes were maintained
cative and premature senescence (including oncogene- and stress-
several days after removing doxycycline, indicating that ZNF768
induced senescence). To first test the regulation of ZNF768 in
depleted cells remained arrested even after stopping ZNF768
response to replicative senescence, protein lysates were prepared
knockdown (Supplementary Figs. 2M–P). Altogether, these
from normal human diploid fibroblasts IMR90 cultivated after
results show that reducing ZNF768 levels is sufficient to trigger
either low or high population doublings. IMR90 are routinely
senescence in normal and cancer cell lines in vitro.
used to study replicative senescence25. As expected, we observed
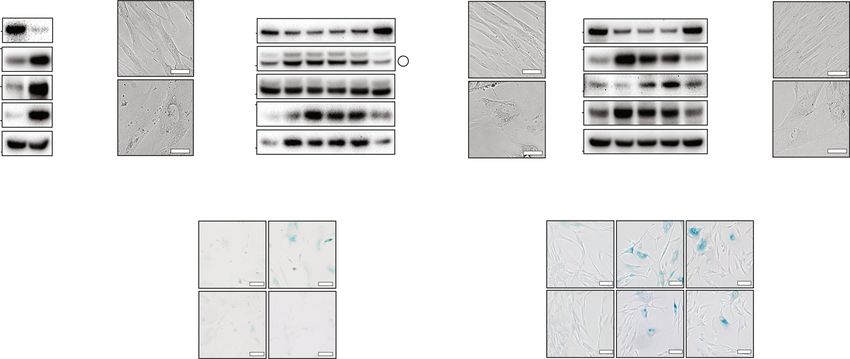
increased levels of senescence-associated markers in IMR90 cells
cultivated for numerous passages (Fig. 4A). A significant decrease
ZNF768 depletion affects the expression of key genes control-
in ZNF768 protein levels was observed during replicative senes-
ling proliferation and senescence. ZNF768 is a transcription
cence (Fig. 4A). To test whether ZNF768 was similarly repressed
factor that binds mammalian-wide interspersed repeats (MIRs) to
in response to premature senescence, we overexpressed oncogenic
control the expression of genes in a cell-specific manner23. To
RASG12V in IMR90 cells using a tamoxifen-inducible system and
understand how ZNF768 modulates proliferation and cellular
followed these cells over 9 days. Cells overexpressing RASG12V
senescence, we first looked at the gene expression profile upon
were morphologically elongated and flat, failed to reach con-
ZNF768 depletion in 6 different cell lines using iLincs, a publicly
fluence and expressed high levels of p21 and p16 (Fig. 4B).
available resource providing the expression profile of almost 1000
Interestingly, ZNF768 levels were rapidly reduced upon RAS
genes (L1000 assay) in response to various perturbagens24.
expression, further supporting a connection between ZNF768
Although ZNF768 depletion affected gene expression differen-
depletion and cellular senescence entry (Fig. 4B). We next tested
tially in every cell line, 191 genes were found to be similarly
the regulation of ZNF768 during stress-induced senescence trig-
regulated in at least 2 of them (Fig. 3A and Supplementary
gered by the DNA damaging agent doxorubicin. IMR90 and
Data 2). Comprehensive analysis of this gene signature with
HCT116 cells were treated overnight with a low dose of doxor-
Metascape revealed a significant enrichment for genes linked to
ubicin (0.1 µM) before being washed and followed over 3 days. In
the cell cycle and to the p53 signaling pathway (Fig. 3B and
these experiments, we also observed a decrease in ZNF768 levels
Supplementary Data 2). To extend the analysis of the gene sig-
that was associated with a rise in the expression of senescence
nature linked to ZNF768 depletion, a genome-wide tran-
markers (Fig. 4C and Supplementary Fig. 4A). As previously
scriptomics analysis was performed in U87 cells following
reported26, Akt was activated in cells treated with doxorubicin
ZNF768 knockdown. U87 cells were selected because this cell line
and such activation was tightly linked to the degradation of
was shown to be highly sensitive to ZNF768 depletion (Fig. 2B).
ZNF768 (Supplementary Fig. 4B). Supporting the results pre-
These experiments were performed rapidly following ZNF768
sented above, we found that inhibiting Akt or blocking the pro-
knockdown in order to characterize the primary effects linked to
teasome were both sufficient to prevent doxorubicin-mediated
its cellular depletion (Supplementary Fig. 3A and Supplementary
ZNF768 degradation (Supplementary Fig. 4C, D).
Data 3). Confirming the above findings, we found that the genes
affected upon ZNF768 knockdown were also functionally linked
to the cell cycle and p53 signaling (Fig. 3C, D and Supplementary ZNF768 overexpression contributes to bypass RAS-induced
Data 4 and 5). For instance, genes coding for proteins playing senescence. To determine the role of ZNF768 downregulation
roles in cell cycle regulation (ex. CDK1, MYBL2, CCNB1, during oncogene-induced senescence, rescue experiments were
CCNB2), chromosome segregation (e.g., NUSAP1, AURKA, performed by overexpressing ZNF768 in primary mouse
NATURE COMMUNICATIONS | (2021)12:4841 | https://doi.org/10.1038/s41467-021-24932-w | www.nature.com/naturecommunications 5ARTICLE NATURE COMMUNICATIONS | https://doi.org/10.1038/s41467-021-24932-w
a b -log10 (P)
0 2 4 6 8 10 12 14 16
Cell lines L1000 assay
Cell cycle
HepG2 113 125 Regulation of mitotic cell cycle
HCC155 60 69 Cell division
Transcriptional regulation by p53
ZNF768 MCF7 87 68 191 genes p53 downstream pathway
knockdown A375 53 61 common to Positive regulation of organelle organization
2 cell lines SUMO E3 ligase and SUMOylate target prot.
A549 91 61 Generation of precursor metabolites and energy
HT29 17 30 Regulation of small molecule metabolite process
Regulation of protein Ser/Thr kinase activity
Down Up p53 signaling pathway
CDC2-PCNA-CCNB1-GADD45 complex
c -log10 (P)
Downregulated genes d -log10 (P)
Upregulated genes
0 10 20 30 40 50 60 70 80 0 1 2 3 4 5 6
Cell cycle DNA damage response, signal transduction by p53
DNA conformation change Viral carcinogenesis
DNA replication Apoptosis
Mitotic cell cycle phase transition Thyroid hormone signalling pathway
DNA repair Lipid catabolic process
4 G2/M checkpoint Cognition
Microtubule organization in mitosis 4 TRKR pathway
Positive regulation of cell cycle Axoneme assembly
Aurora B pathway MAPK signaling pathway
Meiotic cell cycle T cell mediated immunity
Regulation of DNA metabolic process Cellular response to external stimulus
FOXM1 pathway Positive regulation of small molecule metab. process
e Bona fide
p53 targets
p=0.0023
Cell cycle Genome
p=0.0001
p=0.0137
regulation stability
**
2.0 10
p=0.0001
pNATURE COMMUNICATIONS | https://doi.org/10.1038/s41467-021-24932-w ARTICLE
a Replicative senescence
b Oncogene-induced premature senescence
c Stress-induced premature senescence
g
do g
xo
RASG12V
lin
Days post
lin
do
ub
trl
ub
overexpression doxorubicin
C
o
do
N
h
w
ig Days : 0 1 3 5 9 9
Lo
H 0 1 3 5 5
Low doubling
ZNF768
Ctrl
70kDa 70kDa ZNF768 70kDa ZNF768
Ctrl
25kDa 25kDa
p21 P -ERK1/2 p21
40kDa
55kDa
p53 ERK1/2 p16
High doubling
15kDa
Doxorubicin
40kDa
25kDa
RAS G12V
p16 p21 55kDa p53
15kDa
ACTIN p16 ACTIN
15kDa 40kDa
40kDa
d e RasG12V
p=0.003
100 Control RasG12V 100 ***pARTICLE NATURE COMMUNICATIONS | https://doi.org/10.1038/s41467-021-24932-w
a 15
ICAM1
***
***pNATURE COMMUNICATIONS | https://doi.org/10.1038/s41467-021-24932-w ARTICLE
by MS analyses were performed. These experiments identified 42 (Fig. 6C and Supplementary Fig. 6A). High ZNF768 expression
proteins that were co-immunoprecipitated with ZNF768 in at was detected in adrenocortical carcinoma (ACC), breast invasive
least 2 of 4 IP–MS runs (Fig. 5D). Using this approach, p53 was carcinoma (BRCA), cholangiocarcinoma (CHOL), diffuse large
identified as a potential ZNF768-binding partner. In follow-up B-cell lymphoma (DLBC), kidney chromophobe (KICH), kidney
experiments, we observed that V5-ZNF768 or endogenous renal papillary cell carcinoma (KIRP), lower grade glioma (LGG),
ZNF768 were efficiently immunoprecipitating p53 (Fig. 5E and liver hepatocellular carcinoma (LIHC) pancreatic adenocarci-
Supplementary Fig. 5J). Further confirming this interaction, we noma (PAAD), and thymoma (THYM) (Fig. 6C). Only two
also observed that IP of either endogenous p53 or V5-p53 could cancer types showed lower ZNF768 expression in tumors com-
immunoprecipitate ZNF768 (Fig. 5F and Supplementary Fig. 5K). pared to normal tissue, namely acute myeloid leukemia (LAML)
We noticed that deleting the transactivation domain 1 and 2 and testicular germ cell tumors (TGCT) (Supplementary Fig. 6A).
(TAD1 and TAD2) of p53, a central hub for various co-factors Altogether, these results indicate that ZNF768 is often amplified
and partners of p53, completely prevented the binding of p53 and/or overexpressed in various cancer types in humans.
with ZNF768 (Fig. 5G and Supplementary Fig. 5L). Moreover, Because ZNF768 is a protein strongly regulated at the post-
deletion of the C-terminal part of p53, that contains the translational level, we have initiated studies to measure ZNF768
oligomerization domain and a regulatory domain, two sections protein levels in human tumors. Here, we took advantage of
required for the tetramerization and the activation of p53, also samples collected from patients with lung adenocarcinoma
impaired the interaction with ZNF768 (Fig. 5G and Supplemen- (LUAD) or lung squamous cell carcinoma (LUSC), the most
tary Fig. 5L). These results indicate that the N-terminal part of common forms of non-small cell lung carcinomas. These cancer
p53 and its oligomerization are contributing to the interaction types were chosen for two reasons. First, LUAD and LUSC often
with ZNF768. Complementary experiments were next performed carry oncogenic mutations in RAS proteins33. Second, these
to define the domains of ZNF768 involved in the interaction with cancer types do not show severe changes in ZNF768 mRNA levels
p53. In these experiments, we found that deleting the C2H2 (Supplementary Fig. 6A). As shown in Fig. 6D, E, we found that
domains in ZNF768 completely prevented the interaction with many lung tumors showed elevated ZNF768 protein expression
p53 (Fig. 5H and Supplementary Fig. 5M). On the other hand, relative to the normal adjacent lung tissue. Immunohistochem-
deletion of the CTD domain containing the heptapeptide repeats istry (IHC) assays revealed a strong nuclear staining in cancer
did not prevent the binding of ZNF768 to endogenous p53 cells of both LUAD and LUSC (Fig. 6F). Strikingly, high ZNF768
(Fig. 5I and Supplementary Fig. 5M), indicating that this region protein levels were measured in many of the lung tumors carrying
of ZNF768 does not mediate the interaction with p53. Altogether, oncogenic RASG12V mutations (Supplementary Fig. 6B), indicat-
the results presented above suggest that ZNF768 might repress ing a disconnection between RAS activation and ZNF768
p53 function by interfering with its phosphorylation through degradation in advanced tumors. In order to define whether
physical interaction. In order to test this possibility, cells were ZNF768 protein levels are also elevated in other cancer types, we
next transduced to overexpress either wild type ZNF768 or looked at publicly available IHC data available through the
mutant isoforms that do not bind to p53 (ZNF768 ΔZF2) and the Human Protein Atlas resource (www.proteinatlas.org)34. Many
phosphorylation state of p53 and its activity were assessed, as cancer types, including colorectal, breast and prostate adenocar-
described above. We found that preventing ZNF768 binding to cinomas, also displayed strong nuclear staining for ZNF768
p53 was sufficient to restore p53 phosphorylation in cells treated (Supplementary Fig. 6C). These results indicate that high ZNF768
with doxorubicin (Fig. 5J). In these cells, the expression of p53 may be a common feature of various tumors in humans.
target genes was either partially or completely normalized Studies in cancer cells in vitro showed that alteration in
compared to control cells (Fig. 5K). Overall, these results indicate ZNF768 levels deeply impacts gene expression (Fig. 3). In order to
that ZNF768 physically interacts with p53 to repress its define whether ZNF768 also affects gene expression profiles in
phosphorylation and prevent its full activation. human cancer, we used TCGA data and performed pathway
analyses comparing lung tumors with either low or high ZNF768
mRNA expression based on the median for each histological
Elevated ZNF768 expression and protein levels in human subtypes. The GSEA analysis for the LUAD (n = 533) and LUSC
cancers. Owing to the importance of ZNF768 in supporting cell (n = 502) tumor samples resulted in 55 and 58 statistically
proliferation, we next sought to define whether ZNF768 gene is significant pathways respectively (false-discovery rate (FDR) <
altered or its expression modulated in human cancers. Analyses 1%) (Supplementary Tables 1 and 2). Of these, 10 and 9 pathways
of the TCGA PanCancer Atlas Studies through cBioPortal31 were upregulated in the high ZNF768 group compared to the low
revealed that ZNF768 gene is altered in 1.9% of tumors, with the ZNF768 group among the LUAD and LUSC patients respectively.
highest incidence being observed in endometrial carcinomas More importantly, we found an enrichment of the cell cycle
(5.1%), melanoma (4.7%), invasive breast cancer carcinoma pathway in tumors with high ZNF768 expression (Supplementary
(4.3%), mature B-cell neoplasm (4.2%), and bladder urothelial Tables 1 and 2). This effect was observed in both LUAD and
carcinoma (4.1%) (Fig. 6A). A deeper analysis next showed that LUSC samples. These results are consistent with our previous
gene amplification is by far the most frequent alteration found in data showing the importance of ZNF768 for the expression of
ZNF768 gene (Fig. 6B). We found that ZNF768 is amplified in several cell cycle genes. Although additional studies are needed to
50.5% of all the tumor samples with altered ZNF768. These define the precise contribution of ZNF768 to human cancer, these
analyses also revealed that ZNF768 loss is very uncommon in observations suggest that cells might use ZNF768 to sustain
cancer (Fig. 6A, B). Indeed, the complete deletion of ZNF768 was proliferation, bypass senescence and promote malignant
observed in only 0.05% of all the tumors included in the TCGA transformation.
PanCancer Atlas Study. These findings support our previous
results showing that severe ZNF768 depletion is not well tolerated
by cancer cells in vitro. We next performed gene expression Discussion
analyses using GEPIA, a web tool based on TCGA and GTEx Although RAS signaling is important to support proliferation and
data, to define whether ZNF768 transcript levels are affected in promote cancer development, oncogenic activation of RAS in
human cancer32. This analysis revealed that ZNF768 expression is primary cells triggers cellular senescence8. The precise mechan-
significantly elevated in 10 out of the 31 cancer types analyzed isms by which pre-neoplastic cells support hyperactive RAS to
NATURE COMMUNICATIONS | (2021)12:4841 | https://doi.org/10.1038/s41467-021-24932-w | www.nature.com/naturecommunications 9ARTICLE NATURE COMMUNICATIONS | https://doi.org/10.1038/s41467-021-24932-w
a 5 b ZNF768 alteration profile
Alteration frequency (%) 4
Mutations Amplification
3 Deep deletion Multiple alterations
2
1
0
go r u B- t c lan a
ol tr e ne in a
C ecta ade l ca pla a
vi ad oc cin a
ca o N den car noma
l s sta SC oc cin a
am ad lu cin ma
sq Ple us noc ca ma
Ad mo ral m ll c cin er
ge He eno s c eso cin a
sq to rti ca lio a
m ll l c in a
va s r c in a
n ll c cin a
a
er le D ob rco or
tia r c us sto a
d c li a
C cu yro cino a
la r m ca a
ca no r
at r c L cin a
ad ll c uk a
no a
ith rci ma
oc cin ia
a
io la ce
ha de re as Me nom
C as oth ll rc m
or ic lia o om
er l n r sm
l a no rc m
ar om
al pa co ell the om
ua ce ca rc m
O ou ula arc om
ria ce ar om
al m
en a iff la m
te ell e g m
O th ar om
ho la id m
r m
ic e e om
ar om
m
ua u ce ar nc
Sa tum
en ar em
ce a o
ca e a o
qu te L a o
o e ng o
el no
ng e n
ep a o
ci
i
Amplification
ci
Mutation (missense) Fusion
ar
r
lc
Deep deletion Mutation (truncation)
li
G
ria
et
op lad tu bre
Mutation (inframe deletion)
re ea
m
r u
do
Es B Ma ve
r
nc l cl
iff n-c
En
si
Pa na
va
l-d o
g
el l n
vi Pr
e
In
R
W ena
ck
ne
R
ha
er
d
C
an
op
c
Es
d
ea
H
ACC BRCA CHOL DLBC KICH KIRP LGG LIHC PAAD THYM
8 *
* * *
Transcript per million (TPM)
* * * * *
6 *
4
Normal tissue
Tumors
2 (128) (77) (291) (1085) (9) (36)
0
(337) (47) (53) (66) (60) (286) (207) (518) (160) (369) (171) (179) (339) (118)
d Lung adenocarcinoma
e Lung Lung squamous
or
or
or
or
or
or
or
or
adenocarcinoma cell carcinoma
ng
ng
ng
ng
ng
ng
ng
ng
m
m
m
m
m
m
m
m
Tu
Tu
Tu
Tu
Tu
Tu
Tu
Tu
Lu
Lu
Lu
Lu
Lu
Lu
Lu
Lu
pNATURE COMMUNICATIONS | https://doi.org/10.1038/s41467-021-24932-w ARTICLE bypass cellular senescence are still incompletely characterized. mitosis. Here, we analyzed gene expression upon ZNF768 Here, we report the identification of ZNF768 as a protein linking depletion in several cell lines and confirmed the cell-specific oncogenic RAS to cellular senescence. Our results show that impact of ZNF768 on gene expression. Importantly, ontology ZNF768 is destabilized upon RAS activation. We show that analyses of the genes affected by ZNF768 in more than one line ZNF768 depletion impairs proliferation and induces senescence also revealed a strong enrichment for genes linked to the cell cycle by modulating the expression of key cell cycle effectors and and mitosis. Many genes identified by Rohrmoser et al.23 to be established p53 targets. We show that ZNF768 levels decrease in repressed upon ZNF768 depletion were confirmed in our study response to replicative-, stress- and oncogene-induced senes- (Supplementary Table 3). These results indicate that, although cence, and that ZNF768 overexpression contributes to bypass ZNF768 controls the expression of genes in a cell-type specific RAS-induced senescence, in a p53-dependent manner. We pro- manner, this transcription factor also impacts the expression of a vide evidence that ZNF768 interacts with and represses the core group of genes that support proliferation. Since ZNF768 is phosphorylation and the activity of p53. Human cancer studies upstream of several other transcription factors, we cannot rule revealed that ZNF768 is often overexpressed in tumors, suggest- out that part of the effects of ZNF768 depletion on gene ing that cells might use this protein to bypass senescence, sustain expression might be indirect. Regardless of its direct or indirect proliferation and promote malignant transformation. impact on gene expression, we provide clear evidence that ZNF768 is the only zinc finger protein that carries amino acids ZNF768 is a key protein relaying growth factor signaling to the stretches resembling the heptapeptide repeats found in the CTD control of proliferation. of RPB1. Compared to RPB1, which contains 52 consensus motifs In addition to impact the expression of pro-proliferative genes, (Y1S2P3T4S5P6S7), ZNF768 carries between 9 and 19 degenerated we found that ZNF768 also affects the expression of many bona repeats, depending on the homology threshold considered. In fide p53 targets. In ZNF768-depleted cells, the rise in the RPB1, these repeats are phosphorylated to regulate transcriptional expression of p53 targets occurred after the reduction in the processes35. The dynamic phosphorylation of the CTD, often expression of cell cycle related genes, suggesting that ZNF768 defined as the “CTD code”, allows RPB1 to integrate inputs from may act through independent but complementary mechanisms to several sources to control transcription21. Here, we show that regulate cell proliferation. On one hand, ZNF768 controls a gene ZNF768 is phosphorylated on the heptapeptide repeats in network important for cell cycle progression, mitosis and cell response to RAS activation, an effect that primes its degradation division. On the other hand, ZNF768 physically interacts with by the proteasome. Mutations of several serine residues embed- p53 and its depletion amplifies p53 phosphorylation and activity. ded in these repeats increased ZNF768 levels. We also found that These p53-dependent and -independent modes of action likely inhibition of both PI3K and MAPK signaling pathways additively explain why ZNF768 depletion impairs proliferation in both p53 increased ZNF768 stability. Our findings suggest that the hepta- +/+ and p53−/− cells. Although ZNF768 loss decreased pro- peptide repeats in ZNF768 may serve as a signaling hub allowing liferation irrespectively of the p53 status, senescence features were cells to integrate RAS activity to control cell proliferation. Whe- significantly increased in p53+/+ cells, indicating a role for p53 in ther specific phosphorylation signatures, or “CTD code”, control promoting cellular senescence in ZNF768-depleted cells. Con- ZNF768 functions is an attractive possibility that warrants further sistently, we observed that ZNF768 overexpression contributed to investigation. bypass cellular senescence in primary cells, and that this effect The complete depletion of ZNF768 represses proliferation. We was dependent on p53. Altogether, our findings indicate that found that severe ZNF768 loss causes cell cycle defects and ZNF768 is a key player in determining the balance between cel- promotes senescence and apoptosis in many cell types. Additional lular senescence and proliferation. We propose that the degra- studies using a doxycycline-inducible approach revealed that the dation of ZNF768 upon oncogenic RAS activation could thus partial loss of ZNF768 also reduces proliferation. However, in represent a safeguard mechanism to promote cellular senescence, that case, this effect was linked to a rise in cellular senescence but repress proliferation and protect against malignant no increase in apoptosis. These findings indicate that ZNF768 is transformation. essential to sustain proliferation and that partial ZNF768 loss is High ZNF768 protein levels were found in nearly half of the sufficient to trigger cellular senescence. Supporting the link lung tumor samples tested. Because ZNF768 is rarely amplified or between ZNF768 and cellular senescence, we showed that overexpressed in lung tumors, these results indicate that post- ZNF768 is rapidly depleted during replicative-, stress- and transcriptional and/or post-translational processes likely take oncogene-induced senescence and that its overexpression con- place to enforce ZNF768 protein expression in cancer. Thus, tributes to bypass this process. The rapid degradation of proteins elevated ZNF768 levels might be more common in tumors than required for proliferation is a common process that takes place predicted from cancer genomics and transcriptomics analyses. during cellular senescence13. Our findings show that ZNF768 is Supporting this possibility, analysis of ZNF768 protein levels likely part of this senescence-associated protein degradation through the Human Protein Atlas revealed that many human program and suggest that ZNF768 could represent a novel cancers display intense staining for ZNF768. In line with these functional marker of cellular senescence. observations, previous reports showed that autoantibodies against ZNF768 is a transcription factor that binds to MIR ZNF768 are detected in the plasma of patients with colorectal sequences23, a group of retrotransposed DNA elements associated cancer38,39, a cancer type in which ZNF768 mRNA levels are not with transcriptionally active euchromatin36,37. In addition to increased. Our findings suggest that sustained ZNF768 expression MIR, ZNF768 also interacts with the promoter of various genes to might offer a proliferative advantage to cancer cells by promoting control their expression23. Overexpression of dominant negative the expression of key cell cycle regulator and by repressing p53 ZNF768 revealed that ZNF768 controls the expression of several activity and cellular senescence. Additional studies will be needed genes, at least in part in a cell type-specific manner23. In U2OS to define the role of ZNF768 in human cancer. cells, many genes regulated by ZNF768 were annotated as DNA In conclusion, we provide evidence that ZNF768 is a down- binding or zinc finger-containing genes, indicating that ZNF768 stream effector of RAS that serves as a central checkpoint to is hierarchically located upstream of a broad network of tran- couple growth factor signaling to the control of proliferation. We scription factor genes23. A closer look at the data presented in this propose a model in which oncogenic RAS promotes ZNF768 report also shows that repressing ZNF768 reduces the expression degradation, which represses the expression of key proliferative of various genes playing roles in cell cycle, cell division and genes, amplifies p53 activity and triggers cellular senescence NATURE COMMUNICATIONS | (2021)12:4841 | https://doi.org/10.1038/s41467-021-24932-w | www.nature.com/naturecommunications 11
ARTICLE                                                                          NATURE COMMUNICATIONS | https://doi.org/10.1038/s41467-021-24932-w

(Fig. 6G). This safeguard mechanism against neoplasia is bypas-                        Western blotting. All cells were rinsed twice with ice-cold phosphate-buffered
sed by cancer cells, that often overexpress ZNF768 (Fig. 6G).                          saline (PBS) before lysis. Cells were lysed with Triton-X 100 containing lysis buffer
                                                                                       (50 mM HEPES, pH 7.4, 2 mM EDTA, 10 mM sodium pyrophosphate, 10 mM
                                                                                       sodium glycerophosphate, 40 mM NaCl, 50 mM NaF, 2 mM sodium orthovana-
Methods                                                                                date, 1% Triton-X 100, and one tablet of EDTA-free protease inhibitors per 25 ml).
Cell culture and reagents. All the cell lines (RPE1, Hela, U87, HCT116,                Tissues were homogenized with the same buffer supplemented with 0.1% sodium
MDAMB231, HEK 293, Caco-2, HT29, IMR90) were obtained from American                    lauryl sulfate and 1% sodium deoxycholate. Cells and tissues were rotated at 4 °C
Type Culture Collection (ATCC) or Coriell Institute and cultured according to          for 10 min and then the soluble fractions of cell lysates were isolated by cen-
standard mammalian tissue culture protocols and sterile technique. The cell lines      trifugation for 10 min in a microcentrifuge. Protein levels were then quantified
were cultured in complete Dulbecco’s Modified Eagle Medium (DMEM) supple-               using Bradford reagent and analyzed by Western blotting. Protein extracts were
mented with Fetal Bovine Serum (FBS) (10%) (Sigma, #F1051) and penicillin-             diluted in sample buffer, denaturated by heat (95 °C) for 10 min and loaded on
Streptomycin (1%) (Wisent, #450-201-EL). The following reagents were used in           precast gels (Life Technologies). Proteins were transferred to PVDF membranes
cell culture experiments: Tamoxifen (Sigma, #T5648), PD098059 (Cayman Che-             blocked in 5% milk diluted in PBS-Tween and incubated with their primary
mical, #10006726), Torin1 (Cayman Chemical, #10997), Cycloheximide (Sigma,             antibody overnight at 4 °C. The following antibodies were used: ZNF768 [Aviva
#C7698), Puromycin (Sigma, #P8833), Blasticidin S-HCl (ThermoFischer Scien-            Systems Biology, FLJ23436, dilution 1 :1000]; Akt (pan) [C67E7, Cell Signaling
tific, #A1113903), Hygromycin B (BioShop Canada, #HYG002), Akt inhibitor VIII           Technology, #4691, dilution 1:1000]; Phospho-Akt (ser473) [D9E, Cell Signaling
(Cayman Chemical #14870), MG132 (Cayman Chemical, #10012628), Doxycycline              Technology, #9271, dilution 1:1000], Phospho-Akt (Thr308) [244F9, Cell Signaling
(Sigma, #D3447), Doxorubicin (Tocris, #2252), Nutlin3a (Cayman Chemical,               Technology, #9275, dilution 1:1000], p44/42 MAPK (Erk1/2) [137F5, Cell Signaling
#18585) and Rapamycin (LC Laboratories, #R5000).                                       Technology, #9102, dilution 1:1000], Phospho-p44/42 MAPK (Erk1/2)(Thr202/
                                                                                       Tyr204)[D13.14.4E, Cell Signaling Technology, #9101, dilution 1:1000], p70 S6
                                                                                       kinase [Cell Signaling Technology, #9202, dilution 1:1000], Phospho-p70 S6 Kinase
Virus production and infection. Retroviruses were produced using gag/pol and           (Thr389) [Cell Signaling Technology, #9205, dilution 1:1000], Raptor [24C12, Cell
CMV VSV-G as the packaging system. Lentiviruses were produced using psPAX2             Signaling Technology, #2280, dilution 1:1000], Rictor [53A2, Cell Signaling
and pMD2G. 293T cells were transfected with the vectors. Virus-containing              Technology, #2114, dilution 1:1000], V5-Tag [D3H8Q, Cell Signaling Technology,
supernatants were collected at 48 h after transfection and filtered using a 0.45μm      #13202, dilution 1:1000], Caspase-3 [Cell Signaling Technology, #9662, dilution
filter. Cells were transduced for 24 h in the presence of 8 μg/ml polybrene. After      1:1000], PARP [46D11, Cell Signaling Technology, #9532, dilution 1:1000], p21
infection, the cells were dispersed into fresh medium. Cells were selected on the      Waf1/Cip1 [12D1, Cell Signaling Technology, #2947, dilution 1:1000], p16 INK4A
following days with either 1 μg/mL puromycin or with 2.5 μg/mL of blasticidin,         [D7C1M, Cell Signaling Technology, #80772, dilution 1:1000], p53 [1C12, Cell
depending on the viral constructs.                                                     Signaling Technology, #2524, dilution 1:1000], Phospho-p53 (Ser15) [16G8, Cell
                                                                                       Signaling Technology, #9286, dilution 1:1000], Phospho-p53 (Ser33) [Cell Signal-
Vectors. Lentiviral shRNAs were obtained from the collection of The RNAi               ing Technology, #2526, dilution 1:1000], Acetyl-p53 (Lys382) [Cell Signaling
Consortium (TRC) at the Broad Institute. These shRNAs are named with the               Technology, #2525, dilution 1:1000], Cyclin D1 [92G2, Cell Signaling Technology,
numbers found at the TRC public website: shAKT1_1 (TRCN0000010174),                    #2978, dilution 1:1000], Phospho-histone H3 (Ser10) [D2C8, Cell Signaling
shAKT1_2 (TRCN0000010171), shAKT2_1 (TRCN0000255915), shAKT2_2                         Technology, #3377, dilution 1:1000], Phospho-histone H2A.X (Ser139) [20E3, Cell
(TRCN0000255917), shRAPTOR_1 (TRCN0000010415), shRAPTOR_2                              Signaling Technology, #9718, dilution 1:1000], S6 Ribosomal Protein [5G10, Cell
(TRCN0000039772), shRICTOR_1 (TRCN0000074290), shRICTOR_2                              Signaling Technology, #2217, dilution 1:2500] Cyclin B1 [D5C10, Cell Signaling
(TRCN0000074291), shZNF768_1 (TRCN0000017384), shZNF768_2                              Technology, #12231, dilution 1:1000], β-actin [Cell Signaling Technology, #4967,
(TRCN0000017385). For the inducible depletion of ZNF768, the hairpin sequence          dilution 1:1000], Phospho-ATM (ser1981) [Cell Signaling Technology, #5883,
of shZNF768_1 (TRCN0000017384) was cloned in Tet-pLKO-puro (gift from                  dilution 1:1000], Phospho-CHK1 (Ser345) [Cell Signaling Technology, #2348,
Dmitri Wiederschain, Addgene plasmid # 21915). Lentiviral constructs for over-         dilution 1:1000], Phospho-CHK2 (Thr68) [Cell Signaling Technology, #2197,
expression of V5-tagged proteins were obtained from the collection CCSB Broad          dilution 1:1000] FLAG [M2, Sigma Aldrich, F3165, dilution 1:1000], MCM6
Resource. The sequence of these vectors can be found at the TRC public website:        [Bethyl Laboratories, # A300-194A, 1:2000], phospho-Rb (T826) [EPR5351,
pLX304_V5-ACTA1 (ccsbBroad304_13807), pLX304_V5-PDS5A [transcript var-                 Abcam, # ab133446, dilution 1:1000], α-Tubulin [B-5-1-2, Sigma Aldrich, #T5168,
iant 3] (ccsbBroad304_02741), pLX304_V5-STAG2 (ccsbBroad304_02516),                    dilution 1:20000], p21 [C-19, Santa Cruz Biotechnologies, # SC397, dilution 1:500],
pLX304_V5-TP53 (ccsbBroad304_07088) and pLX304_V5-ZNF768                               p53 HRP-Conjugated [R&D Systems, HAF1355, dilution 1:5000]. Secondary
(ccsbBroad304_12602). The V5-ZNF768 S to A phosphomutants were generated               antibodies were purchased for Cell Signaling Technology [Cell Signaling Tech-
using the QuickChange Site-Directed Mutagenesis kit (Agilent, 200519).                 nology, #7074, #7075, dilution 1:5000]. ChemiDoc MP Imager and ChemiDoc and
pLX304_V5-ZNF768 was used as template for the mutagenesis protocol. ZNF768,            Image Lab software (version 5.1) were used to acquire and analyze images.
FLAG-ZNF768, V5-ZNF768ΔZF1, V5-ZNF768ΔZF2, V5-ZNF768ΔCTD were also
subcloned in MSCV (Addgene plasmid # 24828, a kind gift from Dr. Lin He) using
                                                                                       MS analyses. Proteins on beads were washed 3 times with 50 mM ammonium
pLX304_V5-ZNF768 as template. ZNF768 was subcloned into pRCF (kind provided
                                                                                       bicarbonate buffer and digested with trypsin (1 µg) overnight at 37 °C. Reaction
by Dr. Jacques Côté) using pLX304_V5-ZNF768 as template. pBabe-Puro-Myr-
                                                                                       was stopped by acidification with 3% acetonitrile–1% TFA–0.5% acetic acid. Beads
Flag-Akt1 (Myr-Akt) was a gift from William Hahn (Addgene plasmid #15294).
                                                                                       were removed and the peptides were purified on stage tip (C18) and vacuum dried
pLNCX2 ER:ras (ER1a-HRASG12V) was a gift from Masashi Narita (Addgene
                                                                                       before MS injection. Samples were solubilised into 10 µl of 0.1% formic acid and by
plasmid #67844). pRS sh_GFP and pRS sh_p53 were obtained from Dr. Reuven
                                                                                       MS. Peptide samples were analyzed by LC-MS/MS using an Ekspert NanoLC425
Agami40. pWZL Hygro-H-RasG12V was a gift from Dr. Scott Lowe (Addgene
                                                                                       (Eksigent) coupled to a 5600+ mass spectrometer (Sciex, Framingham, MA, USA)
plasmid #18749) and pWZL blast-H-RASG12V was provided by Dr. Masashi Narita.
                                                                                       equipped with a nanoelectrospray ion source. Peptides were trapped at 4 μl/min in
His-p53 and His-p53 Δ-TAD were subcloned in MSCV using pGEX-human p53-
                                                                                       loading solvent (0.1% formic acid) on a 5 mm×300 μm C18 PepMap cartridge pre-
(1-393) as a template (gift from Cheryl Arrowsmith, Addgene plasmids #24860).
                                                                                       column. Peptides were eluted with a linear gradient from 5 to 35% solvent B
His-p53 Δ-CTD was subcloned in MSCV using pGEX-human p53 (1-320) as a
                                                                                       (acetonitrile, 0.1% formic acid) in 35 min, at 300 nL/min. Mass spectra were
template (gift from Cheryl Arrowsmith, Addgene plasmids #24864).
                                                                                       acquired using a data dependent acquisition mode using Analyst software version
                                                                                       1.7. Each full scan mass spectrum (400 to 1250 m/z) was followed by collision-
Protein stability experiments. Cells were treated with cycloheximide (50 µM) and       induced dissociation of the twenty most intense ions. Dynamic exclusion was set
cells were lysed at the indicated times. ZNF768 stability was measured by com-         for a period of 12 sec and a mass tolerance of 100 ppm. MGF peak list files were
paring the protein levels 1, 2, 4, and 8 h to the untreated cells.                     created using Protein Pilot version 4.5 software (Sciex). MGF sample files were then
                                                                                       analyzed using Mascot (Matrix Science, London, UK; version 2.5.1). Mascot was set
                                                                                       up to search the Uniprot complete proteome HomoSapiens database (https://www.
Immunoprecipitations. Cells were rinsed twice with ice-cold PBS. Cells were next       uniprot.org/) and a contaminant database assuming the digestion enzyme trypsin.
lysed in a buffer containing 40 mM HEPES [pH 7.4], 2 mM ethylenediaminete-             Mascot was searched with a fragment ion mass tolerance of 0,1 Da and a parent ion
traacetic acid [EDTA], 10 mM sodium pyrophosphate, 10 mM sodium glycer-                tolerance of 0.1 Da. Scaffold (version Scaffold_4.8.4, Proteome Software Inc.,
ophosphate, 150 mM NaCl, 50 mM NaF, 1% Triton X-100, and one table of EDTA-            Portland, OR) was used to validate MS/MS based peptide and protein identifica-
free protease inhibitors/25 ml of buffer. The soluble fractions of cell lysates were   tion. Protein probabilities were assigned by the Protein Prophet algorithm41.
isolated by centrifugation at 16,000 g for 10 min in a microcentrifuge. For IPs,       Peptides and Proteins were validated if their FDR were less than 1%. Proteins that
primary antibodies were added to the lysates and incubated with rotation for 4 h at    contained similar peptides and could not be differentiated based on MS/MS ana-
4 °C. The following primary antibodies were used (V5-Tag [D3H8Q, Cell Signaling        lysis alone were grouped to satisfy the principles of parsimony.
Technology, #13202], p53 [Cell Signaling Technology, #2524], ZNF768 [Aviva
Systems Biology, FLJ23436], Phospho-MAPK/CDK substrates (PXS*P or S*PXR/K)
[Cell Signaling Technology, #2325]). A 50% slurry of protein G Sepharose was then      SA-β-gal activity assay. Senescence-associated β-galactosidase (SA-β-gal) assays
added, and the incubation continued overnight. Immunoprecipitated proteins were        were performed as previously described42,43. Cells were fixed with 0.5% glutar-
extensively washed before being either denatured and analyzed by western blot, or      aldehyde in PBS for 15 min, then washed and kept in PBS (pH 5.5 for MEF or pH
used for MS analyses, as described above.                                              6.0 for IMR90) containing 1 mM of MgCl2, for at least 24 h. Staining was

12                   NATURE COMMUNICATIONS | (2021)12:4841 | https://doi.org/10.1038/s41467-021-24932-w | www.nature.com/naturecommunications
NATURE COMMUNICATIONS | https://doi.org/10.1038/s41467-021-24932-w ARTICLE
performed at 37 °C using a solution containing X-Gal, potassium ferricyanide, system (Dako). Endogenous peroxydase was inhibited by treating sections with
potassium ferrocyanide and MgCl2 in PBS (pH 5.5 or pH 6.0). Images were taken FLEX 0.3% hydrogen peroxide for 5 min. Slides were next incubated for 20 min
and the percentage of SA-β-gal positive cells was quantified. with polyclonal rabbit ZNF768 primary antibody (Aviva Systems Biology) at
dilution 1:100. Flex HRP polymer was applied for another 20 min followed by
visualization in DAB, and counterstaining in hematoxylin. Slides were cleared,
BrdU incorporation. IMR90 cells were grown on coverslips and incubated for 6 h
covered and then scanned on Hamamatsu Nanozoomer 2.0 HT.
with 0.1 mg/mL 5-Bromo-2′-Deoxyuridine (BrdU, VWR, # B5002) prior to fixation
in 4% paraformaldehyde in PBS for 15 min. Cells were then incubated for 20 min in
permeabilization buffer (0.1% Triton X-100 in PBS), followed by 10 min incubation Tumor sequencing. DNA was extracted from the tumors using a commercial kit
in 1 N HCl, 10 min in 2 N HCl and 10 min incubation in phosphate/citric acid (QIAGEN, #69504). KRAS G12 mutation status was analyzed by ddPCR using a
buffer, pH 7.4. After three rounds of washes with permeabilization buffer, cells the KRAS Screening Multiplex kit (Biorad, #18603506).
were incubated overnight with Alexa 488-conjugated anti-BrdU antibody (Ther-
moFisher Scientific B35130, 1:200), followed by washes and staining with 4,6-
diamidino-2-phenylindole (DAPI). Images were captured using a Zeiss AxioOb- Pathway enrichment analysis. The pathway enrichment analysis was performed
server Z1 motorized inverted microscope. The percentage of BrdU incorporation by employing the gene set enrichment analysis (GSEA) method using the statistic
was determined by counting at least 300 cells per condition using Image J software. obtained from the t test (that assesses the difference in the gene expression between
the two groups). The enrichment score for each pathway was computed using the
GSEA method with statistical significance calculated using a permutation test
Microarray analyses. Whole-genome gene expression was performed using the (10,000 permutations). Nominal P-values obtained for each pathway was corrected
Affymetrix GeneChip Human Gene 2.0 ST Array. The RNA was labeled and for multiple testing using the FDR approach, and a threshold of P < 0.01 was
hybridized using a standard Affymetrix protocol. The quality of arrays was judged considered statistically significant.
using standard quality control parameters and all arrays passed the quality control
filters. Expression values were extracted using the Robust Multichip Average
method44 implemented in the oligo package in R45. Statistics and reproducibility. All the statistical analyses were performed using
Prism version 6.0.
Quantitative real-time PCR. Total mRNA was isolated from cells and tissues Figure 1: The results presented in Fig. 1B are representative of an experiment
using the RNeasy Lipid Tissue Mini Kit (Qiagen, 74104). Total mRNA was isolated that was performed twice and in different cell lines. The results presented in Fig. 1C
from cells using E.Z.N.A. Total RNA Kit I (Omega Biotek, R6834-02). RNA are representative of experiments that were performed at least two times. The
concentration was estimated from absorbance at 260 nm. cDNA synthesis was results presented in Fig. 1D were reproduced in a section of Fig. 1H and were also
performed using the iScript™ Advanced cDNA Synthesis Kit for RT-qPCR (Bio- reproduced in two other cell lines (see Supplementary Fig. 1F). The results
Rad). mRNA extraction and cDNA synthesis were performed following the presented in Fig. 1E were reproduced in a section of Fig. 1H. This experiment was
manufacturer’s instructions. cDNA was diluted in DNase-free water (1:15) before also reproduced in four other cell lines (see Supplementary Fig. 1G). The results
quantification by real-time PCR. mRNA transcript levels were measured in presented in Fig. 1F represent the average of three independent experiments
duplicate samples using CFX96 or CFX384 touch™ real-time PCR (Bio-Rad, Mis- (n = 3). The results presented in Fig. 1G represent the average of four independent
sissauga, ON, Canada). Chemical detection of the PCR products was achieved with experiments (n = 4). The results presented in Fig. 1H are representative of an
SYBR Green (Bio-Rad, 172-5271). At the end of each run, melt curve analyses were experiment that was performed twice. The results presented in Fig. 1I, J were
performed, and representative samples of each experimental group were run on confirmed in Fig. 1K. The results presented in Fig. 1K were produced from at least
agarose gel to ensure the specificity of amplification. Gene expression was corrected six independent biological replicates per conditions (n = 6). The results presented
for the expression level of reference gene. The primer sequences used are presented in Fig. 1L were confirmed in Fig. 1M and were reproduced in another cell line. The
in Supplementary Table S4. results presented in Fig. 1M represent the average of two independent experiments
(n = 2). The results presented in Fig. 1N were reproduced in a section of Fig. 1O.
This experiment was also reproduced in another cell line (see Supplementary
Live cell imaging. HeLa cells stably expressing GFP-tagged histone H2B Fig. 1K). The results presented in Fig.1R are representative of an experiment
(H2B–GFP cells) were plated onto 35-mm dishes and transduced with the that was performed at least twice with the same outcome. The result presented in
respective shRNA. Live-cell imaging was performed with the TE 2000 microscope Fig. 1S is representative of three independent experiments. The quantification is
(Nikon) using a Photometrics CoolSnap HQ camera. Cell culture dishes were presented in Fig. 1T. The experiment presented in Fig. 1U was reproduced twice.
placed onto the microscope with an environmental control chamber, maintaining Figure 2: The results presented in Fig. 2A were produced from independent
the temperature at 37 °C and the CO2 at 5%. The cells were imaged every 2 min for studies performed in nine different cell lines. The results presented in Fig. 2B
16 h with a Prior motorized stage for four dishes, and a stack of images with a Z- represent the average of three independent experiments (n = 3) performed in two
step size of 4.5 µm was collected. All images were collected with Plan Fluor 40×lens different cell lines. The results presented in Fig. 2C are representative of another
(numerical aperture = 0.6) with a Chroma filter set 41001 configured for EGFP experiment performed in similar conditions. The results presented in Fig. 2D, E
fluorescent protein tags [i.e., a set of filters for excitation atl (emission) = 488 nm come from the analysis of three independent replicates (n = 3). The results
and l (emission) = 500–550 nm]. Exposure times were 450 ms with a camera presented in Fig. 2F come from an experiment that was performed once. The
binning of 2. With a scanning stage, Z-stacks (three steps of 1.5 µm) of approxi- results presented in Fig. 2G were produced from independent studies performed in
mately 6–10 cells were imaged at five different XY positions on three dishes during four different cell lines. Some of these results were also reproduced in
each experiment. The data were analyzed with MetaMorph software (Molecular Supplementary Fig. 2H, N. The results presented in Fig. 2H represent the average
Devices, version 7.8.4.0). Complementary experiments were performed wild-type of two independent experiments for the U87 cells (n = 2) and three independent
Hela cells to analyze the mitotic defects linked to ZNF768 depletion. Following experiments for the Hela cells. These observations were also reproduced in another
ZNF768 knockdown, cells were stained with 100 nm SiR-DNA and directly used in cell line (see Supplementary Fig. 2I). The results presented in Fig. 2I come from the
live-imaging microscopy for 8 h were imaged by confocal microscopy on an analysis of six independent biological replicates per condition (n = 6). Similar
inverted Olympus IX80 microscope equipped with a WaveFX-Borealin-SC Yoka- results were also observed in other experiments (see Fig. 2E and Supplementary
gawa spinning disc (Quorum Technologies), a motorized stage (ASI) and an Fig. 2P).
incubator with atmospheric CO2 heated to 37 °C and an Orca Flash4.0 camera Figure 3: The results presented in Fig. 3C, D were produced from three
(Hamamatsu). Image acquisition was performed using Metamorph software independent biological replicates per condition (n = 3). The results presented in
(Molecular Devices). Mitotic events, metaphase defects (alignments defects or no Fig. 3E come from the analysis of three independent samples per condition (n = 3).
metaphase phenotype) and anaphase defects (lagging chromosomes and chromo- The results presented in this figure confirm findings presented in several panels,
some bridges) were counted. including Supplementary Fig. 3B.
Figure 4: The results presented in Fig. 4A are representative of an experiment
that was performed twice. The results presented in Fig. 4B are representative of an
Human lung samples. The patients included in this study were diagnosed with
experiment that was performed twice. The results presented in Fig. 4C are
either LUAD or LUSC and underwent surgical resection at the Institut universitaire
representative of an experiment that was reproduced in another cell line (see
de cardiologie et de pneumologie de Québec—Université Laval (IUCPQ-UL). Lung
Supplementary Fig. 4A). The results presented in Fig. 4D represent the average of
tumors and adjacent normal lung were collected and stored at the IUCPQ-UL site
four independent experiments (n = 4). The results presented in 4E represent the
of the Respiratory Health Network Tissue Bank (www.tissuebank.ca). The Research
average of three independent experiments (n = 3).
Ethics Committee of IUCPQ-UL approved this study (#2017-2829, 21441) and all
Figure 5: The results presented in Fig. 5A come from the analysis of at least
participants provided written and informed consent.
three independent biological samples per condition (n = 3). The results presented
in Fig. 5B are representative of an experiment that was reproduced twice and in
Immunohistochemistry. IHC was performed on formalin-fixed paraffin-embed- another cell line (see Supplementary Fig. 5I). The results presented in Fig. 5C are
ded tissue sections of 4 microns using charged slides. Slides were stained using a representative of an experiment that was reproduced in another cell line (see
fully automated procedure on Dako Autostainer Link 48 (Dako-Agilent Technol- Fig. 5J). The results presented in Fig. 5D come from the analysis of four
ogy, Santa Clara, CA) following heat induced epitope retrieval in a Dako P-T Link independent experiments (n = 4). The results presented in Fig. 5E–I are
with citrate buffer pH: 6. IHC was carried out using EnVision FLEX visualization representative of experiments that were reproduced at least twice. Some of these
NATURE COMMUNICATIONS | (2021)12:4841 | https://doi.org/10.1038/s41467-021-24932-w | www.nature.com/naturecommunications 13You can also read