"Hot cross bun" is a potential imaging marker for the severity of cerebellar ataxia in MSA-C
←
→
Page content transcription
If your browser does not render page correctly, please read the page content below

www.nature.com/npjparkd

                  ARTICLE                 OPEN

                  “Hot cross bun” is a potential imaging marker for the severity
                  of cerebellar ataxia in MSA-C
                  Shuzhen Zhu1,2,7, Bin Deng2,7, Zifeng Huang2,7, Zihan Chang2,7, Hualin Li2, Hui Liu2, Yanjun Huang2, Ying Pan3, Yanping Wang3,
                  Yin-Xia Chao4, Ling-Ling Chan4, Yih-Ru Wu5, Eng-King Tan 4 ✉ and Qing Wang 2,6 ✉

                     To evaluate the correlation between “hot cross bun” sign (HCBs) and disease severity in multiple system atrophy (MSA). We
                     recruited patients with probable and possible MSA with parkinsonism (MSA-P) or the cerebellar ataxia (MSA-C) subtypes. Clinical
                     and imaging characteristics were collected and comparison was performed between MSA-C and MSA-P cases. Spearman test was
                     used to evaluate the correlation between HCBs and other variables. Curve estimate and general linear regression was performed to
                     evaluate the relationship between HCBs and the Scale for Assessment and Rating of Ataxia (SARA). Unified Multiple System Atrophy
                     Rating Scale (UMSARS) IV was used to assess the severity of disease. Multinomial ordered logistic regression was used to confirm
                     the increased likelihood of disability for the disease. Eighty-one MSA with HCBs comprising of 50 MSA-C and 31 MSA-P were
                     recruited. We demonstrated that the severity of HCBs showed a positive linear correlation with SARA scores in MSA-C. Multinomial
                     ordered logistic regression test revealed that the increase in the HCBs grade may be associated with an increased likelihood of
                     disability for the disease severity in MSA, especially in those with cerebellar ataxia subtype. We demonstrated that HCBs is a
1234567890():,;

                     potential imaging marker for the severity of cerebellar ataxia. The increase in the HCBs grade may be associated with an increased
                     likelihood of disability in MSA-C, but not MSA-P cases, suggesting that it may be a useful imaging indicator for disease progression
                     in Chinese patients with MSA-C.
                     npj Parkinson’s Disease (2021)7:15 ; https://doi.org/10.1038/s41531-021-00159-w

                  INTRODUCTION                                                                          was heterogeneity in neuroimaging and clinical correlation
                  Multiple system atrophy (MSA), is an adult-onset progressive age-                     between two subtypes (MSA-P vs MSA-C).
                  related neurodegenerative disease, characterized by the presence
                  of a 14 kDa protein α-synuclein inclusion. The clinical character-
                  istics and neuro-pathogenesis of MSA are similar to those in
                                                                                                        RESULTS
                  Parkinson’s Disease (PD)1–3. There are two clinical forms including
                  the parkinsonism subtype (MSA-P) with predominant parkinson-                          Demographic characteristics and clinical phenotypes in HCBs-
                  ism, and cerebellar subtype (MSA-C) with predominant cerebellar                       positive MSA patients
                  ataxia in early stages. The pathology in MSA is mainly found in                       Eighty-one patients including 50 (62%) MSA-C and 31 (38%) MSA-
                  striato-nigral, olivopontocerebellar, and spinal cord structures and                  P were included (Table 1). Among MSA-C patients, 32 cases (64%)
                  its pathological hallmark is glial cytoplasmic inclusions4,5. Con-                    were probable MSA and 18 cases (36%) were possible MSA.
                  ventional magnetic resonance imaging is frequently used in the                        Among MSA-P patients, 16 cases (51.7%) were probable MSA and
                  diagnosis of MSA, and “hot cross bun” sign (HCBs) is widely                           15 cases (48.3%) were possible MSA. Gender distribution and
                  accepted to be a valuable sign for the diagnosis of MSA6–14. HCBs                     duration of diseases were not significantly different between
                  signal appears to be more pronounced as the disease progresses,                       patients with MSA-P and those with MSA-C (Table 1). Age at
                  suggesting that it may be a useful imaging indicator for disease                      symptom onset and enrollment showed a significant difference
                  progression. However, there is limited information on the exact                       between patients with MSA-P and those with MSA-C (Table 1). As
                  relationship between HCBs signal and clinical phenotypes in MSA.                      expected, parkinsonian manifestation was more prevalent in cases
                  Carré et al.15 in a recent study did not find a correlation between                    with MSA-P and cerebellar symptoms were more prevalent in
                  magnetic resonance imaging (MRI) features and the Scale for                           those with MSA-C, and autonomic failure was present in all cases
                  Assessment and Rating of Ataxia (SARA) in MSA patients. However,                      (Table 2). The ratio of dementia in our MSA cases is ~15% (Table
                  the study subjects were Caucasians and the predominant subtype                        2), which is similar to the report by O’Sullivan et al. 200814. The
                  is MSA-P in the study, and there were only 11 MSA-C patients.                         severity of cerebellar ataxia and disability differed significantly
                     To address the gap in current literatures, we investigated HCBs-                   between patients with MSA-P and MSA-C (Table 2). The score of
                  positive MSA patients among mainland ethnic Han Chinese and                           SARA and UMSARS-IV was higher in participants of MSA-C than
                  profiled the clinical phenotypes in HCBs-positive MSA patients,                        those in MSA-P (Table 2). The Fleiss’ kappa and Cohen’s Kappa for
                  assessed the relationship between HCBs and the severity of ataxia                     inter and intra-rater reliability is 0.750 and 0.815. The Inter and
                  and independent viability. In addition, we explored whether there                     intra-rater reliability for the grade of HCBs was showed in

                  1
                   Department of Neurology, Shunde Hospital of Southern Medical University, Foshan, Guangdong, P.R. China. 2Department of Neurology, Zhujiang Hospital of Southern Medical
                  University, Guangzhou, Guangdong, P.R. China. 3Department of Neurology, the Second Affiliated Hospital of Guangzhou Medical University, Guangdong, China. 4Department of
                  Neurology, National Neuroscience Institute, Singapore General Hospital, Duke-NUS Medical School, Singapore, Singapore. 5Department of Neurology, Chang Gung Memorial
                  Hospital, Linkuo Medical Center and Chang Gung University College of Medicine, Taoyuan, Taiwan. 6Guangdong-Hong Kong-Macao Greater Bay Area Center for Brain Science
                  and Brain-Inspired Intelligence, Guangdong, China. 7These authors contributed equally: Shuzhen Zhu, Bin Deng. ✉email: tan.eng.king@sgh.com.sg; denniswq@yahoo.com

                  Published in partnership with the Parkinson’s Foundation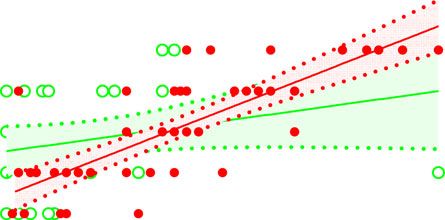
S. Zhu et al.
2
Table 1. Demographic characteristics of MSA patients. Table 2.Clinical and imaging characteristics were compared between
MSA-C and MSA-P patients with HCBs.
Overall MSA-C MSA-P p value
(n = 81) (n = 50) (n = 31) Overall MSA-C MSA-P p value
(n = 81) (n = 50) (n = 31)
Sex 0.293†
Autonomic failure
Woman 30 (38%) 22 (44%) 10 (32%)
Orthostatic 44 (54%) 30 (60%) 14 (45%) 0.193†
Men 51 (62%) 28 (56%) 21 (68%)
hypotension
Age
Urinary 8 (10%) 4 (8%) 4 (13%) 0.474‡
Enrollment 57.5 (7.1) 56.0 (6.6) 59.8 (7.4) 0.018‡a incontinence
Symptoms onset 55.7 (7.2) 53.5 (6.4) 58.5 (7.5) 0.005‡a Incomplete 49 (60%) 28 (56%) 21 (68%) 0.293†
§ bladder empty
Duration of disease 2.0 (1.0–3.0) 2.0 (1.0–2.3) 2.0 (1.0–4.0) 0.370
Constipation 53 (65%) 33 (66%) 20 (65%) 0.891†
Comparison was conducted between MSA-C and MSA-P groups. Data are n
(%), mean SD, or median (IQR), unless stated otherwise. Any 81 (100%) 50 (100%) 31(100%) ….
†
Based on χ2 test, ‡Based on t test, and §Based on Mann–Whitney test with Cerebellar dysfunction
significance level of 0.05 (two-tailed).
a Gait ataxia 68 (84%) 47 (94%) 21 (68%) 0.004‡a
Significant difference between MSA-C and MSA-P patients, P < 0.05.
MSA-C multiple system atrophy (cerebellar subtype), MSA-P multiple system Limb ataxia 68 (84%) 46 (92%) 22 (71%) 0.026‡a
atrophy (parkinsonism subtype). Cerebellar 28 (35%) 23 (46%) 5 (16%) 0.008‡a
dysarthria
Nystagmus 8 (10%) 8 (16%) 0 (0%) 0.021‡a
Supplementary Table 1. Neither HCBs grade nor atrophy of pons
and MCP differed between MSA-C and MSA-P (Table 2). Any 74 (91%) 50 (100%) 24 (77%) 0.001‡a
Parkinsonism
1234567890():,;
HCBs positively correlated with the severity of ataxia in MSA Bradykinesia 43 (53%) 14 (28%) 29 (94%) 0.001‡a
-C patients Rigidity 39 (48%) 12 (24%) 27 (8%) 0.001‡a
Spearman’s correlation coefficient for ranked data analysis was Postural instability 46 (57%) 25 (50%) 21 (68%) 0.117†
performed in the MSA, MSA-C, and MSA-P cases. The correlation Resting tremor 37 (46%) 10 (20%) 27 (87%) 0.001‡a
analysis between the HCBs grade and disease duration was non- Any 48 (59%) 17 (34%) 31(100%) 0.001‡a
significant in MSA patients (rho = 0.179, p = 0.093). However, the
Corticospinal dysfunction
HCBs grade was significantly correlated with cerebellar ataxia
Babinski sign 43 (53%) 25 (50%) 18 (58%) 0.480†
severity (SARA) (rho = 0.594, p < 0.001) global disability (UMSARS-
IV) (rho = 0.560, p < 0.001). It is worth noting that a stronger Atypical symptoms
correlation was found between the HCBs and SARA (rho = 0.784, Dementia 12 (15%) 8 (16%) 4 (12%) 0.760‡
p < 0.001) as well as UMSARS-IV (rho = 0.794, p < 0.001) in MSA-C Neurological scores
patients than in MSA patients. However, the HCBs was not SARA 11.0 (4.0–16.5)14.0 (5.8–21) 5.0 (2.0–13.0) 0.001§a
significantly associated with the SARA or UMSARS-IV in MSA-P UMSARS-IV 2.0 (2.0–4.0) 3.5 (2.0–4.0) 3.0 (2.0–5.0) 0.775§
patients. The detailed data are shown in Table 3.
The correlation analysis between the HCBs grade and atrophy of Imaging features
pons, middle cerebellar peduncles (MCP) were also assessed in our HCB vertical line 1.57 (1.44– 1.58 (1.45– 1.56 (1.35– 0.434§
study. The HCBs grade was significantly correlated with atrophy of 1.71) 1.71) 1.70)
pons (rho = −0.311, p = 0.0005) and MCP (rho = −0.411, p < HCB horizon line 1.49 (0–1.89) 1.73 (0–1.99) 0.95 (0–1.70) 0.169§
0.001) in MSA patients. The significant correlations between HCBs Atrophy of pons 1.66 (1.48– 1.67 (1.48– 1.66 (1.48– 0.694§
and MCP was also found in MSA-C and MSA-P patients (Table 3). A 1.89) 1.87) 1.89)
General Linear Model with univariate analysis showed that there Atrophy of MCP 1.05 (0.89– 1.04 (0.92– 1.08 (0.85– 0.953§
was a significant positive linear correlation between the HCBs 1.24) 1.23) 1.34)
grade and SARA scores (adjusted R2 = 0.573, P < 0.001) in MSA-C HCB grade 3 (2–4) 3 (2–4) 3 (2–4) 0.465§
cases after adjusted for atrophy of pons, atrophy of MCP and
Data are n (%), or median (IQR), unless stated otherwise.
disease duration (Table 4, Fig. 1 and Fig. 2). †
Based on χ2 test, significance level of 0.05 (two-tailed). ‡Based on Fisher’s
exact test (if any cell has fewer than ten observations) with level of
An increase in the HCBs grade is associated with an increased significance set to 0·05 (two-tailed). §Based on Mann–Whitney test with
likelihood of disability in MSA-C patients significance level of 0.05.
a
Significant difference between MSA-C and MSA-P patients, P < 0.05.
Recent studies suggested that many factors, such as age of UMSARS Unified Multiple System Atrophy Rating Scale, MSA-C multiple
onset16–18, gender17,18, disease duration17, and atrophy of pons17, system atrophy (cerebellar subtype), MSA-P multiple system atrophy
might involve in the progression of MSA; however, owing to the (parkinsonism subtype). MCP middle cerebellar peduncles. SARA Scale for
differences of population and main end-point indicators in Assessment and Rating of Ataxia.
studies, the conclusions of these studies were inconsistent. In
our study, age of onset, gender, disease duration, and atrophy of
pons were included for analysis.
To investigate these factors, multinomial ordered logistic for sex, age at symptom onset, atrophy of pons, atrophy of MCP
regression test was performed. Possible risk factors, such as age and disease duration (Table 5). With the increase of HCBs grade,
at symptom onset, sex, disease duration, HCBs, atrophy of pons, the risk of severe disability gradually increased (Table 5). The risk
atrophy of MCP were included into the analysis. We showed that of disability in MSA-C patients with HCBs grade 5 was 35.71, 83.33,
the increase in the HCBs grade may be associated with an and 500 times higher than that those with grade 4, 3, and 2
increased likelihood of disability in MSA-C patients after adjusting (Table 5). Age of onset, disease duration, and atrophy of pons
npj Parkinson’s Disease (2021) 15 Published in partnership with the Parkinson’s FoundationS. Zhu et al.
3
Table 3. Correlation analysis of HCBs grade with variables in MSA patients.
Variables Overall (n = 81) MSA-C (n = 50) MSA-P (n = 31)
r p† r p† r p†
Autonomic failure
Orthostatic hypotension −0.085 0.453 −0.061 0.675 −0.179 0.335
Urinary incontinence 0.119 0.288 0.139 0.337 0.089 0.636
Incomplete bladder empty 0.043 0.706 −0.026 0.859 0.195 0.294
Constipation 0.180 0.108 0.177 0.220 0.186 0.316
Cerebellar dysfunction
Gait ataxia 0.177 0.114 0.021 0.885 0.314 0.086
Limb ataxia 0.308 0.005 0.183 0.203 0.442 0.013
Cerebellar dysarthria 0.261 0.019 0.319 0.024 0.091 0.627
Nystagmus −0.135 0.230 −0.194 0.178 … …
Parkinsonism
Bradykinesia −0.041 0.719 0.084 0.563 −0.219 0.236
Rigidity −0.116 0.304 −0.043 0.766 −0.183 0.325
Postural instability −0.161 0.152 −0.163 0.258 −0.123 0.509
Resting tremor −0.059 0.604 0.110 0.447 −0.277 0.132
Corticospinal dysfunction
Babinski sign 0.174 0.120 0.196 0.173 0.166 0.373
Atypical symptoms
Dementia −0.081 0.471 −0.110 0.446 −0.022 0.906
Neurological Scores
SARA 0.594S. Zhu et al.
4
Table 4. Relationship between HCBs and severity of ataxia as assessed by score of sums and each item of SARA.
Variables Overall (n = 81) p† MSA-C (n = 50) p† MSA-P (n = 31) p†
r2 Adjusted r2 r2 Adjusted r2 r2 Adjusted r2
SARA 0.451 0.339S. Zhu et al.
5
HCBs&SARA-gait HCBs&SARA-stance HCBs&SARA-sitting HCBs&SARA-speech disturbance
15 MSA-P 12 9 12
MSA-C MSA-C MSA-C
SARA-speech disturbance
MSA-C
12 MSA-P MSA-P MSA-P
9 9
SARA-stance
6
SARA-sitting
SARA-gait
9
6 6
r2=0.619 pS. Zhu et al.
6
Grade 1 Grade 2 Grade 3 Grade 4 Grade 5
Fig. 3 Representative imaging of MSA patients with HCBs. a–e Pontine “cross sign” stages 1–5. a Stage 1 at an emerging vertical T2 high
signal line. b Stage 2 where the clear vertical line appeared. c Stage 3 where the horizontal line emerged. d Stage 4 where the horizontal line
appeared as well as the vertical line completed (“cross” line completed). e Stage 5 where clear cross bun sign accompanied with pontine base
atrophy.
a b c
d e f
Fig. 4 Representative three‐dimensional T1‐weighted axial images of pons and MCPs. a–f represented an axial view from the
pontomedullary junction to the level of the pontine midbrain junction. Slice thickness was 2 mm, and the maximum width of MCP was shown
on image d. The MCP value was determined by the averaged values on the widths of both MCP sides. MCP middle cerebellar peduncle.
Formal consent for publication were obtained from all participants. All IV, 1994)18,25, neurological scores (SARA score, Unified Multiple System
participants have provided written informed consent to take part in Atrophy Rating Scale (UMSARS-IV)). The severity of cerebellar ataxia was
the study. assessed using the SARA as described by Subramony26. Eight items are
included in this scale, including gait, stance, sitting, speech disturbance,
Clinical assessment finger chase, nose–finger test, fast alternating hand movements, and
heel–shin slide. The maximum score is 40, indicating the most serious
Clinical data including demographics (sex, age on enrollment and
symptom onset, disease duration), and presence of dysautonomia ataxia. Global disability was assessed with the fourth part of the Unified
[orthostatic hypotension (a reduction of systolic blood pressure by at Multiple System Atrophy Rating Scale IV (UMSARS-IV) in MSA patients as
least 30 mm Hg, or a reduction of diastolic blood pressure by at least described by Wenning GK27. UMSARS-IV is a disability scale, which was
15 mm Hg after 3 min of standing from a previous 3-minute interval in graded as follows according to the severity of disability: 1. life is
the recumbent position), urinary incontinence, incomplete bladder completely independent, and patients can finish all housework; 2. life is
empty (measurement of urine residual volume (RV) by ultrasound not completely independent, and some housework cannot be finished
revealing incomplete bladder emptying of 100 ml as described by independently; 3. life is somewhat dependent, and more than half of
Gilman et al. and Low et al.), constipation, cerebellar dysfunction (gait housework cannot be finished independently; 4. life is very dependent
ataxia, limb ataxia, cerebellar dysarthria, nystagmus), Parkinsonism on others, and only a small amount of housework can be finished
(Bradykinesia, rigidity, postural instability, resting tremor), corticospinal independently; 5. self-care is impossible, and the patient is bedridden.
dysfunction (Babinski sign), dementia (defined as impairment of at least Grade 1–3 was defined to mild disability, and Grade 4–5 defined as
two cognitive domains and leading to substantial and apparently severe disability.
permanent impairment of ability to perform tasks of daily living. (DSM-
npj Parkinson’s Disease (2021) 15 Published in partnership with the Parkinson’s FoundationS. Zhu et al.
7
assessed by the two Neurologists, the final size for analysis was decided by
a b consensus between the two Neurologists. Representative brain MRI of MSA
cases was shown in Figs 3–5.
Statistical methods
We compared clinical variables between MSA-C and MSC-P group with the
Mann–Whitney test or Student’s t test or χ2 tests when each cell had ten or
more observations. We used Fisher’s exact test to compare symptoms
between groups when cells had fewer than ten observations. We
evaluated the correlation of HCBs with other clinical and imaging variables
with spearman’s correlation analysis. Curve estimate and general linear
model with univariate analysis were used to analyze the relationships
between the HCBs grades and SARA scores; atrophy of pons, atrophy of
MCP and disease duration were analyzed as covariates. We used
multinomial ordered logistic regression to evaluate the independent risk
factors for disability of MSA patients. Statistical analysis was performed
Fig. 5 Schematic diagram of the measurement of the anteropos- with SPSS 23.0 for Windows (SPSS, Chicago, IL). The inter- and intra-rater
terior diameter of the pons. a T1-weighted image on conventional reliability was assessed using Fleiss’ kappa and Cohen’ s Kappa analysis as
midsagittal MRI. b Regions of interest were placed over the pons implemented in the R package “irr”30,31.
and the midbrain in the midsagittal slice. Two vertical lines were
drawn. Blue line defined the superior-inferior axes. Orange line
represented the anteroposterior diameter. DATA AVAILABILITY STATEMENT
The data that support the findings of this study are available from the corresponding
Image analysis author upon reasonable request.
Brain MRI examination was performed using a 3-T MR scanner (Achieva,
Siemens Healthineers, Germany) with a 16-channel head coil. Three‐
Received: 27 July 2020; Accepted: 8 January 2021;
dimensional T1‐weighted images were acquired with axial orientation
using a 3.0 T Discovery. Scan parameters were as follows: field of view
(FOV): 230 × 184 × 96 mm; voxel: 1.64 × 1.64 × mm; Matrix: 140 × 112 ×
48 slices; repetition time 3.7 ms, echo time of 1.69 ms, and slice thickness
of 2 mm. The sequence type and acquisition parameters for the T2- REFERENCES
weighted images were as follows: T2-weighted spin echo sequence: coil 1. Zhang, Y. et al. Multiple comorbid sleep disorders adversely affect quality of life
selection: SENSE-NV-16; FOV: AP 215 mm, RL 197 mm, FH 125 mm; Voxel in Parkinson’s disease patients. NPJ Parkinson’s Dis. 6, 25 (2020).
size AP 0.575 mm, RL 0.72 mm, Slice thickness 7 mm, Stacks fold-over 2. Fanning, S., Selkoe, D. & Dettmer, U. Parkinson’s disease: proteinopathy or lipi-
direction RL, TR 3000 ms, TE 80 ms. The grade of the HCBs was assessed dopathy? NPJ Parkinson’s disease 6, 3, https://doi.org/10.1038/s41531-019-0103-7
according to criteria reported by Horimoto et al.20. The HCBs was graded (2020).
as follows: no change appeared = 0; a vertical T2 high-signal line began 3. Xu, J. et al. Mitochondrial creatine kinase is decreased in the serum of idiopathic
to appear = 1; only a clear vertical line appeared = 2; a horizontal line Parkinson’s disease patients. Aging Dis. 10, 601–610 (2019).
began to appear following a vertical line appearance = 3; both a clear 4. Xie, T. et al. Comparison of clinical features in pathologically confirmed PSP and
horizontal and a vertical line appeared (cross line completed) = 4; and MSA patients followed at a tertiary center. NPJ Parkinson’s Dis. 1, 15007 (2015).
the ventral pons in front of the horizontal line showed T2 high signal or 5. Carli, G. et al. In-vivo signatures of neurodegeneration in isolated rapid eye
the ventral pons decreased in size with pontine base atrophy = 5. Grade movement sleep behaviour disorder. Eur. J. Neurol. 27, 1285–1295 (2020).
1–3 was defined to unclear HCBs and 4–5 was defined to clear 6. Seki, M. et al. Diagnostic potential of multimodal MRI markers in atypical Par-
completed HCBs. The HCBs was graded by three independent kinsonian disorders. J. Parkinson’s Dis. 9, 681–691 (2019).
neuroradiologists. For the intra-rater reliability study, before the 7. Mangesius, S. et al. Novel decision algorithm to discriminate parkinsonism with
evaluations, evaluators underwent the same 24-h training to standardize combined blood and imaging biomarkers. Parkinsonism Relat. Disord. 77, 57–63
the evaluation procedure. After the training, a total of 30 participants (2020).
were randomly selected. Every neuroradiologist evaluated HCBs twice 8. Massey, L. A. et al. Conventional magnetic resonance imaging in confirmed
and the intra-rater reliability was assessed. For the inter-reliability study, progressive supranuclear palsy and multiple system atrophy. Mov. Disord. 27,
all participants were included. The three evaluators did not have access 1754–1762 (2012).
to the values of each other’s measurements. If the rating results are 9. Ozaki, K. et al. Prevalence and clinicoradiological features of spinocerebellar
inconsistent, the final score can only be obtained after the agreement of ataxia type 34 in a Japanese ataxia cohort. Parkinsonism Relat. Disord. 65, 238–242
at least two neuroradiologists. The representative images of different (2019).
grade of HCBs were shown in Fig. 3a–e. 10. Goldman, J. S. et al. Multiple system atrophy and amyotrophic lateral sclerosis in
In addition, the length of the horizontal line and vertical line of HCBs, the a family with hexanucleotide repeat expansions in C9orf72. JAMA Neurol. 71,
atrophy of pons and the atrophy of MCP were also evaluated as showed in 771–774 (2014).
Figs 4 and 5. Methods for measuring MCP widths was referred to Sako 11. Hardiman, O. et al. Measuring network disruption in neurodegenerative diseases:
et al28. Measurements were performed using MRIcron (http://www. new approaches using signal analysis. J. Neurol. Neurosurg. Psychiatry 90,
mccauslandcenter.sc.edu/mricro/mricron/). The slice with maximal size 1011–1020 (2019).
was adopted. Widths of both sides were averaged for the MCP. The 12. Krismer, F. et al. Abnormalities on structural MRI associate with faster disease
method used for size measurements of the middle cerebellar peduncle progression in multiple system atrophy. Parkinsonism Relat. Disord. 58, 23–27
was shown in Fig. 4. The anteroposterior diameter of pons was measured (2019).
according to the method described by Massey, et al., 201329. Briefly, 13. Sugiyama, A. et al. Vertical pons hyperintensity and hot cross bun sign in
elliptical regions were placed over the pons and the midbrain in the cerebellar-type multiple system atrophy and spinocerebellar ataxia type 3. BMC
midsagittal slice. Two lines were drawn to define the major axes of the Neurol. 20, 157 (2020).
ellipses, corresponding to oblique superior-inferior axes (blue line, Fig. 5). 14. Kim, M. et al. Differential value of brain magnetic resonance imaging in multiple
The maximal measurement perpendicular to the major axis was taken, system atrophy cerebellar phenotype and spinocerebellar ataxias. Sci. Rep. 9,
representing the anteroposterior diameter of the pons (Orange line, Fig. 5). 17329 (2019).
The posterior border of the pons was clearly identifiable and did not 15. Carre, G. et al. Brain MRI of multiple system atrophy of cerebellar type: a pro-
include the pontine tegmentum. The methods used for size measurements spective study with implications for diagnosis criteria. J. Neurol. 267, 1269–1277
of the anteroposterior diameter of pons are shown in Fig. 5. Two (2020).
independent movement disorder specialists (Y Pan and YP Wang), who 16. Ben-Shlomo, Y., Wenning, G. K., Tison, F. & Quinn, N. P. Survival of patients with
were blinded to the clinical information, evaluated the size three times, pathologically proven multiple system atrophy: a meta-analysis. Neurology 48,
and the average value was taken. In cases of discrepancy between sizes 384–393 (1997).
Published in partnership with the Parkinson’s Foundation npj Parkinson’s Disease (2021) 15S. Zhu et al.
8
17. Watanabe, H. et al. Progression and prognosis in multiple system atrophy: an Guangdong Province (no.: 360209) to SZZ. We greatly thank Professor Zhibo Wen
analysis of 230 Japanese patients. Brain: J. Neurol. 125, 1070–1083 (2002). (Department of Radiology, Zhujiang Hospital) for his guidance on the imaging part.
18. O’Sullivan, S. S. et al. Clinical outcomes of progressive supranuclear palsy and
multiple system atrophy. Brain: J. Neurol. 131, 1362–1372 (2008).
19. Kollensperger, M. et al. Presentation, diagnosis, and management of multiple AUTHOR CONTRIBUTIONS
system atrophy in Europe: final analysis of the European multiple system atrophy Conceived and designed the study: Q.W. and S.Z.Z. Performed the study: S.Z.Z., B.D.,
registry. Mov. Disord. 25, 2604–2612 (2010). and Z.F.H. Revised the paper for intellectual content: E.K.T., Y.X.C., H.L., Y.J.H., Z.H.C., L.
20. Horimoto, Y. et al. Longitudinal MRI study of multiple system atrophy - when do L.C., and B.D. Data statistics and analysis: Y.P., Y.P.W., Y.R.W., S.Z.Z., L.L.C, Y.X.C., and B.
the findings appear, and what is the course? J. Neurol. 249, 847–854 (2002). D. Wrote the paper: S.Z.Z., D.B., E.K.T., and Q.W. All authors read and approved the
21. Stankovic, I. et al. Cognitive impairment in multiple system atrophy: a position final manuscript.
statement by the Neuropsychology Task Force of the MDS Multiple System
Atrophy (MODIMSA) study group. Mov. Disord. 29, 857–867 (2014).
22. Gilman, S. et al. Second consensus statement on the diagnosis of multiple system
COMPETING INTERESTS
atrophy. Neurology 71, 670–676 (2008).
23. Low, P. A. et al. Natural history of multiple system atrophy in the USA: a pro- The authors declare no competing interests.
spective cohort study. Lancet Neurol. 14, 710–719 (2015).
24. Stanzani-Maserati, M. et al. Cognitive and sleep features of multiple system
atrophy: review and prospective study. Eur. Neurol. 72, 349–359 (2014). ADDITIONAL INFORMATION
25. American Psychiatric Association. Diagnostic and Statistical Manual of Mental Supplementary information The online version contains supplementary material
Disorders, 4th edn. Washington, DC: American Psychiatric Association. (1994). available at https://doi.org/10.1038/s41531-021-00159-w.
26. Subramony, S. H. SARA-a new clinical scale for the assessment and rating of
ataxia. Nat. Clin. Pract. Neurol. 3, 136–137 (2007). Correspondence and requests for materials should be addressed to E.-K.T. or Q.W.
27. Wenning, G. K. et al. Development and validation of the Unified Multiple System
Atrophy Rating Scale (UMSARS). Mov. Disord. 19, 1391–1402 (2004). Reprints and permission information is available at http://www.nature.com/
28. Sako, W. et al. “One line”: a method for differential diagnosis of parkinsonian reprints
syndromes. Acta Neurol. Scand. 140, 229–235 (2019).
29. Massey, L. A. et al. The midbrain to pons ratio: a simple and specific MRI sign of Publisher’s note Springer Nature remains neutral with regard to jurisdictional claims
progressive supranuclear palsy. Neurology 80, 1856–1861 (2013). in published maps and institutional affiliations.
30. Fleiss, J. L. Measuring nominal scale agreement among many raters. Psychol. Bull.
76, 378–382 (1971).
31. Cohen, J. A coefficient of agreement for nominal scales. Educ. Psychol. Meas. 20,
37–46 (1960). Open Access This article is licensed under a Creative Commons
Attribution 4.0 International License, which permits use, sharing,
adaptation, distribution and reproduction in any medium or format, as long as you give
ACKNOWLEDGEMENTS appropriate credit to the original author(s) and the source, provide a link to the Creative
This work was supported by the National Key R&D Program of China (Grant no.: Commons license, and indicate if changes were made. The images or other third party
material in this article are included in the article’s Creative Commons license, unless
2017YFC1310200), National Natural Science Foundation of China (no.: 81873777,
indicated otherwise in a credit line to the material. If material is not included in the
82071414), Guangdong Provincial Key Laboratory of Shock and Microcirculation,
article’s Creative Commons license and your intended use is not permitted by statutory
Initiated Foundation of Zhujiang Hospital (no.: 02020318005), Science and
regulation or exceeds the permitted use, you will need to obtain permission directly
Technology Program of Guangdong of China (no.: 2020A0505100037) and Leading from the copyright holder. To view a copy of this license, visit http://creativecommons.
Talent in Talents Project Guangdong High-level Personnel of Special Support org/licenses/by/4.0/.
Program to Q.W.; and Natural Science Foundations of Guangdong of China (no.:
2017A030313672, 2019A1515010281), China Postdoctoral Science Foundation (no.:
2019M652971), Postdoctoral support project of Shunde District, Foshan City, © The Author(s) 2021
npj Parkinson’s Disease (2021) 15 Published in partnership with the Parkinson’s FoundationYou can also read