Genco Shipping & Trading Limited - B. Riley Securities Non-Deal Investor Presentation

Page created by Katie Deleon
 
CONTINUE READING
Genco Shipping & Trading Limited - B. Riley Securities Non-Deal Investor Presentation
Genco Shipping & Trading Limited

B. Riley Securities Non-Deal
Investor Presentation
NYSE:GNK
June 2021
Genco Shipping & Trading Limited - B. Riley Securities Non-Deal Investor Presentation
Forward Looking Statements
                                         "Safe Harbor" Statement Under the Private Securities Litigation Reform Act of 1995
This presentation contains forward-looking statements made pursuant to the safe harbor provisions of the Private Securities Litigation Reform Act of 1995. Such forward-looking
statements use words such as “anticipate,” “budget,” “estimate,” “expect,” “project,” “intend,” “plan,” “believe,” and other words and terms of similar meaning in connection with a
discussion of potential future events, circumstances or future operating or financial performance. These forward-looking statements are based on our management’s current
expectations and observations. Included among the factors that, in our view, could cause actual results to differ materially from the forward looking statements contained in this
report are the following: (i) declines or sustained weakness in demand in the drybulk shipping industry; (ii) continuation of weakness or declines in drybulk shipping rates;
(iii) changes in the supply of or demand for drybulk products, generally or in particular regions; (iv) changes in the supply of drybulk carriers including newbuilding of vessels or
lower than anticipated scrapping of older vessels; (v) changes in rules and regulations applicable to the cargo industry, including, without limitation, legislation adopted by
international organizations or by individual countries and actions taken by regulatory authorities; (vi) increases in costs and expenses including but not limited to: crew wages,
insurance, provisions, lube oil, bunkers, repairs, maintenance, general and administrative expenses, and management fee expenses; (vii) whether our insurance arrangements
are adequate; (viii) changes in general domestic and international political conditions; (ix) acts of war, terrorism, or piracy; (x) changes in the condition of the Company’s vessels
or applicable maintenance or regulatory standards (which may affect, among other things, our anticipated drydocking or maintenance and repair costs) and unanticipated drydock
expenditures; (xi) the Company’s acquisition or disposition of vessels; (xii) the amount of offhire time needed to complete maintenance, repairs, and installation of equipment to
comply with applicable regulations on vessels and the timing and amount of any reimbursement by our insurance carriers for insurance claims, including offhire days; (xiii) the
completion of definitive documentation with respect to charters; (xiv) charterers’ compliance with the terms of their charters in the current market environment; (xv) the extent to
which our operating results continue to be affected by weakness in market conditions and freight and charter rates; (xvi) our ability to maintain contracts that are critical to our
operation, to obtain and maintain acceptable terms with our vendors, customers and service providers and to retain key executives, managers and employees; (xvii) completion
of documentation for vessel transactions and the performance of the terms thereof by buyers or sellers of vessels and us; (xviii) the relative cost and availability of low sulfur and
high sulfur fuel, worldwide compliance with sulfur emissions regulations that took effect on January 1, 2020 and our ability to realize the economic benefits or recover the cost of
the scrubbers we have installed.; (xix) our financial results for the year ending December 31, 2021 and other factors relating to determination of the tax treatment of dividends we
have declared; (xx) the financial results we achieve for each quarter that apply to the formula under our new dividend policy, including without limitation the actual amounts
earned by our vessels and the amounts of various expenses we incur, as a significant decrease in such earnings or a significant increase in such expenses may affect our ability
to carry out our new value strategy; (xxi) the exercise of the discretion of our Board regarding the declaration of dividends, including without limitation the amount that our Board
determines to set aside for reserves under our dividend policy; (xxii) our ability to refinance and amend the terms of our credit facilities as contemplated in connection with our
new dividend policy; (xxiii) the duration and impact of the COVID-19 novel coronavirus epidemic, which may negatively affect general global and regional economic conditions;
our ability to charter our vessels at all and the rates at which are able to do so; our ability to call on or depart from ports on a timely basis or at all; our ability to crew, maintain,
and repair our vessels, including without limitation the impact diversion of our vessels to perform crew rotations may have on our revenues, expenses, and ability to consummate
vessel sales, expense and disruption to our operations that may arise from the inability to rotate crews on schedule, and delay and added expense we may incur in rotating crews
in the current environment; our ability to staff and maintain our headquarters and administrative operations; sources of cash and liquidity; our ability to sell vessels in the
secondary market, including without limitation the compliance of purchasers and us with the terms of vessel sale contracts, and the prices at which vessels are sold; and other
factors relevant to our business described from time to time in our filings with the Securities and Exchange Commission; and (xxiv) other factors listed from time to time in our
filings with the Securities and Exchange Commission, including, without limitation, our Annual Report on Form 10-K for the year ended December 31, 2020 and subsequent
reports on Form 8-K and Form 10-Q. Our ability to pay dividends in any period will depend upon various factors, including the limitations under any credit agreements to which we
may be a party, applicable provisions of Marshall Islands law and the final determination by the Board of Directors each quarter after its review of our financial performance. The
timing and amount of dividends, if any, could also be affected by factors affecting cash flows, results of operations, required capital expenditures, or reserves. As a result, the
amount of dividends actually paid may vary. We do not undertake any obligation to update or revise any forward-looking statements, whether as a result of new information,
future events or otherwise.
.

                                                                                                                                                                                    2
Genco Shipping & Trading Limited - B. Riley Securities Non-Deal Investor Presentation
Presenters

                                                                           Peter Allen
    John C. Wobensmith                Apostolos Zafolias
                                                                       Senior Vice President,
     Chief Executive Officer          Chief Financial Officer
                                                                        Strategy & Finance

◼   Over 25 years of             ◼   15 years of experience in    ◼   13 years of experience in
    experience in the shipping       the shipping industry            the shipping industry
    industry

                                 ◼   Significant experience in    ◼   Also serves as the
◼   Significant experience in        M&A, S&P, commercial             Company’s drybulk market
    managing all aspects of a        bank financing and capital       analyst
    drybulk shipping company         market transactions
    including commercial,
    technical and finance                                         ◼   Holds CFA designation
                                 ◼   Holds CFA designation

◼   Holds CFA designation

                                                                                            3
Genco Shipping & Trading Limited - B. Riley Securities Non-Deal Investor Presentation
Executive Summary
Genco Shipping & Trading Limited - B. Riley Securities Non-Deal Investor Presentation
Genco Shipping & Trading: Who We Are…
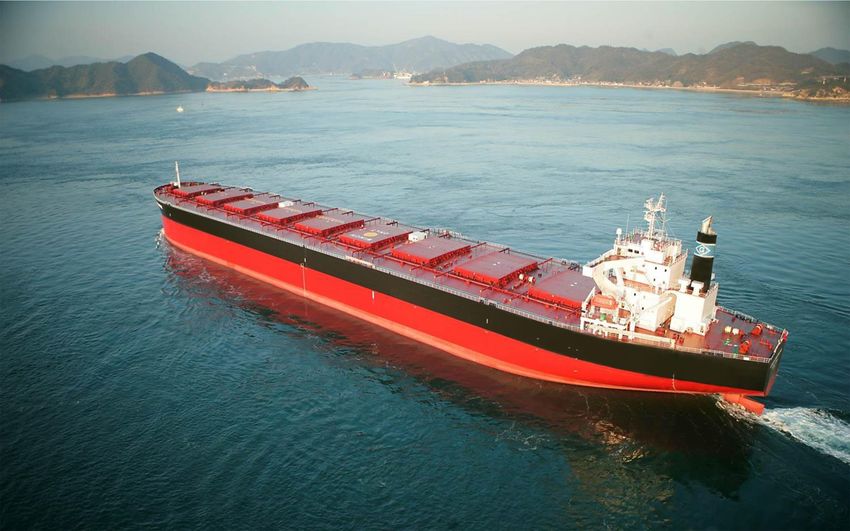
         ◼     Genco is the largest U.S. based drybulk shipowner

         ◼     We are headquartered in New York with global offices in Singapore and Copenhagen

         ◼     Our fleet pro forma for vessel sales consists of 42 modern, high quality drybulk vessels*

         ◼     Our large and scalable fleet consists of both major and minor bulk vessels

         ◼     Focused on the global transportation of commodities providing a full-service logistics solution to our customers

         ◼     We transport raw materials such as iron ore, grain, bauxite, cement, nickel ore across world-wide shipping routes

         ◼     NYSE listed under ticker symbol GNK

Note: Pro forma fleet is based upon agreed upon vessel sales (Genco Lorraine). Also includes the agreed upon purchase of the Genco Enterprise and two resale Ultramaxes.   5
Genco Shipping & Trading Limited - B. Riley Securities Non-Deal Investor Presentation
Genco transported 30 mdwt of drybulk commodities in 2020
We employ a diversified asset base consisting of the larger Capesize vessels and medium sized
Ultramax / Supramax vessels enabling us to carry a wide range of cargoes worldwide providing a
full-service logistics solution to customers through our in-house commercial operating platform

                                                                 Commodities carried

                                                                    Iron ore: 48%
  42      Genco’s owned fleet post agreed
vessels   vessel sales and purchases
                                                                     Grains: 15%

                                                                      Coal: 14%
 4.5      Of cargo carrying capacity
 mdwt
                                                                     Cement: 4%

                                                                 Potash/Fertilizer: 4%

          Fixtures booked by our in-house                         Steel/Pig Iron: 3%
~400
          commercial team across 3 global offices
                                                                 Alumina/Bauxite: 2%

                                                                    Limestone: 2%
          New customers that we conducted
 ~20
          business with in 2020
                                                                  Miscellaneous: 8%

                                                                                           6
Genco Shipping & Trading Limited - B. Riley Securities Non-Deal Investor Presentation
Genco’s differentiated approach
         Strong financial position

          ▪          Pro forma cash position of approximately $161 million, as of May 31, 2021 (net LTV of 25%)

          ▪          Strongest balance sheet among the peer group together with a simplified and flexible debt structure

          ▪          Paid a total of $0.805 per share in dividends over the past 7Q’s(1)

         Comprehensive value strategy centered around…

          ▪          Low leverage with a target of zero net debt

          ▪          Compelling dividend yield

          ▪          Growth through accretive vessel acquisitions

          Focus on long-term, sustainable operations

          ▪          High corporate governance standards: transparent US filer with no related party transactions

          ▪          Purchase modern, fuel efficient assets while divesting older, less fuel efficient tonnage to reduce
                     our carbon footprint

          ▪          Evaluating the feasibility of ammonia as an alternative marine fuel as part of the objective to
                     decarbonize the global shipping industry alongside 22 other companies within the maritime supply
                     chain including commodity producers, shipbuilders, shipowners, class societies and power utilities

          ▪          Employ a diverse global team with a strong culture of safety

1)   As previously announced, our dividend policy is reviewed by our Board of Directors on a quarterly basis.              7
Genco Shipping & Trading Limited - B. Riley Securities Non-Deal Investor Presentation
Genco’s global footprint – active, real-time commercial management
            Genco has vessels trading all over the world – our global presence enables us to capture
            market trends to enhance revenue generation

                             ✓     Americas
                                                     ✓      Europe
                                                                                                ✓           Asia

                                                                     Copenhagen
                                U.S. Headquarters                    Commercial
                                Corporate strategy                   Minor bulk focus
                                Finance/accounting                   Capture arbitrage opportunities
                                Commercial                           Closer to cargo customers
                                Technical
                                Operations

                                                                                         Singapore
                                                                                         Commercial
                                                                                         Operations
                                                                                         Capesize focus and minor bulk
                                                                                         backhauls/Pacific trading
                                                                                         Closer to cargo customers

                           Time difference to US:             +6 hours                                 +12/13 hours

                                                                                                                         8
Source: VesselsValue.com
Genco Shipping & Trading Limited - B. Riley Securities Non-Deal Investor Presentation
GNK stock performance metrics
          Since Dec 2020, the liquidity and daily traded volume in our stock has increased
          significantly together with the free float following large shareholder sales*

                                                   Category                                                December 10, 2020                                                          June 15, 2021

                                    Large shareholders’ %
                                                                                                                              58%                                                                 14%
                                         ownership*

                                 30-day avg share volume
                                                                                                                             0.2m                                                                1.0m
                                          traded

                                 # of private equity firms
                                                                                                                                 3                                                                    1
                                with board representation*

                                                  Market cap                                                               $330m                                                               $766m

                                                 Share price                                                                $7.89                                                              $18.27

                                       Increased free float and liquidity in the GNK stock is beneficial to the
                                                 execution of our comprehensive value strategy

*Represents ownership of large shareholders with representation on Genco’s board of directors. Prior to December 2020, Genco had three such shareholders. On December 15, 2020, the sole director affiliated with Strategic Value
Partners, LLC (“SVP”) resigned from our board, and investment funds affiliated with SVP reported sales reducing their ownership to approximately 1.3 million Genco shares, or approximately 3%. Furthermore, in March 2021, the director
affiliated with Apollo Global Management, LLC (“Apollo”) announced his intention not to stand for re-election to the board, and investment funds affiliated with Apollo reported sales reducing their ownership to approximately 0.4m shares, or
approximately 1%. Additionally, based on filings with the SEC through June 15, 2021, investment funds affiliated with Centerbridge Partners, L.P. (“Centerbridge”) reported sales that reduced their ownership of our stock to approximately
5.9 million shares, or approximately 14% of our stock. As a result, following our Annual Meeting of Shareholders in May 2021, we have one remaining large shareholder with board representation.                                                   9
Genco Shipping & Trading Limited - B. Riley Securities Non-Deal Investor Presentation
Comprehensive value strategy
Our new corporate strategy…
…is a holistic three-pronged approach including returning cash to shareholders,
further de-levering of the balance sheet and growth of the fleet

      Dividends                            De-levering                            Growth

                                                                             Use shares as a
                                        Scheduled debt                      currency to grow
      Cash flow                          repayments
      generation                                                             Utilize reserve +
                                      Debt prepayments                            revolver
  Reduced cash flow                  utilizing cash on the
    breakeven rate                     balance sheet +                      Opportunistically
                                             reserve                        sell older ships +
                                                                           redeploy proceeds

  Strategy ideally integrates with our barbell approach to fleet composition in which our minor
   bulk fleet provides stable cash flows to cover debt service, while our Capesize vessels provide
                              meaningful upside and operating leverage

                                                                                                11
Genco’s quarterly dividend framework / calculation
Targeting a quarterly dividend based on cash flow after debt service less a reserve

Genco's quarterly dividend to be paid based on the
                following formula:

                  Operating cash flow                                            Quarterly reserve is targeted to
                                                                                   be based on quarterly debt
                Less: Debt repayments                                           repayments and interest expense

                                                                                Reserve optionality: uses include
       Less: Capital expenditures for drydocking                                   debt prepayments, vessel
                                                                                 acquisitions, general corporate
                     Less: Reserve                                                          purposes

        Cash flow distributable as dividends

◼   Genco to provide guidance each quarter for the data above based on management estimates in our quarterly
    breakeven rates and TCE guidance

◼   For the purpose of the dividend calculation, operating cash flow is defined as: voyage revenue less
    voyage expenses, charter hire expenses, vessel opex, G&A other than non-cash restricted stock expenses,
    technical mgmt fees, interest expense other than non-cash deferred financing costs

◼   Determinations of whether to pay a dividend, the amount of any dividend, and the amount of reserves used in
    any dividend calculation will remain in our board of directors’ discretion

                                                                                                                  12
Our roadmap to year-end and implementation…
                                          Cash balance post advance of $21.5m                                                                 Debt paid down
                         $161m            for 3 Ultras agreed to be acquired and the                                                          ◼      $48.2m of debt repaid in Q1 2021,
                                          prepayment of our scrubber facility                                                                        including our revolving credit facility
May 31, 2021 pro forma

                                                                                                                                              ◼      Prepaid and retired our scrubber
                                                                                                                                                     facility of $20.0m in June 2021
                         $381m            Debt outstanding
                                                                                                                                              Growth
                                                                                                                                              ◼      Have agreed to acquire 3
                                                                                                                                                     Ultramaxes in April and May 2021,
                         $220m               Net debt                                                                                                marking our 5th and 6th Ultramax
                                                                                                                                                     acquisitions since December 2020
                                                                                                                                              Credit facility refinancing
                                                                                                                                              ◼      Negotiating a global refinancing to
                          25%                Net LTV
                                                                                                                                                     improve terms and reduce our cash
                                                                                                                                                     flow breakeven rate
Year-end targets

                                          Targeting a maximum net loan-to-value of ~20% by year-end
                          20%             (currently on pace to be ahead of target)

                         $75m             Cash balance following paydown of debt

          Notes: debt balance presented gross of unamortized debt issuance costs. Cash and debt are presented pro forma for the prepayment of our scrubber credit facility. Net debt is
          equal to debt minus cash. Cash balance includes restricted cash. Net loan-to-value figures presented above are based on VesselsValue.com estimates from June 2021 and
          assume the sale of the Genco Lorraine and the purchase of the Genco Enterprise and are shown for illustrative purposes. Actual results will vary.                               13
Illustrative cash flow sensitivity ($ in m, except TCE and per share data)
                                                       2022 illustrative analysis based on cash flow sensitivity

                                             Fleet-wide net TCE - 2022                                                         $       15,000          $        17,500         $        20,000                TCE rates in context…
                                                          Net revenue                                                          $             227       $             265       $              303
                                              Vessel operating expenses                                                                       (77)                    (77)                    (77)
                                                                                                                                                                                                                              $20,653
                                       G&A (ex-non cash restricted stock)                                                                     (20)                    (20)                    (20)            Q2 2021 TCE estimate for 74%
                                                                                                                                                                                                              of the quarter as of May 5, 2021
                                             Technical management fees                                                                          (5)                     (5)                      (5)
                                 Interest exp. (ex-deferred financing costs)                                                                    (7)                     (7)                      (7)
                                                    Operating cash flow                                                        $             118       $             156       $              193
                                                      Debt amortization                                                                       (15)                    (15)                    (15)                             $30,640
                                                                                                                                                                                                                Current Baltic Capesize Index
                                              Drydocking / BWTS capex                                                                         (11)                    (11)                    (11)
                          Cash flow after debt repayments / drydocking capex                                                   $               91      $             129       $              167
                      Cash flow distributable as dividends (after reserve)                                                     $               69      $             107       $              145
                                          Illustrative dividend per share                                                      $            1.65       $            2.55       $             3.45                              $29,332
                                                                                                                                                                                                                Current Baltic Supramax Index
              Implied share price based on annualized dividend yields of…
                                                                  7%                                                           $          23.52        $          36.43        $          49.33
                                                                  8%                                                           $          20.58        $          31.87        $          43.17                                $24,836
                                                                  9%                                                           $          18.30        $          28.33        $          38.37                   Fleet weighted 1 year time
                                                                                                                                                                                                                 charter rate per Clarksons +
                                                                10%                                                            $          16.47        $          25.50        $          34.53                  Capesize scrubber premium

                      ◼       Plan to continue to reduce our debt balance, with a long-term goal of zero debt

Note: The amounts set forth in the table above, including without limitation amounts calculated for cash flow distributable as dividends, illustrative dividend per share, and implied share price based on annualized dividend yields, are for
illustrative purposes only, and actual amounts will vary. Our ability to pay dividends in any period will depend upon various factors, including the limitations under any credit agreements to which we may be a party, applicable provisions of
Marshall Islands law and the final determination by our Board of Directors each quarter after its review of our financial performance. Please see p.2 and the appendix of this presentation for additional details. Operating cash flow and TCE are
non-GAAP financial measures. For a reconciliation of operating cash flow to net income, the most comparable financial measure presented in accordance with GAAP, please see the appendix of this presentation. TCE rates are assumed for
analytical purposes and encompass a number of underlying assumed variables. Non-cash restricted stock expense and deferring financing costs also depend on a number of variables that are unknown at this time. Accordingly, we are
unable to provide, without unreasonable efforts, a reconciliation of TCE, G&A (ex-non cash restricted stock), and interest expense (ex-deferred financing costs) to the most comparable financial measure presented in accordance with GAAP.
Baltic Capesize Index, Baltic Supramax Index and 1 year time charter rates are presented gross of commissions which is typically 5%. An assumed scrubber premium is added to Clarksons 1 year time charter rate. Rates are presented for
illustrative purposes.
                                                                                                                                                                                                                                                      14
Significant fleet-wide operating leverage
                                        $300

                                                                          Every $1,000 increase in TCE is ~$15m of
                                        $250             $15m             incremental annualized EBITDA on our
                                                                          42-vessel pro forma fleet

                                        $200
    Illustrative net revenue ($ in m)

                                        $150

                                        $100
                                                                                                                 For our 17 Capesizes specifically, every
                                                                                                $31m             $5,000 increase in TCE is ~$31m of
                                                                                                                 incremental annualized EBITDA
                                         $50

                                          $-
                                               $5,000   $6,000   $7,000    $8,000   $9,000   $10,000   $11,000   $12,000   $13,000   $14,000   $15,000   $16,000   $17,000   $18,000   $19,000   $20,000

                                                                                                                 Illustrative TCE

Note: based on a fleet of 42 ships, for illustrative purposes only
                                                                                                                                                                                                 15
Breakeven rate prior to debt service is covered…
         …in nearly every rate environment over the last two decades, highlighting the importance of the
         quarter dividend reserve to be targeted off debt and interest payments – a prudent approach to
         protect the balance sheet during volatile market periods

    $50,000

                                                                                                                            Illustrative fleet-wide time charter rate
    $45,000

                                                                                                                            Illustrative breakeven rate prior to debt service
    $40,000

    $35,000

    $30,000

    $25,000

    $20,000

    $15,000

    $10,000

      $5,000

          $-
               Q1-2000     Q3-2001       Q1-2003       Q3-2004       Q1-2006      Q3-2007       Q1-2009       Q3-2010       Q1-2012       Q3-2013       Q1-2015       Q3-2016       Q1-2018      Q3-2019    Q1-2021

Assumptions: Illustrative fleet-wide time charter rate is based on the quarterly averages of the Baltic Capesize Index and Baltic Supramax Index since 2000 weighted based on Genco’s pro forma fleet
composition of 42 vessels. An assumed scrubber premium is included together with a target minor bulk outperformance figure. Illustrative breakeven rate prior to debt service is based on our 2021
expense budgets across a fleet of 42 vessels.                                                                                                                                                              16
Market update and industry overview
Freight rates have started 2021 off strong…
       $60,000

                                                                                                                                      Index rates as of
                                                            Baltic Capesize Index                                                       June 15, 2021
       $50,000
                                                            Baltic Supramax Index
                                                                                                                                      BCI: $30,640
                                                            Current BSI

       $40,000

                                                                                                                                      BSI: $29,332

       $30,000

       $20,000

       $10,000

             $-
                  Jan-10 Jul-10 Jan-11 Jul-11 Jan-12 Jul-12 Jan-13 Jul-13 Jan-14 Jul-14 Jan-15 Jul-15 Jan-16 Jul-16 Jan-17 Jul-17 Jan-18 Jul-18 Jan-19 Jul-19 Jan-20 Jul-20 Jan-21

Source: Clarksons Research Services Limited 2021. BCI shown is the 4TC through 2014 then the 5TC thereafter. BSI shown is the 52 index through 2015 then the 58 index thereafter.
                                                                                                                                                                                    18
Asset values have significantly increased in the YTD…
          …but remain low relative to the current earnings environment

        $50                                                                                                     10yr old asset value increases in the YTD
                                                   10yr old Capesize
        $45

        $40                                        10yr old Supramax                                            Capes: +54%                                   Supras: +63%
        $35

        $30

        $25

        $20

        $15

        $10

         $5

        $-
             Jan-10 Jul-10   Jan-11 Jul-11   Jan-12 Jul-12   Jan-13 Jul-13   Jan-14 Jul-14   Jan-15 Jul-15   Jan-16 Jul-16   Jan-17 Jul-17   Jan-18 Jul-18   Jan-19 Jul-19   Jan-20 Jul-20   Jan-21

             ◼    Genco’s fleet average age is ~10 years and has directly experienced the rise in asset values

             ◼    Strong earnings environment since June 2020

             ◼    Strong historical correlation between freight rates and asset values currently holding

Source: Clarksons Research Services Limited 2021
                                                                                                                                                                                               19
Brazilian iron ore exports have recovered…
          …following poor weather conditions and operational challenges that disrupted production and
          shipments during most of 1H 2020

          ◼     Brazilian iron ore exports have increased by 16% YOY through May

          ◼     Vale 2021 production guidance of 315-335MT

          ◼     Vale forecasts to reach a runrate of 350mtpa by the end of 2021 and 400mtpa by the end of 2022

          ◼     Key iron ore route provides high volumes together with long ton mile trading distances

                 Recovering IO exports from Brazil…                                                     …with growth expected from Vale
                                                                                               450
 45

 40                                                                                +16%        400
                                                                                                                                     +50MT
 35                                                                                YOY         350             +30MT
                                                   37
 30                                     34                         33                          300

                                   30        31          31
 25                                                           29        29        28           250
       27                                                                              26 27
 20                     24                                                   24                200                                                  400
              22 21          22                                                                                               350
 15                                                                                            150      320
                                           Q1 is a seasonally softer period for
 10                                        Brazilian iron ore exports, which are               100
                                            historically weighted towards 2H
  5
                                                                                               50
   -
                                                                                                 0
                                                                                                        2020                  2021                   2022
                                                                                                     Year-end production run rates basis Vale forward guidance

Source: Clarksons Research Services Limited 2021, Vale
                                                                                                                                                        20
Drybulk newbuilding orderbook prior to slippage / scrapping
                                      Current drybulk newbuilding orderbook as a % of the fleet per Clarksons
                                                                   (does not take into account slippage or scrapping)

                2.0%

                1.5%                          2.2%                          2.6%                                        0.8%
                                   1.1%
   % of fleet

                1.0%                                       0.9%
                                                   0.7%
                                                                     0.6%                    0.6%
                                                                                 0.5%
                0.5%
                        0.4%
                                                                                                         0.2%       0.2%    0.2%    0.2%    0.1%
                0.0%
                        Q2-21      Q3-21           Q4-21   Q1-22     Q2-22       Q3-22       Q4-22       Q1-23      Q2-23   Q3-23   Q4-23   2024+

                  ◼    Orderbook as a % of the total drybulk fleet is currently 6%

                  ◼    7% of the fleet that is 20 years or older and 16% of the fleet 15 years or older

                  ◼    10% of the Capesize fleet is 15 years or older compared to 6% on order

                  ◼    From 2022 onwards, the orderbook is 3.5% of the fleet

                  ◼    N/B ordering in 2020 was the lowest total since 2016 at just 19mdwt - since 2015, average ordering has been
                       30mdwt per year

Source: Clarksons Research Services Limited 2021
                                                                                                                                              21
Global ordering trends focusing on containerships
                                                                                                        Drybulk     Tanker    Container
                                                    Drybulk                                  Current      6%             9%     18%
        70%
                                                                                             Oct-20       7%             8%      8%
        60%                                         Tanker                                 % Variance    -19%            7%     114%

                                                    Container                                Average      23%        16%        19%
        50%
                                                                                               Min        6%             8%      8%
        40%                                                                                   Max         66%        34%        38%

        30%

        20%

        10%

          0%

             ◼     Global newbuild ordering has been focused on the containership sector

                        ̶     Orderbook has increased to over 18% of the fleet from 8% in Oct 2020 – more than doubling

             ◼     Order volumes have increased significantly in the containership sector in recent months, where extremely firm
                   market conditions have supported a surge in newbuild contracts

             ◼     Availability remains tight for newbuilding slots with new orders likely to be set for 2023 delivery

Source: Clarksons Research Services Limited 2021
                                                                                                                                       22
2021 and 2022 drybulk outlook
                                   Drybulk market catalysts                        Marsoft 2021 to 2022 S&D growth estimates

                                                                                                         Vessel*                  2021                    2022
                          Record low orderbook as a percentage of
             1                                                                  Iron Ore
                          the fleet to limit net fleet growth
                                                                                                        Capesize                  +8.5%                   +4.4%

                          Unprecedented levels of global stimulus –                Coal
             2            global GDP forecast to rise by 6% in 2021                                     Capesize
                                                                                                                                  +3.7%                   +4.1%
                                                                                                        Panamax

                                                                                  Grain
                          China’s economy to continue to lead while                                     Panamax
             3            ROW continues economic improvement                                            Supramax                  +1.3%                   +1.4%
                                                                                                        Handysize

                                                                              Minor Bulk
                          Recovery and growth of Brazilian iron ore                                     Supramax
             4                                                                                                                    +6.6%                   +3.7%
                          exports                                                                       Handysize

                                                                            Total Demand                                          +5.8%                   +3.7%
                          India’s coal imports and steel production to
             5            continue their rebound
                                                                            Fleet Growth                                          +2.6%                   +0.6%

                                                                         *Indicates the primary vessel type that carries the respective commodities. Supply
                                                                         and demand forecasts are based on Marsoft’s base case from May 2021
Sources: Marsoft, Clarksons, IMF                                                                                                                              23
Conclusion
Genco is attractively positioned to capture market upside
                     ◼   Experienced US-based management team
   Leadership
                     ◼   US-filer with high corporate governance standards

 Drybulk Market      ◼   Demand and supply dynamics forecast to continue to improve in 2021 and 2022

 Capital Structure   ◼   Strong balance sheet + meaningful cash position + new value strategy

     Fleet           ◼   Expanded in Ultramax sector with 6 agreed upon acquisitions since Dec 2020
  Modernization

   Commercial        ◼   Active management through global commercial platform and full-service logistics solution
    Platform             with a track record of benchmark outperformance

  Genco’s Fleet      ◼   Barbell approach to fleet composition

                                                                                                           25
Appendix
Assumptions to illustrative cash flow sensitivity
◼     Fleet size: Based on a fleet of 42 vessels pro forma for agreed upon vessel sale and purchase activity to date.

◼     Illustrative rates used to calculate net revenue: Net revenue is defined as voyage revenues less voyage expenses less charter hire expenses. Illustrative time charter
      equivalent rates are presented on a net basis and are sensitized based on estimates provided by third-party industry research firms. TCE presented is multiplied by the estimated
      available days of the fleet resulting in an illustrative net revenue figure.

◼     Expenses: Assumed to remain at current levels for vessels in our fleet and otherwise. Illustrative expenses are based on Genco’s 2021 budget, including a daily fleet-wide vessel
      operating expense budget of $5,000 per vessel per day. Fleet-wide G&A and technical management fees remain similar to previous guidance.

◼     Drydocking / ballast water treatment system capex: Based on Genco’s 2022 capex budget of $11.5m.

◼     Quarterly debt amortization: For Q2 to Q4 2021, this is based on our current credit facility structure and assumes the resetting of debt amortization under our $495m credit
      facility. For 2022, a refinancing of our debt is assumed. We intend to refinance our credit facilities. We do not know what interest and amortization terms any refinanced credit
      facility will have. For analytical purposes only, we have used annual debt amortization based on initial discussions with our bank group of approximately $15m. The actual terms
      of a refinanced facility, if we enter into one, will depend on the results of negotiations with our lenders. Actual figures will vary. In a potential refinancing, we plan to include a
      revolver component for growth.

◼     Cash and debt balances: Starting balances are based on March 31, 2021 figures. It is assumed that cash is paid down to $75m to repay debt outstanding at year-end 2021.
      Timing of this paydown will vary. Potential refinancing fees and potential working capital fluctuations are not assumed in the illustrative calculations.

◼     Operating cash flow: Defined as voyage revenue less voyage expenses, charter hire expenses, vessel operating expenses, general and administrative expenses other than
      non-cash restricted stock expenses, technical management fees, and interest expense other than non-cash deferred financing costs.

◼     Illustrative dividend per share: Based on 41.9m shares outstanding.

◼     Reserve: The reserve will be set on a quarterly basis in advance of the subsequent quarter at the discretion of our Board of Directors and is anticipated to be based on future
      quarterly debt repayments and interest expense.

◼     Reconciliation of operating cash flow ($ in m):

             2022 illustrative analysis based on cash flow sensitivity                              Adjustment to
                                                                                                                                      Illustrative net income equivalent figures
       Fleet-wide net TCE - 2022             $     15,000      $    17,500     $    20,000          GAAP measure

               Net revenue                   $         227     $       265     $        303         $              -          $              227     $              265    $              303
       Vessel operating expenses                       (77)             (77)            (77)                       -                          (77)                  (77)                  (77)

    General & administrative expenses                  (20)             (20)            (20)                           (2)                    (22)                  (22)                  (22)

       Technical management fees                         (5)             (5)              (5)                      -                           (5)                   (5)                   (5)

             Interest expense                            (7)             (7)              (7)                          (4)                    (11)                  (11)                  (11)
          Operating cash flow                $         118     $       156     $        193

                                                                                                                                                                                    27
First Quarter Earnings
                                                                                      Three Months Ended                Three Months Ended
                                                                                         March 31, 2021                    March 31, 2020

                                                                                          (Dollars in thousands, except share and per share data)
                                                                                                                (unaudited)
    INCOME STATEMENT DATA:
    Revenues:
      Voyage revenues                                                                 $                   87,591        $                    98,336
       Total revenues                                                                                     87,591                             98,336
    Operating expenses:
     Voyage expenses                                                                                      35,074                             48,368
     Vessel operating expenses                                                                            19,046                             21,813
     Charter hire expenses                                                                                 5,435                              3,075
     General and administrative expenses (inclusive of nonvested stock amortization                        6,102                              5,767
     expense of $0.5 million and $0.5 million, respectively)
     Technical management fees                                                                             1,464                              1,854
     Depreciation and amortization                                                                        13,441                             17,574
     Impairment of vessel assets                                                                             -                              112,814
     Loss on sale of vessels                                                                                 720                                486
       Total operating expenses                                                                           81,282                            211,751

    Operating income (loss)                                                                                6,309                           (113,415)

    Other income (expense):
     Other income (expense)                                                                                  146                                (584)
     Interest income                                                                                          71                                 594
     Interest expense                                                                                     (4,541)                             (6,945)
       Other expense, net                                                                                 (4,324)                             (6,935)

    Net income (loss)                                                                 $                    1,985        $                  (120,350)
    Net earnings (loss) per share - basic                                             $                      0.05       $                       (2.87)
    Net earnings (loss) per share - diluted                                           $                      0.05       $                       (2.87)
    Weighted average common shares outstanding - basic                                              41,973,782                          41,866,357
    Weighted average common shares outstanding - diluted                                            42,276,380                          41,866,357

                                                                                                                                                         28
March 31, 2021 Balance Sheet
                                                                                                                          March 31, 2021                     December 31, 2020
                                                                                                                                            (Dollars in thousands)
                                                                                                                              (unaudited)
          BALANCE SHEET DATA:
          Cash (including restricted cash)                                                                           $                  164,025          $                 179,679
          Current assets                                                                                                                227,880                            247,202
          Total assets                                                                                                                1,180,343                          1,232,809
          Current liabilities (excluding current portion of long-term debt)                                                              33,579                             32,979
          Current portion of long-term debt                                                                                              65,277                             80,642
          Long-term debt (net of $8.7 million and $9.7 million of unamortized debt issuance                                             327,064                            358,933
             costs at March 31, 2021 and December 31, 2020, respectively)
          Shareholders' equity                                                                                                           746,817                            744,994

                                                                                                                                   Three Months Ended
                                                                                                                          March 31, 2021         March 31, 2020
                                                                                                                                            (Dollars in thousands)
                                                                                                                                                  (unaudited)

          OTHER FINANCIAL DATA:
          Net cash provided by (used in) operating activities                                                         $                   13,494         $                   (4,038)
          Net cash provided by investing activities                                                                                       19,950                              5,577
          Net cash used in financing activities                                                                                          (49,098)                           (14,280)
                                                                                                                                                 (unaudited)

          EBITDA Reconciliation:
           Net income (loss)                                                                                         $                       1,985       $                 (120,350)
           + Net interest expense                                                                                                            4,470                            6,351
           + Depreciation and amortization                                                                                                  13,441                           17,574
                      (1)
              EBITDA                                                                                                 $                      19,896       $                  (96,425)

           + Impairment of vessel assets                                                                                                       -                            112,814
           + Loss on sale of vessels                                                                                                           720                              486
             Adjusted EBITDA                                                                                         $                      20,616       $                   16,875

 (1)   EBITDA represents net income (loss) plus net interest expense, taxes, and depreciation and amortization. EBITDA is included because it is used by management and certain
       investors as a measure of operating performance. EBITDA is used by analysts in the shipping industry as a common performance measure to compare results across peers. Our
       management uses EBITDA as a performance measure in consolidating internal financial statements and it is presented for review at our board meetings. We believe that
       EBITDA is useful to investors as the shipping industry is capital intensive which often results in significant depreciation and cost of financing. EBITDA presents investors with a
       measure in addition to net income to evaluate our performance prior to these costs. EBITDA is not an item recognized by U.S. GAAP (i.e. non-GAAP measure) and should not
       be considered as an alternative to net income, operating income or any other indicator of a company's operating performance required by U.S. GAAP. EBITDA is not a measure
       of liquidity or cash flows as shown in our consolidated statement of cash flows. The definition of EBITDA used here may not be comparable to that used by other companies.            29
First Quarter Highlights
                                                                                                                                           Three Months Ended
                                                                                                                                  March 31, 2021             March 31, 2020
                                                                                                                                                 (unaudited)
FLEET DATA:
Total number of vessels at end of period                                                                                                                  41                                        53
Average number of vessels (1)                                                                                                                           43.3                                      54.3
Total ownership days for fleet (2)                                                                                                                     3,897                                     4,942
Total chartered-in days (3)                                                                                                                              341                                       422
Total available days (4)                                                                                                                               4,201                                     5,229
Total available days for owned fleet (5)                                                                                                               3,860                                     4,807
Total operating days for fleet (6)                                                                                                                     4,122                                     5,126
Fleet utilization (7)                                                                                                                                  97.8%                                     97.8%

AVERAGE DAILY RESULTS:
Time charter equivalent (8)                                                                                                 $                        12,197           $                          9,755
Daily vessel operating expenses per vessel (9)                                                                                                        4,887                                      4,413

(1)   Average number of vessels is the number of vessels that constituted our fleet for the relevant period, as a measured by the sum of the number of days each vessel was part of our fleet during the
      period divided by the number of calendar days in that period.
(2)   We define ownership days as the aggregate number of days in a period during which each vessel in our fleet has been owned by us. Ownership days are an indicator of the size of our fleet over a
      period and affect both the amount of revenues and the amount of expenses that we record during a period.
(3)   We define chartered-in days as the aggregate number of days in a period during which we chartered-in third-party vessels.
(4)   We define available days as the number of our ownership days and chartered-in days less the aggregate number of days that our vessels are off-hire due to familiarization upon acquisition, repairs
      or repairs under guarantee, vessel upgrades or special surveys. Companies in the shipping industry generally use available days to measure the number of days in a period during which vessels
      should be capable of generating revenues.
(5)   We define available days for the owned fleet as available days less chartered-in days.
(6)   We define operating days as the number of our total available days in a period less the aggregate number of days that the vessels are off-hire due to unforeseen circumstances. The shipping
      industry uses operating days to measure the aggregate number of days in a period during which vessels actually generate revenues.
(7)   We calculate fleet utilization as the number of our operating days during a period divided by the number of ownership days plus time charter-in days less days our vessels spend in drydocking.
(8)   We define TCE rates as our voyage revenues less voyage expenses and charter-hire expenses, divided by the number of the available days of our owned fleet during the period. TCE rate is a
      common shipping industry performance measure used primarily to compare daily earnings generated by vessels on time charters with daily earnings generated by vessels on voyage charters,
      because charterhire rates for vessels on voyage charters are generally not expressed in per-day amounts while charterhire rates for vessels on time charters generally are expressed in such
      amounts.
(9)   We define daily vessel operating expenses to include crew wages and related costs, the cost of insurance, expenses relating to repairs and maintenance (excluding drydocking), the costs of spares
      and consumable stores, tonnage taxes and other miscellaneous expenses. Daily vessel operating expenses are calculated by dividing vessel operating expenses by ownership days for the relevant
      period.

                                                                                                                                                                                                30
Time Charter Equivalent Reconciliation(1)
                                                                                                                          Three Months Ended
                                                                                                                 March 31, 2021             March 31, 2020
                                                                                                                                (unaudited)
       Total Fleet
       Voyage revenues (in thousands)                                                                       $                    87,591       $                   98,336
       Voyage expenses (in thousands)                                                                                            35,074                           48,368
       Charter hire expenses (in thousands)                                                                                       5,435                            3,075
                                                                                                                                 47,082                           46,893

       Total available days for owned fleet                                                                                       3,860                             4,807
       Total TCE rate                                                                                       $                    12,197       $                     9,755

                                                                                                            Three Months Ended
                                                                          June 30, 2020                     September 30, 2020                     December 31, 2020
                                                                                                                (unaudited)
Total Fleet
Voyage revenues (in thousands)                                    $                         74,206      $                         87,524      $                           95,495
Voyage expenses (in thousands)                                                              41,695                                33,487                                  33,435
Charter hire expenses (in thousands)                                                         1,432                                 1,020                                   4,780
                                                                                            31,079                                53,017                                  57,280

Total available days for owned fleet                                                          4,643                                4,628                                   4,350
Total TCE rate                                                    $                           6,693     $                         11,456      $                           13,167

 (1)      We define TCE rates as our voyage revenues less voyage expenses and charter-hire expenses, divided by the number of the available days of our owned fleet
          during the period. TCE rate is a common shipping industry performance measure used primarily to compare daily earnings generated by vessels on time
          charters with daily earnings generated by vessels on voyage charters, because charterhire rates for vessels on voyage charters are generally not expressed in
          per-day amounts, while charterhire rates for vessels on time charters generally are expressed in such amounts.

                                                                                                                                                                          31
Genco pro forma fleet list
                                                 Major Bulk                                                                              Minor Bulk
                             Vessel Name                Year Built         Dwt          Vessel Name               Year Built          Dwt         Vessel Name              Year Built    Dwt
                             Capesize                                                   Ultramax                                                  Genco Brittany             2010       58,018
                             Genco Resolute                 2015         181,060        Genco Enterprise              2016          64,000        Genco Languedoc            2010       58,018
                             Genco Endeavour                2015         181,060        Baltic Hornet                 2014          63,574        Genco Pyrenees             2010       58,018
                             Genco Constantine              2008         180,183        Genco Freedom                 2015          63,498        Genco Rhone                2011       58,018
                             Genco Augustus                 2007         180,151        Genco Vigilant                2015          63,498        Genco Aquitaine            2009       57,981
                             Genco Liberty                  2016         180,032        Baltic Mantis                 2015          63,470        Genco Warrior              2005       55,435
                             Genco Defender                 2016         180,021        Baltic Scorpion               2015          63,462        Genco Predator             2005       55,407
                             Genco Tiger                    2011         179,185        Genco Magic                   2014          63,446        Genco Provence             2004       55,317
                             Baltic Lion                    2012         179,185        Baltic Wasp                   2015          63,389        Genco Picardy              2005       55,257
                             Genco London                   2007         177,833        Genco Weatherly               2014          61,556
                             Baltic Wolf                    2010         177,752        Genco TBN #1                  2022          61,000
                             Genco Titus                    2007         177,729        Genco TBN #2                  2022          61,000
                             Baltic Bear                    2010         177,717        Genco Columbia                2016          60,294
                             Genco Tiberius                 2007         175,874        Supramax
                             Genco Commodus                 2009         169,098        Genco Hunter                  2007          58,729                     17                   25
                                                                                                                                                             Capesize            Ultra/Supra
                             Genco Hadrian                  2008         169,025        Genco Auvergne                2009          58,020
                             Genco Maximus                  2009         169,025        Genco Ardennes                2009          58,018
                             Genco Claudius                 2010         169,001        Genco Bourgogne               2010          58,018

Note: Pro forma fleet is based upon agreed upon vessel sales (Genco Lorraine). Also includes the agreed upon purchase of the Genco Enterprise and two resale Ultramaxes.                         32
Genco’s environmental indicators snapshot
            Near and long-term environmental objectives are increasingly reflected in our strategic decision
            making process particularly through the acquisition of modern, fuel-efficient vessels

                                          872k CO2 emissions (metric tons CO2)                                                                                                            Data presented verified by
                                                                                                                                                                                          DNV GL Maritime Advisory
                                          3.22 Average Efficiency Ratio – (g CO2 / dwt x NM)
               2020 data

                                          6.05 Energy Efficiency Operational Indicator (g CO2 / t x NM)

                                          100% Compliance with IMO 2020 global sulfur cap

                                          100% Of our fleet has an A through E GHG rating and an average Rightship Rating of 4 stars
               Where we currently stand

                                           12    Modern, fuel efficient vessels agreed to be acquired since 2018

                                           32    Ballast Water Treatment Systems installed fleet-wide (76% of fleet)

                                           16    Mewis Ducts installed fleet-wide to reduce fuel consumption and emissions (38% of fleet)

                                           12    Engine Power Limitations installed fleet-wide to reduce emissions (29% of fleet)

Note: Percentages of fleet calculations are based on the pro forma fleet of 42 vessels. Emissions data calculated from Jan 1 to Dec 31 for 2020, compared to a voyage basis previously.
                                                                                                                                                                                                               33
Fleet renewal program: divestiture portion complete
                                                               Genco’s pro forma fleet composition
                                                            (based on sale and purchase activity from 2018 to date)

                    25
                                                                                                                                       Base Fleet                    Bought        Sold
                    20                                                                                        8
     # of Vessels

                    15              4

                    10
                                                                                                             17                                                               16
                                    13
                     5
                                                                                                                                                  8
                                                                         6
                     -
                                 Cape                                 Pana                           Ultra/Supra                                53s                        Hmax/Hsize

                         ◼   Fleet composition strategy: “barbell” approach to fleet composition concentrated on the ownership of
                             Capesize and Ultramax/Supramax vessels

                         ◼   Completed vessel swap transaction: acquired 3 modern, eco Ultramaxes in exchange for 6 older,
                             non-core Handysize vessels – grew in the core Ultramax sector while completing our exit of Handysizes

                         ◼   Expand in the Ultramax sector – agreed to acquire 3 additional modern, eco Ultramaxes, including two
                             resale vessels, in April and May 2021

Note: Pro forma fleet is based upon agreed upon vessel sales (Genco Lorraine). Also includes the agreed upon purchase of the Genco Enterprise and two resale Ultramaxes.                  34
Inventory levels for key major bulk trades
                             China’s steel inventories                      China’s iron ore port inventories
    30
                                                                      170

    25                                                                160

                                                                      150
    20

                                                                      140
    15
                                                                      130
    10
                                                                      120

     5
                                                                      110

     -                                                                100

                                                                            India’s coal powerplant stockpiles
         ◼     China’s steel inventories experienced seasonal         60
               restocking in Q1, but have now seen multiple
               weeks of drawn downs                                   50

                                                                      40
         ◼     China’s iron ore port inventories have increased off
               mid-2020 lows, but remain well below the multi-        30
               year highs seen in 2018
                                                                      20

         ◼     India’s coal powerplant stockpiles have continued      10
               to remain below record levels seen last year
                                                                       -

Source: Commodore Research
                                                                                                                35
Strong grain trade + improvement in other minor bulk trades
                                                                                                       China’s soybean imports
                                                                                                 110
                                                                                                 100
                                                                                                 90
                                                                                                 80

                                                                                   Black Sea –
                                                   US – Q4 peak season              Aug peak
                                                                                     season                                 China
                                                   Firm exports carried
                                                                                                                         Ramping up
                                                   into 2021
                                                                                                                      soybean imports
                                                                                                                     following recovery
                                                                                                                      in demand from
                                                                                                                         the swine flu

                                                                  Brazil – Q2 to
                                                                    Q3 peak
                                                                 season, record
                                                                  soybean crop

           ◼     Minor bulk trades are expected to further improved in 2021 given IMF’s forecast of 6% global GDP growth
           ◼     Grain trade has been resilient as China recovers from the swine fever outbreak in 2019 + strong Brazil crop
           ◼     Large scale purchases of US agricultural products have been made by China in recent months which has resulted in
                 a firm US export season

Source: Clarksons Research Services Limited 2021
                                                                                                                                     36
Active shipyards per country
                                              # of active shipyards across the three largest shipbuilding countries

                                500
                                                       China                            435                Active shipyards in China have
                                450
                                                                                                            been reduced by 310 or 71%
                                                       Japan
                                400                                                                             since the 2009 peak
        # of active shipyards

                                350                    S. Korea

                                300
                                250
                                200                                                                                                          125
                                150
                                100
                                50
                                  0

                                      ◼   Japan’s # of shipyards has declined at a much lower rate (-23%) vs China’s (-71%) since the 2009 peak
                                      ◼   The two main builders of drybulk vessels are China and Japan as S. Korea has focused on other sectors
                                      ◼   In 2007, 259 shipyards received an order vs just 37 in 2020

Source: Clarksons Research Services Limited 2021
                                                                                                                                             37
Thank you
You can also read