Northland Power Investor Presentation - June 2022
←
→
Page content transcription
If your browser does not render page correctly, please read the page content below
Northland Power
Investor Presentation
June 2022

CORPORATE OVERVIEW
Northland
NorthlandOverview
Overview
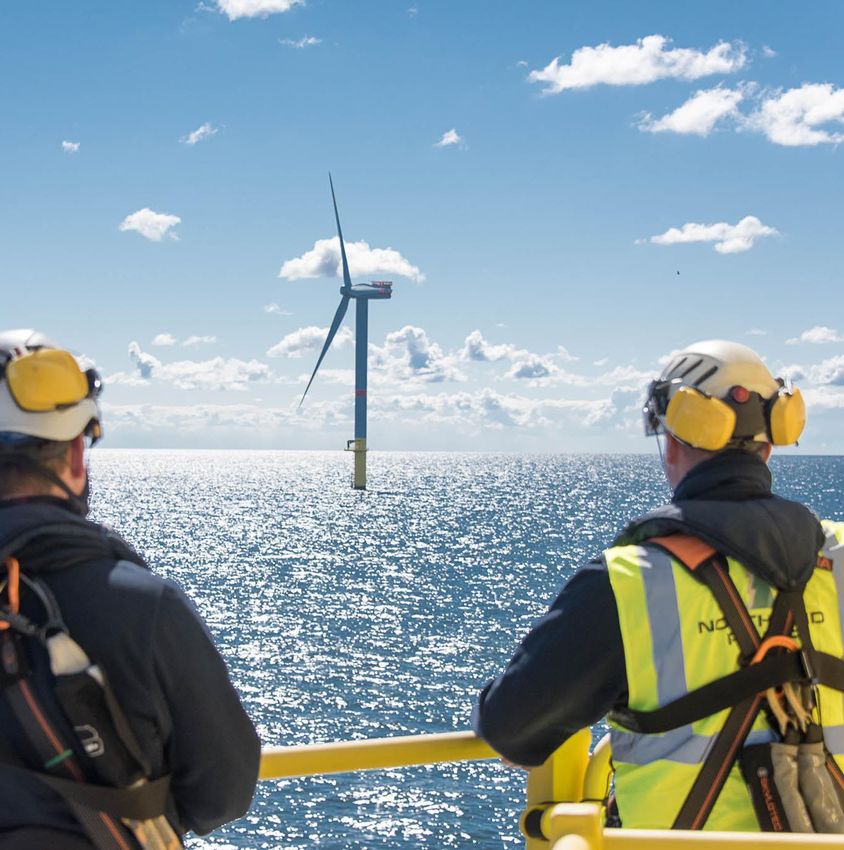
• A top global player in offshore wind – fastest growing renewables power technology
• Northland Power is a leading global power producer at the forefront of the
global energy transition
• Over 30 years of success developing, constructing and operating power
projects across a range of technologies
• Well-diversified portfolio of high-quality power infrastructure assets: over 3 GW
of operating capacity
• Majority of revenues under long-term contracts with highly creditworthy
government counterparties
• Significant development opportunities across multiple markets and
technologies: 14 GW development pipeline to support growth
• Significant depth of management experience across a number of disciplines
including renewable power project development, project finance, construction
and operations.
• Strong environmental and health & safety record
Regional
                                    Development Offices
                                    Toronto              Houston
                                    Mexico City          Bogota
                                    Glasgow              Amsterdam
                                    Seoul                Tokyo
                                    Madrid               Warsaw

Global Competitive
Position                            Offshore Wind

Northland is on the ground in key   Offshore wind engineering and
                                    construction management centers
markets
                                    Hamburg              Taipei

                                    Onshore
                                    Renewables
                                    Onshore wind, solar and
                                    construction management

                                    Toronto

                                                                      4
Global Company with Local Presence
     Established Regional Presence Provides Competitive Advantage

     Offshore Wind Strategy                              Onshore Renewables Strategy                           New Technologies

•     TOP 10 Incumbent in Global Offshore Wind           •   Growth in near-term cash flow                     • New growth area focus for Northland
                                                         •   Industry is expected to grow at upwards of        • Exploring opportunities in energy storage and
•     Fastest Growing Renewables Technology
                                                             10% per annum over the next decade                  green hydrogen
•     Significant driver of value and growth over next                                                         • A way to tap higher-value end markets for our
      decade                                             •   We continue to build local capabilities in          electrons
                                                             development to ensure that sufficient resources
•     1.2 GW in operations and 2.7 GW1 of projects           are available in supporting functions
      which will achieve financial close within the
      next 2 years                                       •   M&A will continue to play a role to grow
                                                             presence in select markets
•     Building size and scale across multiple markets
      in Europe and Asia                                 •   Focus will be on key markets including the US
                                                             Northeast, Southern and Eastern Europe and
                                                             Colombia

1.    Includes Hai Long, Baltic Power and Nordsee Two                                                                                          Northland Power   5
Accelerating Growth
 Northland’s capital allocation is focused on renewable growth

                                  Northland has the following major business segments

   Offshore Wind             Onshore Renewables              Utilities      Efficient Natural Gas     New Technologies
  Increase Exposure           Increase Exposure         Increase Exposure      Reduce Exposure         Establish Position

                  Our Renewables segments are growing in line with our capital allocation strategy, and we intend to
                   establish initial positions in new technologies such as energy storage and renewable green fuels

                                                                                                                    Northland Power   6
Sustainability                           Keep our people healthy & safe
                                         by upholding the highest standard of safety and
                                         wellbeing of our people, contractors and all other
Developing programs and initiatives to   stakeholders
inspire, train and grow our workforce

                                         Further differentiate our workforce
                                         by attracting, developing and retaining the best
                                         people to help execute on our strategy

                                         Prioritizing diversity, inclusion and belonging
                                         By ensuring our people feel respected, included and
                                         empowered to contribute to the advancement, growth
                                         and success of Northland

                                                                                               Northland Power   7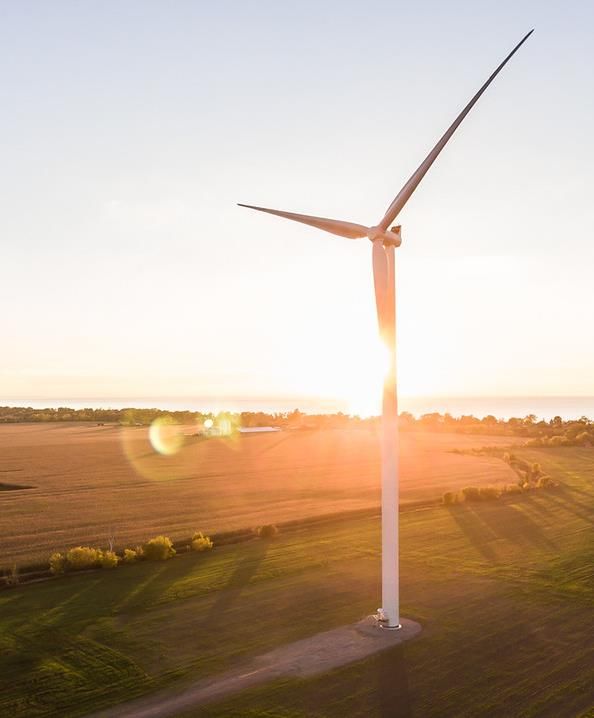
2021 Sustainability Report
 Our ESG Performance

Launched our 2021 Sustainability Report and ESG Performance Index. Both reports represent an enhanced level of ESG disclosure for
Northland’s and contain information and data covering our activities and accomplishments in 2021.

Alignment and reporting
standards
        Relevant United Nations Sustainable
        Development Goals (UN SDGs)

        Alignment with the Sustainability
        Accounting Standards Board (SASB)
        KPIs for our industries

        In accordance with a core level
        Global Reporting Initiative Standard
        (GRI)

        In alignment with the
        recommendations of the Taskforce
        for Climate-Related Financial
        Disclosures (TCFD)

                                                                                                                        Northland Power   8
PORTFOLIO OVERVIEW
Diversified Asset Portfolio
            Strong operating foundation with a significant growth profile

                                                                                                                                Europe (Offshore Wind):
                                              Canada:                                                                           Operated: 1,184 MW
                                              Operated: 1,267 MW                                                                Development: 2,533 MW
                                              Development : 400 MW
                                                                                              United Kingdom/Scotland:
                                                                                              Development: 2,340 MW

                                                                                        U.S.:
                                                                                        Development: 320 MW                                                             South Korea:
                                                                                                                         Spain:                                         Development: 1,600 MW               Japan:
                                                                                                                         Operated: 559 MW                                                                   Development: 900 MW

                        Mexico:                                                                                                                                    Taiwan:
                        Development: 130 MW                                                                                                                        Development: 1,044 MW

                                          Colombia:
                                                                                                                                                          Technology:                           Operating            Under Construction &
                                          Operated Utility
                                                                                                                                                                                                                    Advanced Development
                                          Development: 146 MW
                                                                                                                                                          Offshore Wind                         1,184 MW                           2,677 MW

                                                                                                                                                          Onshore Wind                           837 MW                             320 MW
                  Operating
                                                                                                                                                          Solar                                  246 MW                             276 MW
                  Early – Stage Development
                  Mid/late Stage Development/Construction                                                                                                 Natural Gas                            743 MW                                   -

                                                                                                                                                          Total Capacity (Gross)1,2             3,010 MW                          3,273 MW

1.   As at May 18, 2022                                                                                                                                                                                          Northland Power     10
2.   Includes Hai Long, Baltic Power, Nordsee Two, La Lucha, Helios, Suba and NY Wind
Offshore wind –88%
Technology
Sustainable growth
Strong Growth Portfolio Across Multiple
14 Onshore wind – 3%
Technologies
GW Solar – 6%
Other – 3%
Continue to target Europe and Asia as key markets for
offshore wind development
Expand onshore footprint in Northeast United States and
Colombia as well as Europe, targeting EU Eastern Europe
and Spain
Focus on establishing global position in green hydrogen
and storage
Toronto
Europe - 49% North America – 12%
Geography Houston
Bogota
14
Mexico City
Northland Glasgow
Power Hamburg
Latin America – 1%
GW Asia – 38%
presence
Amsterdam
Warsaw
Madrid
Tokyo
Seoul
TaipeiOffshore Wind Strategy
Leveraging our global leadership position
TOP 10 Incumbent in Global
Offshore Wind
1.2 GW in operations and 2.7 GW1 of projects which
will achieve financial close within the next 2 years
Fastest Growing Renewables Technology
1. Includes Hai Long, Baltic Power and Nordsee Two
Northland Power 12Offshore Wind Strategy
Projects and teams in top global markets for offshore wind
National offshore wind
targets by 2035
Australia: 2GW
Brazil: 3GW
France: 11GW
Germany: 40GW
Ireland: 6GW
India: 8GW
Japan: 10GW
Netherlands: 22GW
Poland: 11GW
Spain: 2GW
S. Korea: 12GW
Taiwan: 21GW
UK: 50GW
US: 40GW
Vietnam: 7GW
Our active offshore wind markets in bold
Northland Power 13
Source: BNEF, 4C Offshore, NPI analysisEurope
Established offshore wind platform in North Sea
1 Deutsche Bucht
COD: 2020
Capacity: 252 MW
Ownership: 100%
PPA Expiry: 2032
1 Deutsche Bucht
Nordsee One
2 Gemini
1.2 GW
3
1
Offshore wind
in-operation Netherlands 3 Nordsee One
Gemini Germany
COD: 2017
COD: 2017
2 Capacity: 332 MW
Capacity: 600 MW
Ownership: 85%
Ownership: 60%
PPA Expiry: 2027
PPA Expiry: 2031
1. Represents total gross operating capacity . Northland Power 14Baltic Power
Established position in Eastern Europe through Baltic Power offshore wind project
Up to 1.2 GW Baltic Power
• Poland is an attractive new country within the EU, with growth potential in
onshore and offshore
• Granted a 25-year fixed price Contract for Differences (“CfD”)
• Partnership provides local presence and scale resulting in enhanced returns
due to synergies in development, construction and operation
• Progress the project to financial close by completing design, certification, Poland
consents, procurement strategy, optimisation and financing plan Poland
Timeline For Baltic Power Development
2021 2022 2023 2024 2026
Acquired Project design Achieve Financial Expect to start Expected
interest/ Secured and optimization Close Construction Commercial
CfD Operations
Northland Power 15Nordsee Cluster Offshore Wind
Building Scale and Size in German Offshore Wind
Nordsee Delta Nordsee Two
480 MW 433 MW
1.3 GW Nordsee Three
Nordsee One 420 MW
• Partnership provides scale resulting in enhanced returns due to synergies in
development, construction and operation of the cluster projects
• Secured Nordsee Two site through exercise of step-in rights
• Auction for Nordsee Three and Nordsee Delta with a total capacity of 900
MW will be in 2023. Partnership holds step-in rights for both sites
• Enhanced offtake capabilities through formation of cluster
Germany
Timeline For Nordsee Cluster Development
2021 2023 2024 2026 2026/28
Expected Financial Expected
Exercised Step-in Expected Step-in for Expected Financial
Close Nordsee Commercial
for Nordsee Two Nordsee Three/Delta Close Nordsee Two Three/Delta Operations
Northland Power 16Scotwind Offshore Wind
Executing on our strategy to Extend our Offshore wind runway
2.3 GW N3
N N1
2
• Successfully awarded two leases in recent Crown Estate Scotland offshore
wind process
• Lease N4 – 840 MW fixed bottom foundation
• Lease N2 – 1,500 MW floating foundation
• Continuation of Northland’s offshore strategy of being early mover in key
markets. Extends Company’s development runway into next decade
• Example of establishing local partnerships leading to success
UK
• Next steps include moving development plans forward and finalizing local UK
content requirements in plan UK
UK
Timeline For Scotwind Development
2022 2029/30 2030’s
Secured Leases Expected Expected
Commercial Commercial Northland Power 17
Operations - Fixed Operations -Asia
Hai Long project anchor for growth across the region
Japan
South Korea
4.0 GW+1 Taiwan
Offshore wind
in-development
Taiwan
Hai Long
1, 044 MW
Japan South Korea
Early Stage Development
Chiba Katagami Dado Ocean Bobae
600 MW up to 400 MW Up to 1,000 MW 600 MW
Mid/Advanced Stage Development
1. Represents total gross in development pipeline Northland Power 18Hai Long
Progressing to financial close
1.0GW
• Hai Long comprises two adjacent sites: 532 MW Hai Long 2 and 512 MW Hai Long 3
• Localization plan obtained in 2021 HL HL
3 2
• Tendering for main components concluded, preferred supplier agreements signed
• EIA amendment approved, allowing for 14MW turbines Taipei
City
• Main design works (turbine foundations, Offshore and onshore substations) and
corresponding certification progressing well and on track, now well into the detailed
design phase
• Launched project finance activities Taiwan
• Commenced with sell-down process
Timeline For Hai Long Development
2021 2022 2023 2026-2027
Project optimization Expected
Achieve Financial Construction
through offtake, design Commercial
Close underway
and procurement Operations
Northland Power 19Asia Offshore Wind Development
Advancing milestones to facilitate growth and opportunities for future offshore wind
Announced entry into Japanese market in 2019 with Chiba project and followed up with
membership in consortium to develop Katagami project in 2021.
Isumi City, Chiba Prefecture
• Developing in partnership with Shizen Energy and Tokyo Gas
Japan | 1.0 GW+ • The Government designated the area as a Promising Area in the Round 3 announcement. Deployed
early-stage a floating LIDAR to collect data on meteorological conditions alongside onshore measurements
• Completed offshore geotechnical and geophysical surveys and engineering work for the auction
Development portfolio • Continue work with the local communities and stakeholders to support the project
Katagami City, Akita Prefecture
• Developing in partnership with Mitsui Co. Ltd, Osaka Gas and United Keikaku
• Up to 400 MW offshore wind capacity
• The Government designated the area as a Promising Area in the Round 3 announcement.
• Completed offshore geotechnical and geophysical surveys and engineering work for the auction
• Continue work with the local communities and stakeholders to support the project
Northland Power 20Asia Offshore Wind Development
Advancing milestones to facilitate growth and opportunities for future offshore wind
Acquired Dado Offshore Wind Corp. in February 2020
Multiple early-stage development opportunities near Chodo Island
Dado
• A 1GW+ mid-stage offshore wind project in-development
South Korea | 1.6 • Secured 2 out of 3 electricity business licenses (EBLs) which grant the priority development rights
to Northland. The third EBL is expected in the summer of 2022
GW+ early/mid- • First major permit on route to financial close. Gives Northland development exclusivity over the site
stage development area
Team secured EBLs through gaining local community support for the project and wind data
portfolio
•
collection
• Project development is progressing and expecting to start offshore works, design and securing grid
in 2022
Bobae, Jindo County
• 600 MW+ early-stage offshore wind development project
• Completed 12-months of onshore wind measurement for use in the initial EBL applications
• Submitted the initial EBL applications with results expected in the first half of 2022
• A floating LIDAR was deployed, wind data is under measurement and will be used to submit
additional EBLs in 2022
Northland Power 21Onshore Renewables
Our onshore renewables strategy
Onshore renewables present an attractive growth
opportunity for Northland
• The industry is expected to grow at upwards of 10% per annum over the next
decade.
• We continue to build local capabilities in development to ensure that
sufficient resources are available in supporting functions
• Growth in near-term cash flow
• M&A will continue to play a role to grow presence in select markets
• Focus will be on key markets including the US Northeast, Southern and
Eastern Europe and Colombia
Northland Power 22Spain
• 57 GW market growth by 2030
• Northland is top ten operator
• Focus on development and M&A to grow platform
Onshore Renewables EU Eastern Europe
• 22 GW market growth by 2030
• Capitalise on Northland “brand” created by
Strategy Baltic Power
• Focus on development
Targeted Approach North East United States
• 50 GW market growth by 2030
• Established Northland development team
• Focus on development
✓ Target limited number of high Colombia
growth markets • 8 GW market growth by 2030
• EBSA platform creates advantage
✓ Create competitive positions on the • Focus on development and M&A
ground
✓ Secure scale at local level
Source: Arcadia Center EnergyVision 2030, Statista.com 23Spain Onshore Renewables
Achieving Success in Onshore M&A
Execution on M&A strategy to secure near-term cash flow and establish new
market
• Acquired a portfolio of 551 MW (net) of onshore renewables with a
regulated tariff
• Delivers near-term cash flow which helps fund the development of
Northland’s large offshore wind projects
• Creation of a European onshore renewables asset management
platform
• It places Northland immediately as a top 10 operator in the growing
Spanish renewables market.
• Assets are supported with a regulated tariff with more than 13 years
remaining of regulatory life
Northland Power 24United States
New York onshore wind
Ball Hill
320 MW
108 MW
Bluestone
112 MW
• Acquired three New York onshore wind development projects in 2020. Projects Highbridge
100 MW
expand Northland’s North American portfolio by providing investment
opportunities into the US renewables market
• Well positioned from a competitive standpoint relative to the state’s wind
development pipeline
• USD cash flows from stable and high demand market
• 320 MW potential capacity (Bluestone, Ball Hill and High Bridge) United
• Secured 20-year indexed REC contract (CfD all-in PPA) with with the New York State States
Energy Research and Development Authority
• Achieved financial close on Ball Hill and Bluestone in Q2 2021 and actively
developing Highbridge
Timeline For New York Wind Development
2020 2021 2021 2022 2023
Expected Expected
Acquired Secured 20-year IRec Achieved financial
Commercial Commercial
projects offtake contract close on Ball Hill and
Operations for Ball Operations for
Bluestone
Hill and Bluestone Highbridge Northland Power 25Colombia Onshore Renewables
Helios Solar Project Overview
16 MW
EBSA
• 16 MW Solar project in Colombia Helios
• First development project in Colombia to capitalize on EBSA’s grandfathered
rights, allowing it to expand into the energy generation market in Colombia
• Aim is to service the power needs of non-regulated municipal, commercial
and industrial (C&I) customers
• Secured 12-year Power Purchase Agreement with EBSA
• Achieved financial close in Q2 2021, with first phase (10 MW) achieving COD
in February 2022 Colombia
Timeline For Helios Solar Development
2020 2021 2021 2022
Acquired Achieved Financial Commenced Expected
Projects Close Construction Commercial
Operations
Northland Power 26Colombia Onshore Renewables
Suba Solar Project Overview
130 MW
EBSA
• Secured two solar projects in Colombian renewables auction with a Suba
combined capacity of 130 MW
• Developing in partnership with EDF Renewables through 50/50 joint venture
• Projects underpinned by 15-year Power Purchase Agreements with high
quality Colombian energy distribution and commercial entities
• The PPAs will be denominated in Colombian pesos and will have annual
indexation to the Colombian Producer Price index.
• In addition, the projects will receive a reliability charge in US dollars, which Colombia
will account for approximately 10% of total revenues of the projects.
Timeline For Suba Solar Development
2021 2022 2022 2023
Projects Secured Expected Financial Expected Start of Expected
in Renewables Close Construction Commercial
Auction Operations
Northland Power 27Utilities
High-quality Regulated Utility Business
Regulated utility provides strategic value to
existing asset portfolio
• Sole distributor to a population of over 1.3 million; proven management team
with local expertise
• Operates under regulatory framework with an average approved WACC of
approximately 11.5%
• RAB is expected to grow at a rate in excess of inflation
• Other key regulatory features including RAB inflation indexation, a five-year
planning cycle and limited to no demand risk
• Provides a measure of stability and predictability to Free Cash Flow
• Reduces concentration risk as well as exposure to re-contracting and
merchant power price risk
Northland Power 28Colombia
EBSA Utility
• Provided Northland with a platform to drive future opportunities in
Colombia and Latin America EBSA
• EBSA is one of a few energy companies in Colombia with favourable
grandfathered rights allowing for vertical integration across all segments of
the electricity market
• In addition to the growth in the distribution segment approved by regulators, Headquarters located in
EBSA is able to add additional growth projects in Boyacá to its RAB Tunja, 150 km from Bogota
Key Operating Metrics
COP 1,670 Bn RAB 1.7 TWh
105 Substations (C$ 622M) Energy Distributed
503,000 573 915 MVA
Regulated Clients Full Time Employees 220kV/115kV
Colombia
Regulated revenue subject to revenue cap and five-year tariff
Distribution
review process – No volume risk
Power retailer for 100% of regulated clients in Boyacá and
Commercialization
44% market share of commercialization segment
Operator of 790km of national and regional transmission lines
Transmission
and 18 substations; fixed annual revenue for 25 years
Northland Power 29FINANCIAL OVERVIEW
BBB (Stable)

Long-term financial                                                                      Maintain investment grade balance
                                                                                         sheet to support growth

objectives
                                                                                         $12-15B1 pipeline
                                                                                         Maintain flexibility to fund Capitalized
                                                                                         Projects costs

Maintaining flexibility, adding corporate funding tools to
diversify sources of capital, preserving low cost of capital
and investment grade balance sheet are key to the
                                                                                         7-10% CAGR by 2027
successful growth execution of Northland, to ultimately
                                                                                         Significant growth in adj.
drive growth in FCF/AFCF per share                                                       EBITDA expected on
                                                                                         completion of Capitalized
                                                                                         Growth Projects

 1. Represents the total gross capital costs of the ~3 GW capitalized growth projects.

                                                                                                                          Northland Power   31
Commitment to investment grade credit rating and
continued balance sheet strength
Committed to prudent Corporate Credit Ratings
capital structure and
S&P Fitch
BBB (Stable) BBB Stable
investment grade (since 2013) (since fall 2021)
rating
• Strong financial condition supported by investment grade
ratings
• Growth investments funded
• First with non-recourse debt (65-75%) to match
revenue contract (PPA) life
• With sources of capital selected and sized to maintain
our investment grade credit rating
• Diversified model provides stability to free cash flow
• ~93% of revenues are contracted through long-term PPAs
32Financial Strategy
Disciplined and flexible approach to project funding
• The Company manages its capital strategy with a high degree of selectivity in funding its capitalized
growth projects
• Focused on maintaining an investment grade rating
• Credit facilities support short-term funding needs with borrowings repaid from project financings at
financial close, corporate and/or project-level financing/re-financing optimizations and/or sell downs
at or before financial close
• Free Cash Flow finances growth development expenditures (devex), corporate costs that support
growth and new initiatives
Project Funding • Partial sell-down of ownership interests in certain development assets on or before financial close to
complement existing sources of funding
Northland Equity
Sell-Down Partner Equity • Additional funding sources help improve Northland’s financial flexibility, while supporting the capital
Sell-Down Premium and credit requirements for development projects.
Senior Debt
Green Corporate Hybrids
Northland Power 33Strong Balance Sheet will Support Growth
Illustrative Capital Funding Plan of Capitalized Growth projects Over Next Five Years
Illustrative Funding Plan ~$1-2Bn
~$1Bn NORTHLAND EQUITY2 +
for Capitalized Projects GREEN CORPORATE DEBT (INCLUDING OFFSHORE WIND SELL-DOWNS
REVOLVER/HYBRIDS) ~10-15%
(2022-2026) ~5%
Key takeaways:
• Achievable funding plan given the
$12-15B1
~$1-2Bn
diverse sources of capital available at CURRENT PROJECT
corporate and asset level PARTNER’S EQUITY
~10-15%
• Continuing to diversify our tool kit & ~$9-10Bn
partner prospects to achieve optimal NON-RECOURSE DEBT-
TARGETED GREEN
cost of capital
~65-75%
1. The capital funding plan is based on recent estimates of total capital costs for Capitalized Growth Projects, that Northland has publicly disclosed. The chart illustrates potential sources of funding that is subject to
change/update.
2. Northland intends to fund common equity portion through a combination of cash on hand, proceeds from financings/optimizations of existing facilities and new share issuances
Northland Power 34Sustainable Finance
Adding Financial Optionality to Portfolio
Green Financing allows Northland to diversify and optimize additional
sources of capital to fund growth plan
Green Financings
$1Bn+ Credit Facility with Green Bonds
Targeting all of our project finance debt sustainability linked KPIs
to be green, where possible Up to $1Bn included in 5-year capital
Renewable Energy (%) in Generation plan
Executed first green financing with New Portfolio
York wind projects Prepare to issue inaugural green bond
Carbon intensity of assets or hybrid bond over the next 12-18
Additional green financing for Helios months
solar in Colombia
Northland Power 352022 Financial Guidance
Adjusted EBITDA and Free Cash Flow
Adjusted EBITDA Utilities– 8%
$1.15 to $1.25 Offshore wind – 52%
Billion Efficient natural gas– 16%
2022E
Free Cash Flow (incl. growth expenditures) Adjusted
EBITDA
$1.20 to $1.40 Onshore renewables– 24%
Per Share
Adjusted Free Cash Flow (excl. growth expenditures)
$1.65 to $1.85 The current financial guidance excludes any gains that could be
realized on asset-level sell-downs
Per Share
Northland Power 36Strong annual EBITDA growth
Capitalized Growth Projects will increase EBITDA and Quality of Cash Flow through 2027+
+ Ability for more
$2.0 – 2.2 Bn 2
growth through 6 GW
Additional Pipeline
$1.7 – 1.9 Bn 1
EBITDA
$1.15 - 1.25 Bn
~ 2x
7-10% Capitalized
By 2030
CAGR
+
Other
Capitalized Identified
projects1 Projects2
2022
2021 2027e
2027 2030e
10 year avg. contracted life 14 year avg. contracted life
1. 2027 includes contributions from capitalized growth projects only (Hai Long, Baltic Power, Suba, Nordsee Two and High Bridge)
2. 2030 also includes contributions from identified growth projects (Dado, Chiba, N3 and Delta) in addition to capitalized projects
Northland Power 37Northland’s Competitive Positioning
Northland is well positioned to capitalize on market growth opportunities
Growth Pipeline Moves Toward Financial Close
Global De-carbonization movement is accelerating
Significant growth in renewables expected to offer immense opportunities for
Northland
2.9 GW of development projects will be de-risked over next 24 months
Provides certainty to costs as projects approach financial close
Proven ability to enter new markets and establish competitive position
Established teams in key markets provide local presence to generate growth
opportunities
Capital plan to support growth
Prudent capital strategy with multiple levers to support continued growth of
business
Northland Power 38Looking Forward
Northland’s identified development projects to deliver substantial growth
Total Pipeline
14
Identified Devt
GW
Projects3
9.0+
Capitalized Devt
GW
Projects2
Capacity
6.5
Existing
Projects
GW
>2x
3.2 By 2030
GW1 9%
CAGR
2021 2027e 2030e
2021 2027
1. Based on installed gross capacity and before any potential sell downs
2. 2027 includes contributions from capitalized growth projects only (Hai Long, Baltic Power, Suba, Nordsee Two and High Bridge)
3. 2030 also includes contributions from identified growth projects (Dado, Chiba, N3 and Delta) in addition to capitalized projects Northland Power 39APPENDIX
Shareholder Returns
 Track Record of Strong Returns to Shareholders

                                       An investor who invested in the IPO in 1987 would have realized a total return of
                                                                         over 2,200 %1

 Annual Dividends (Distributions) per share                                                                                     Total Shareholder Returns

                                                                                                                                      Peer Group
                                                                                                               $1.20
                                                                                                                                      S&P/TSX Capped Utilities Index
                                                                                                                                      Northland Power

$0.89

                                                                                                                                                      15%
                                                                                                                                                                                                 14%

                                                                                                                                         5-Year TSR                                10-Year TSR
 1998 1999 2000 2001 2002 2003 2004 2005 2006 2007 2008 2009 2010 2011 2012 2013 2014 2015 2016 2017 2018 2019 2020 2021 YTD
                                                                                                                         2022
                                                                                                                                1.   Canadian IPP Peer Group includes Algonquin Power, Boralex, Brookfield
                                                                                                                                     Renewable, Capital Power, Innergex, and TransAlta.
                                                                                                                                2.   As at May 18, 2022.

 1. As at May 18, 2022 and assumes reinvestment of dividends

                                                                                                                                                                                             Northland Power   41
Market Summary
Key Metrics1
Recent Share Price (TSX: NPI) $38.31
Shares (Common) 231 million
Annual Dividend $1.20
2022 EBITDA Guidance $1.15 – $1.25 Billion
2021 FCF/sh Guidance $1.20 – $1.40
2021 Adjusted FCF/sh Guidance $1.65 - $1.85
Total Debt, Net of Cash2 $6.0 billion
Preferred Shares (NPI.PR.A, NPI.PR.B, NPI.PR.C) $236 million
Market Capitalization (Common) $8.9 billion
Enterprise Value $14.3 billion
Credit Rating (S&P)3 BBB Stable
Fitch Rating4 BBB Stable
1. Market data as at June 2, 2022 unless stated otherwise.
2. As at March 31, 2022
3. Reaffirmed in March 2022
4. Received in September 2021
Northland Power 42European Offshore Wind
Facility Details
Gemini Nordsee One Deutsche Bucht
Capacity 600 MW 332 MW 252 MW
Distance to Shore 85km 40km 95km
Wind Turbines 150 x Siemens 4 MW 54 Senvion x 6.15 MW 31 x MHI Vestas 8MW
Turbine Foundation Monopile Monopile Monopile
Water Depth 28m to 36m 26m to 29m 39m to 41m
Total Project Costs €2.8 Billion €1.2 Billion €1.5 Billion
Contract for Differences (CFD)
Revenue Contract Type Feed in tariff Feed in tariff
(FiT-Type)
Revenue Contract Term 15 years ~10 years ~13 years
€194/MWh for 8 years, €184/MWh for 8 years,
~€169/MWh
Revenue Contract Price €154/MWh for 1.5 years €149/MWh for 4.7 years
[No escalation]
[No escalation] [No escalation]
Gemini responsible for connection to Tennet responsible for connection to Tennet responsible for connection to
Grid Connection Responsibility
shore shore shore
NPI Ownership 60% 85% 100%
Northland Power 43Northland’s Operating Assets
On-time and on-schedule project execution
Construction
Expiry PPA (On-time/on-
Project Technology Location Gross Capacity Ownership Term budget)
Gemini Offshore Wind Netherlands 600 MW 60% 2032 ✓
Nordsee One Offshore Wind Germany 332 MW 85% 2027 ✓
Deutsche Bucht Offshore Wind Netherlands 252 MW 100% 2031 ✓ (Base Plant)
Mont Louis Onshore Wind QC, CA 100 MW 100% 2031 ✓
Jardin d’Éole Onshore Wind QC, CA 134 MW 100% 2029 ✓
McLean’s Mountain Onshore Wind ON, CA 60 MW 50% 2034 ✓
Grand Bend Onshore Wind ON, CA 100 MW 50% 2036 ✓
100% (90 MW) ✓
Ground-Mount Solar Solar ON, CA 130 MW 2033-2035
63% (40 MW)
Thorold Efficient Natural Gas ON, CA 265 MW 100% 2030 ✓
Spy Hill Efficient Natural Gas SK, CA 86 MW 100% 2036 ✓
North Battleford Efficient Natural Gas SK, CA 260 MW 100% 2033 ✓
Kirkland Lake Efficient Natural Gas ON, CA 132 MW 87%¹ 2030 ✓
EBSA Regulated Distribution Utility Colombia n/a 99% Perpetual n/a
Onshore Wind/Solar/Concentrated
Spain Portfolio2 Spain 560 MW 99% 2031 n/a
Solar Power
1. Northland has an effective 87% residual economic interest
2. Closed August 11, 2021
AP P E ND IX Northland Power 44Project Pipeline
Nearly 8 GW of capitalized and identified projects to support growth to 2030
Northland Current
Project Location Technology Size Status Contract Type Est. COD
Ownership
Capitalized Growth Projects
Hai Long Taiwan Offshore Wind 1,044MW 60% Late-Stage Development 20-yr PPA 2026/2027
Baltic Power Poland Offshore Wind Up to 1,200MW 49% Mid/Late –Stage development 20-yr PPA 2026
Nordsee Two Germany Offshore Wind 433MW 49% Mid–Stage development TBD 2026
Suba Colombia Solar 130MW 50% Late-Stage Development 15-yr PPA 2023
Highbridge United States Onshore Wind 100MW 100% Mid/Late –Stage development 20-yr PPA 2023
Total Capitalized Growth Projects 2,907 MW
Identified Projects
Nordsee Three Germany Offshore Wind 420MW 49% Mid-Stage Development
Nordsee Delta Germany Offshore Wind 480MW 49% Mid-Stage Development
Chiba Japan Offshore Wind 600MW 50% Early/Mid-Stage Development
COD 2027 – 2030+
Dado South Korea Offshore Wind Up to 1000MW 100% Early/Mid-Stage Development
Scotwind Scotland Offshore Wind 2340MW 100% Early-Stage Development
Hecate Canada Offshore Wind 400MW 100% Early-Stage Development
Total Identified Projects 5,240MW
Additional Pipeline
Various ~5,900MW Early-Stage Development
Total Pipeline (Capitalized + Identified + Additional) ~14,000MW
Northland Power 45Onshore Renewables
Our onshore business continues to grow to supplement growth in offshore wind
Project Technology Size Status COD
Our onshore strategy will Spain Solar and wind 551MW Operational
provide nearly 1.2 GW of
La Lucha Solar 130MW Construction 2022
near-term growth to
complement growth from Ball Hill and Bluestone Wind 220MW Construction 2022
our offshore wind portfolio High Bridge Wind 100MW Development 2023
Helios Solar 16MW Construction 2022
Suba Solar 130MW Development 2023
1,147MW
Northland Power 46Forward looking statement
This written and accompanying oral presentation contains certain forward-looking statements which are provided for the purpose of presenting information about management’s current
expectations and plans. Readers are cautioned that such statements may not be appropriate for other purposes. Northland’s actual results could differ materially from those expressed in, or implied
by, these forward-looking statements, and accordingly, no assurances can be given that any of the events anticipated by the forward-looking statements will transpire or occur. Forward-looking
statements are predictive in nature, depend upon or refer to future events or conditions, or include words such as “expects”, “anticipates”, “plans”, “predicts”, “believes”, “estimates”, “intends”,
“targets”, “projects”, “forecasts” or negative versions thereof and other similar expressions or future or conditional verbs such as “may”, “will”, “should”, “would” and “could”.
These statements may include, without limitation, statements regarding future adjusted EBITDA, free cash flow, adjusted free cash flow, dividend payments and dividend payout ratios; the
construction, completion, attainment of commercial operations, cost and output of development projects; litigation claims; plans for raising capital; and the future operations, business, financial
condition, financial results, priorities, ongoing objectives, strategies and outlook of Northland and its subsidiaries. These statements are based upon certain material factors or assumptions that
were applied in developing the forward-looking statements, including the design specifications of development projects, the provisions of contracts to which Northland or a subsidiary is a party,
management’s current plans and its perception of historical trends, current conditions and expected future developments, as well as other factors that are believed to be appropriate in the
circumstances.
This presentation contains forward-looking statements and information, within the meaning of Canadian securities laws and in any applicable Canadian securities regulations, concerning the
business and operations of Northland Power Inc. Forward-looking statements may include estimates, plans, expectations, opinions, forecasts, projections, guidance or other statements that are not
statements of fact. Forward-looking statements in this presentation include statements regarding the quality of Northland’s assets and the resiliency of the cash flow they will generate, Northland’s
anticipated financial performance and payout ratio, future commissioning of assets and expected returns from such assets, technology diversification, acquisition opportunities, expected
completion of acquisitions, contract, contract counterparties, operating performance, variability of renewable resources and climate change, offshore wind concentration risk, market power prices,
fuel supply, transportation and price, operations and maintenance, permitting, construction, development prospects and advanced stage development, financing and refinancing opportunities,
certain information regarding the company’s expected cash flow profile and liquidity, , liquidity, credit rating, currency fluctuations, variability of cash flows and potential impact on dividends, taxes,
natural events, environmental, health and safety, government regulations and policy, international activities, relationship with stakeholders, reliance on information technology, reliance on third
parties, labour relations, insurance, co-ownership, bribery and corruption, legal contingencies, future energy prices and demand for electricity, economic recovery, project development and capital
expenditure costs, energy policies, economic growth, growth potential of the renewable asset class, the future growth prospects and distribution profile of Northland Power and its access to capital
and the other factors described in Northland’s 2021 Annual Report and 2021 Annual Information Form, which are both filed electronically at www.sedar.com and Northland’s website
www.northlandpower.com.
All figures are presented in Canadian dollars unless otherwise indicated. Unless otherwise indicated, the statistical and financial data in this presentation is presented as of June 2, 2022.
Northland Power 47Reporting of Non-IFRS Financial Measures
This investor presentation includes references to Northland’s adjusted EBITDA and free cash flow, measures not prescribed by International Financial Reporting Standards (IFRS). Adjusted EBITDA and free
cash flow, as presented, may not be comparable to other similarly-titled measures presented by other publicly-traded companies, as these measures do not have a standardized meaning under IFRS. These
measures should not be considered in isolation or as alternatives to net income, cash flow from operating activities or other measures of financial performance calculated in accordance with IFRS. These
measures are also not necessarily indicative of operating income or cash flows from operating activities as determined under IFRS. Rather, these measures are provided to complement IFRS measures in the
analysis of Northland’s results of operations and are used by management to evaluate the performance of the company for internal assessment purposes. Management believes that adjusted EBITDA and
free cash flow are widely-accepted financial indicators used by investors to assess the performance of a company. These measures provide investors with additional information to assist them in
understanding these critical components of the company’s financial performance, including its ability to generate cash through its current operations. These measures have been applied consistently for all
periods presented in this document.
Adjusted EBITDA
Adjusted EBITDA provides investors with an indication of Northland’s capacity to generate income from operations and investments before taking into account management’s financing decisions and the
costs of consuming tangible and intangible capital assets, which vary according to asset type and management’s estimate of their useful lives.
Adjusted EBITDA is calculated as income (loss) before income taxes adjusted for depreciation of property, plant and equipment, amortization of contracts and other intangible assets, net finance costs,
Gemini subordinated debt earned by Northland, fair value losses (gains) on derivative contracts, unrealized foreign exchange losses (gains), elimination of non-controlling interests and finance lease and
equity accounting.
Free cash flow
Free cash flow is calculated as cash flow provided by operating activities adjusted for net change in non-cash working capital balances, capital expenditures, interest paid, scheduled principal repayments on
term loans, funds set aside for scheduled principal repayments and for asset purchases, restricted cash (funding) for major maintenance, write-off of deferred development costs, consolidation of managed
facilities, income from equity accounted investments, proceeds from sale of assets, and preferred share dividends. This measure, along with cash flow provided by operating activities, is considered to be a
key indicator for investors to understand Northland’s ability to generate cash flow from its current operations.
Adjusted Free Cash Flow
Commencing with the 2020 Annual Report, Northland introduced Adjusted Free Cash Flow, a supplementary non-IFRS Free Cash Flow measure, and associated per share amounts and payout ratios. Adjusted
Free Cash Flow is calculated by excluding growth-related expenditures from Free Cash Flow. Management believes this measure provides a relevant presentation of cash flow generated from the business
before investment-related decisions (refer to Section 4.3: Growth Expenditures for additional information). Management believes Adjusted Free Cash Flow is a meaningful measure of Northland’s ability to
generate cash flow, after on-going obligations, to reinvest in growth and fund dividend payments. The Free Cash Flow and adjusted payout ratios, calculated using Free Cash Flow and Adjusted Free Cash
Flow, respectively, demonstrate the proportion of the respective measure paid as dividends, whether in cash, or in shares under Northland’s dividend reinvestment plan (DRIP). The net payout ratios indicate
the proportion of Free Cash Flow paid as cash dividends. The payout ratios generally reflect Northland’s ability to fund growth-related expenditures and sustain dividends.
Readers should refer to our MD&As accompanying our financial statements for an explanation of adjusted EBITDA and free cash flow, and for a reconciliation of Northland’s reported adjusted EBITDA to its
consolidated income (loss) before taxes and a reconciliation of Northland’s free cash flow to its cash provided by operating activities. These are filed from time to time on our company’s website
www.northlandpower.com
Northland Power 48Northland Power Wassem Khalil Email: investorrelations@northlandpower.com 30 St. Clair Avenue West, Senior Director Investor Relations & Strategy 12th Floor 647.288.1019 Website: northlandpower.com Toronto, ON Canada M4V 3A1
You can also read