Field multi omics analysis reveals a close association between bacterial communities and mineral properties in the soybean rhizosphere
←
→
Page content transcription
If your browser does not render page correctly, please read the page content below
www.nature.com/scientificreports
OPEN Field multi‑omics analysis
reveals a close association
between bacterial communities
and mineral properties
in the soybean rhizosphere
Shinichi Yamazaki1,6, Hossein Mardani‑korrani2,6, Rumi Kaida2,6, Kumiko Ochiai3,
Masaru Kobayashi3, Atsushi J. Nagano4, Yoshiharu Fujii2, Akifumi Sugiyama5 & Yuichi Aoki1*
The plant root-associated environments such as the rhizosphere, rhizoplane, and endosphere are
different from the outer soil region (bulk soil). They establish characteristic conditions including
microbiota, metabolites, and minerals, and they can directly affect plant growth and development.
However, comprehensive insights into those characteristic environments, especially the rhizosphere,
and molecular mechanisms of their formation are not well understood. In the present study, we
investigated the spatiotemporal dynamics of the root-associated environment in actual field
conditions by multi-omics analyses (mineral, microbiome, and transcriptome) of soybean plants.
Mineral and microbiome analyses demonstrated a characteristic rhizosphere environment in which
most of the minerals were highly accumulated and bacterial communities were distinct from those in
the bulk soil. Mantel’s test and co-abundance network analysis revealed that characteristic community
structures and dominant bacterial taxa in the rhizosphere significantly interact with mineral contents
in the rhizosphere, but not in the bulk soil. Our field multi-omics analysis suggests a rhizosphere-
specific close association between the microbiota and mineral environment.
Plants cannot autonomously move from their planting place, so they must take up almost all essential nutrients
for growth and development via their roots from the soil. Most mineral nutrients contained in the soil, how-
ever, are not in an accessible or available form to plants. For instance, 90% of soil nitrogen in a forest ecosystem
is contained in organic matter1 such as proteins and humus2,3, which cannot be utilized by plants as they are.
Soil microbes therefore play essential roles in the chemical transformation of the unavailable nitrogen into its
available, inorganic form (mineralization)4, and they also facilitate solubilization of other nutrients including
phosphate, potassium, and i ron5–7. Plants themselves can solubilize soil minerals by exudation of organic a cid8
and can communicate with soil microbes by secretion of organic compounds9. This means that plants interact
with soil via microbes and metabolites.
The plant root-associated environments such as the rhizosphere, rhizoplane, and endosphere are quite dif-
ferent from the outer soil region known as bulk soil. Of these, the rhizosphere, an interface region between
plant roots and bulk soil, is defined as the soil that is directly influenced by r oots10,11. Many studies describe its
characteristic environment in terms of microbiota, metabolites, and minerals. Previous studies show that plants
release significant amounts of organic matter, accounting for more than 10% of photosynthetic products, from
their roots into the s oil12. Such richness of carbon in the rhizosphere stimulates the propagation of soil microbes,
making the rhizosphere a microbial hotspot as one of the most dynamic habitats on e arth13,14. Plant roots also
secrete a variety of secondary metabolites including bioactive flavonoids into the rhizosphere. In legumes, fla-
vonoids play a central role in communication with symbiotic nitrogen-fixing r hizobia15 and act as antimicrobial
1
Tohoku Medical Megabank Organization, Tohoku University, Sendai, Japan. 2Department of International
Environmental and Agricultural Science, Tokyo University of Agriculture and Technology, Fuchu, Japan. 3Division
of Applied Life Sciences, Graduate School of Agriculture, Kyoto University, Kyoto, Japan. 4Faculty of Agriculture,
Ryukoku University, Otsu, Japan. 5Research Institute for Sustainable Humanosphere, Kyoto University, Gokasho,
Uji, Japan. 6These authors contributed equally: Shinichi Yamazaki, Hossein Mardani-korrani, Rumi Kaida. *email:
aokibluetree@gmail.com
Scientific Reports | (2021) 11:8878 | https://doi.org/10.1038/s41598-021-87384-8 1
Vol.:(0123456789)
www.nature.com/scientificreports/
substances, phytoalexins, to inhibit root p athogens16,17. A recent study also revealed that an isoflavone, daidzein,
secreted from soybean (Glycine max) roots was involved in shaping the rhizosphere bacterial community18. Thus,
as shown in many studies, the microbial community structure of the rhizosphere is distinct from that in the bulk
soil. In addition, under identical soil conditions, different plant species and cultivars shape different community
structures in the r hizosphere19,20, suggesting that plants actively modify rhizosphere microbial communities in
a genotype-specific manner, probably through secretion of m etabolites21. Water and mineral concentrations are
also influenced by plant uptake in the rhizosphere. Previous studies showed that some nutrient concentrations
such as nitrogen, phosphorus, and potassium exhibit decreasing gradients between the bulk soil and the root
surface22,23. By contrast, some excess elements such as calcium, magnesium, and iron accumulate around the
root if their uptake is lower than the supply from mass fl ow24–26. In addition, the availability of minerals in the
rhizosphere is also affected by microbial activity. These characteristic biological and chemical environments in
the root-associated compartments can directly affect the plant growth and may reflect the physiological state of
the host plant. Therefore, a comprehensive understanding of those environments is important for healthy plant
growth and sustainable crop production, especially under environmental changes.
However, the root-associated environments have been independently characterized by their respective aspects
of minerals, microbiota, and metabolites. The extent of the effect is variable depending on each biological and
chemical factor and environmental condition. Furthermore, each factor is interacted with and affected by host
plant activity. Such variable interactions between each component make it more complex; thus, holistic insight
into the root-associated environments and molecular mechanisms of their formation need to be understood by
the integration of diverse omics data. For an instance, a recent report demonstrates that multi-comics analysis
can find key component to increase crop production on an a groecosystem27. It also remains unclear how a change
in the rhizosphere caused by environmental perturbation affects plant growth and crop production.
In the present study, we performed a field cultivation experiment of soybeans with an application of cover
crops, hairy vetch (Vicia villosa), as an environmental perturbation factor. Hairy vetch is a leguminous plant
agriculturally used to improve soil fertility28,29 and produces allelochemicals to affect the surrounding envi-
ronment. To gain a comprehensive insight into the root-associated environments, especially the interaction
between biological and chemical components, in an actual field condition, we performed a time-series analysis
of mineral composition in the rhizosphere, root-associated microbiome, and transcriptome of soybean plants.
Cross-sectional analysis of those multi-omics data and analysis of spatiotemporal dynamics of respective factors
revealed a significant interaction between the characteristic bacterial community and the mineral environment
in the rhizosphere.
Results
Hairy vetch applications had a limited beneficial effect on soybean growth. We began a cultiva-
tion experiment of soybeans in a field at the beginning of June, and we regularly measured growth parameters
such as plant height, number of nodes and branches, and soil plant analysis development (SPAD) from 4 to
11 weeks after planting (WAP; Fig. 1). The dry weights of shoots and roots were also measured after sampling
of the rhizosphere (Supplementary Fig. S1). Soybean growth was slightly enhanced by the application of hairy
vetch (HV). Plant height with HV application was slightly higher than that of the control plants at middle and
later growth stages, and SPAD values with HV were also higher than those of the control (Fig. 1). However, the
difference was limited, and other growth indexes including the dry weight of plants were not significantly differ-
ent (Fig. 1, Supplementary Fig. S1).
Mineral contents in the soybean rhizosphere and bulk soil. We then analyzed the concentrations
of mineral nutrients in the rhizosphere and bulk soil at 4, 6, 8, and 11 WAP, corresponding with vegetative
(V)2, reproductive (R)1, R2, and R5 stages of soybean development, respectively. Using a small-scale protocol
of mineral analysis for rhizosphere soil30, we measured the composition of principal macronutrients for plants:
total C, total N, C/N ratio, available N, inorganic N (NH4-N and NO3-N), available P, cation exchange capacity
(CEC), and exchangeable bases (K, Ca, and Mg). Most of the mineral contents in the rhizosphere soil were more
abundant than those in the bulk soil; inorganic N and exchangeable K especially accumulated at high levels in
the rhizosphere soils (Fig. 2). By contrast, available P was not significantly different between the soil regions at
any of the time point tested (Fig. 2). Principal component analysis (PCA) of mineral contents showed that bulk
soil and rhizosphere soil were discriminated by the first principal component (PC1; Supplementary Fig. S2a),
and exchangeable K, total N, and N H4-N were the factors with large loading in PC1 (0.969, 0.956, and 0.943,
respectively; Supplementary Fig. S3).
The NO3-N content in the HV-treated bulk soil was significantly higher than that of the control bulk soil,
and NO3-N in the rhizosphere soils also exhibited a similar tendency between treatment groups (Supplementary
Figs. S4, S5). Besides, CEC in the bulk soil was significantly different between treatments, but consistent trend
was not observed during cultivation (Supplementary Fig. S4). No other mineral contents were significantly
affected by HV application.
Transcriptome analysis of the soybean leaf and root. We performed RNA-seq analysis of the leaves
and roots of soybean plants collected on the same day of the rhizosphere sampling. Of the 56,044 genes in the
Glyma v2.0 (Wm82.a2.v1) genome annotation, a total of 49,630 transcripts were detected in at least one sample.
PCA for those data demonstrated that the gene expression profiles were clearly distinguished between the tissues
and among plant growth stages (Supplementary Fig. S2b). Notably, one sample of the root at 4 WAP was distinct
from the other root samples in the PCA plot (Supplementary Fig. S2b), probably because its quality of reads was
very low; thus, we removed this root sample from subsequent analysis.
Scientific Reports | (2021) 11:8878 | https://doi.org/10.1038/s41598-021-87384-8 2
Vol:.(1234567890)
www.nature.com/scientificreports/
Figure 1. Growth indexes of soybean plants. Values are expressed as means ± SD (n = 5). Asterisks (*) show
significant differences between the control plots and HV plots (p < 0.05, t-test). HV, hairy vetch; SPAD, soil plant
analysis development.
Differentially expressed genes (DEGs) under HV treatment were examined, and 337 DEGs were found in
the leaf at 11 WAP, of which 165 genes were upregulated and 172 genes were downregulated under HV treat-
ment (Additional file 1). We performed gene ontology (GO) enrichment analysis for these DEGs, but reasonable
biological insight into the effect of HV treatment was not identified. In the other growth stages, only a few DEGs
were detected. Thus, the effect of HV application on plant physiological status was limited.
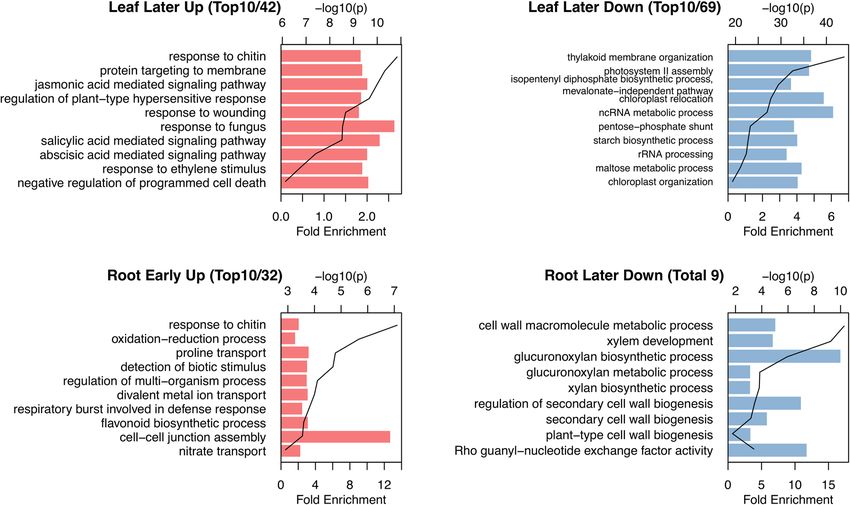
To examine gene expression profiles during the development of soybean plants in field conditions, we com-
pared the DEGs between different growth stages in our field data with previously reported laboratory-scale data31.
The previous study characterized gene expression patterns by GO enrichment analysis among leaf developmental
stages of soybean plants grown in pots in a growth chamber from V3 stage to the reproductive s tage31, which
corresponded to our sampling schedule in the field. The whole data of the GO enrichment analysis are shown in
Additional file 2 and parts of these are listed in Fig. 3. In our field data, the genes associated with photosynthesis
were downregulated, and those associated with responses to chitin and fungus were upregulated in the leaves
at a later reproductive stage between 8 and 11 WAP (Fig. 3); these findings were consistent with the laboratory-
scale data31. By contrast, expression patterns specific to the field were also observed. The genes associated with
the signaling pathway mediated by jasmonic acid, salicylic acid, and abscisic acid were upregulated in the leaves
between 8 and 11 WAP (Fig. 3), whereas these were not detected in the previous laboratory study. Gene expres-
sion patterns in the roots were quite different from those in the leaves. The GO terms of “divalent metal ion
transport,” “nitrate transport,” and “cellular cation homeostasis” were enriched in the roots at the vegetative
stage between 4 and 6 WAP (Fig. 3), indicating that the young seedlings actively took up mineral nutrients. At
the later reproductive stage between 8 and 11 WAP, the genes associated with the cell wall biosynthetic process
were significantly downregulated in the roots.
Microbiome analysis of the root‑associated bacteria. To examine the profile of root-associated
microbiota during plant development in the field, we analyzed the bacterial communities at the four root-associ-
ated compartments: bulk soil, rhizosphere, rhizoplane, and endosphere. After processing sequences by QIIME2
and removing chloroplastic and mitochondrial sequences, a total of 16,133,383 reads were obtained with the
range of 52,780–321,718 reads per sample, representing 28,370 amplicon sequence variants (ASVs). The ASV
datasets were normalized by rarefaction to 50,000 reads per sample for diversity analysis. Measures of α-diversity
represented by the number of observed ASVs and the Shannon index demonstrated that the diversity of bac-
terial communities gradually decreased from the bulk soil to the endosphere at 4 WAP, the initial vegetative
Scientific Reports | (2021) 11:8878 | https://doi.org/10.1038/s41598-021-87384-8 3
Vol.:(0123456789)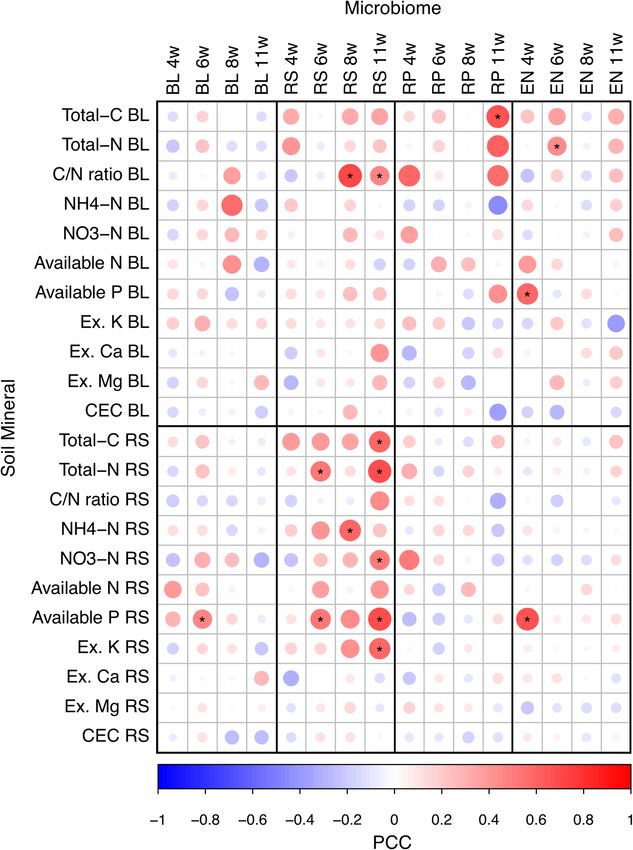
www.nature.com/scientificreports/
Figure 2. Mineral contents in bulk soil and rhizosphere soil of field-grown soybean plants. Values are expressed
as means ± SD (n = 10). Asterisks (*) show significant differences between the bulk and rhizosphere soil (p < 0.05,
t-test). CEC, cation exchange capacity; Ex, exchangeable.
stage (Fig. 4). This diversity gradient was also observed in other plants such as tomato and rice32,33. Although
the diversity of bacterial communities in the rhizoplane was temporally decreased during plant development,
that in the endosphere was increased; accordingly, the diversity gradient was reversed between the rhizoplane
and endosphere at 11WAP, the later reproductive stage (Fig. 4). The diversity of bacterial communities in the
endosphere tended to be increased by the application of HV (Supplementary Fig. S6), but it was not statistically
significant.
To investigate the similarities of bacterial communities among different compartments and different growth
stages, we performed the principal coordinate analysis (PCoA) of weighted and unweighted UniFrac (WUF
and UUF) distances. WUF PCoA plots of all samples demonstrated that the quantitative community structure
was separated by different compartments; specifically, that in the endosphere was most distinct from those in
the outside of the roots (Fig. 5a). UUF PCoA plots showed that the qualitative community structure was also
separated by compartments, and it could be clearly distinguished into three groups: rhizoplane, endosphere,
and others (Fig. 5b). The permutational multivariate analysis of variance (PERMANOVA) based on WUF and
UUF distances demonstrated that both community structures were significantly different among compartments
(WUF, R2 = 0.616, p < 0.001; UUF, R2 = 0.290, p < 0.001). In comparison among growth stages, the community
structures based on WUF in the rhizosphere, rhizoplane, and endosphere clearly changed during plant devel-
opment (Supplementary Fig. S7). PERMANOVA confirmed that the community structures were significantly
separated by growth stage (Rhizosphere, R 2 = 0.459, p < 0.001; Rhizoplane, R2 = 0.524, p < 0.001; Endosphere,
R = 0.799, p < 0.001), but that in the bulk soil did not dramatically changed ( R2 = 0.153, p = 0.012). Dissimilarity
2
represented by WUF distances to 4 WAP, the initial vegetative stage, also showed that the community structures
in the rhizosphere, rhizoplane, and endosphere significantly shifted in a time-dependent manner (Supplementary
Fig. S8). WUF PCoA plot at 4 WAP demonstrated that the community structures were not clearly separated
between the bulk soil and rhizosphere (Fig. 6a), but that at 11 WAP, the later reproductive stage, showed clear
separation between them (Fig. 6b). Although PERMANOVA described the community structures in the bulk
soil and rhizosphere were significantly different at both 4 and 11 WAP (4 WAP, p = 0.002; 11 WAP, p = 0.0012;
Additional file 3), those in the rhizosphere changed more drastically during plant development than those in the
bulk soil (Fig. 6c) and dissimilarity between the bulk soil and rhizosphere was significantly higher at the later
reproductive stage than at the initial vegetative stage (Fig. 6d).
Scientific Reports | (2021) 11:8878 | https://doi.org/10.1038/s41598-021-87384-8 4
Vol:.(1234567890)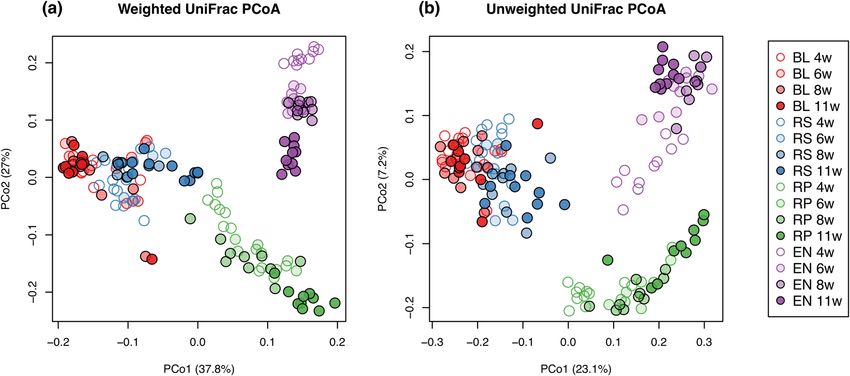
www.nature.com/scientificreports/
Figure 3. Gene ontology enrichment analysis of differential expression genes at early or later growth stage
in the leaf and root. Gene expression profiles were classified into six patterns; significant increase or decrease
(FDR < 0.05; fold change ≥ 2) only between 4 and 6 WAP (early stage), 6 and 8 WAP (mid stage), or 8 and 11
WAP (later stage) and no significant difference at the other stage. GO enrichment analysis was carried out using
the Soybase GO term enrichment tool (https://www.soybase.org). GO, gene ontology; FDR, false discovery rate;
WAP, weeks after planting.
Figure 4. Alpha diversity of root-associated bacterial communities at different growth stages of field-grown
soybean plants. Boxes showing different letters above them are significantly different among different growth
stages (p < 0.05, Kruskal–Wallis test with Benjamini–Hochberg method).
Bacterial communities in HV-treated plants were not significantly different from their controls for any growth
stages or compartments (Supplementary Fig. S9; PERMANOVA, p > 0.1; Additional file 3), suggesting that the
application of HV had little effect on the root-associated bacterial communities.
Phyla distributions and their temporal changes were notably different among the root-associated compart-
ments (Fig. 7a). In the bulk soil, the three most abundant phyla were Proteobacteria, Acidobacteria, and Actino-
bacteria, and there were no temporal changes in the distribution of these phyla. In the rhizosphere, Proteobacteria
was the most abundant phylum, but the relative abundance of Acidobacteria temporally decreased, and that of
Bacteroidetes gradually increased. The rhizoplane had a greater proportion of Proteobacteria than the other
compartments, and it exhibited temporal decreases in Acidobacteria and Actinobacteria and a temporal increase
in Bacteroidetes. In the endosphere, the three most abundant phyla were Actinobacteria, Proteobacteria, and
Scientific Reports | (2021) 11:8878 | https://doi.org/10.1038/s41598-021-87384-8 5
Vol.:(0123456789)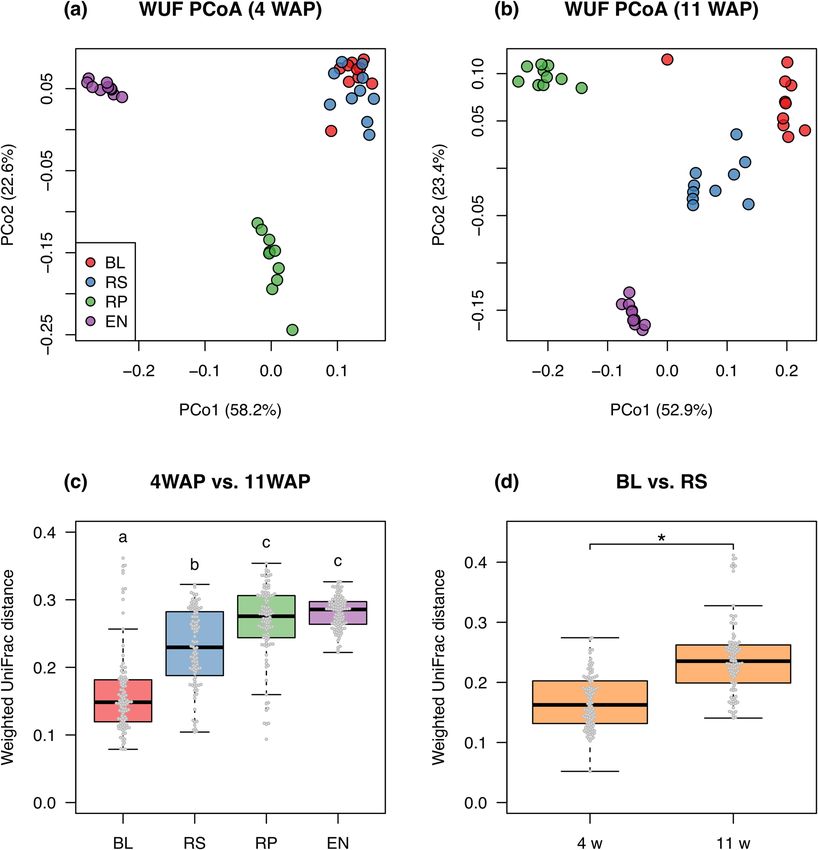
www.nature.com/scientificreports/
Figure 5. Principal coordinate analysis of weighted and unweighted UniFrac distance among all samples. BL,
bulk soil; RS, rhizosphere; RP, rhizoplane; EN, endosphere.
Bacteroidetes, and the proportions of Actinobacteria and Bacteroidetes were gradually decreased and that of
Proteobacteria was increased.
Distributions of top 15 dominant taxa at family level were shown in Fig. 7b, and those of top 100 taxa in
Supplementary Fig. S10. We performed the differential abundant analysis between the bulk soil and rhizosphere
at 11 WAP (Additional file 4). Forty-six taxa were enriched and 13 taxa were depleted in the rhizosphere (Sup-
plementary Fig. S11). Of dominant taxa, eight bacterial taxa including Pseudonocardiaceae (Actinobacteria),
Streptomycetaceae (Actinobacteria), Streptosporangiaceae (Actinobacteria), Chitinophagaceae (Bacteroidetes),
Rhizobiaceae (Proteobacteria), Xanthobacteraceae (Proteobacteria), Burkholderiaceae (Proteobacteria), and
Enterobacteriaceae (Proteobacteria) were significantly more abundant in the rhizosphere than in the bulk soil
at the later reproductive stage (Fig. 7b, Supplementary Fig. S12).
Integrated analysis of soil minerals, microbiome, and transcriptome. To investigate the rela-
tionships between bacterial communities and environmental factors in the rhizosphere, we used Mantel’s test
to compare the WUF distance of bacterial communities with the Euclidian distance of soil mineral contents
(Fig. 8). Notably, at 11 WAP in the rhizosphere, several mineral factors such as total C, total N, N O3-N, avail-
able P, and exchangeable K had significant correlations with the bacterial communities. By contrast, bacterial
communities in other compartments showed only few or no correlations with environmental factors in the bulk
soil and rhizosphere. This indicated that the bacterial community and mineral environments interact with each
other, especially in the rhizosphere.
Mantel’s test was also performed for the correlation matrix of plant transcriptome and the Euclidian dis-
tance of soil mineral contents (Supplementary Fig. S13). However, only a few mineral factors in the rhizosphere
were significantly correlated with gene expression profiles. To evaluate the plant physiological response to the
field environment, we examined the correlation between gene expression in the soybean and mineral con-
tents in the soil. Expression of nitrogen-responsive genes such as glutamine synthetase (GS; Glyma.11g215500,
Glyma.18g041100), nitrate reductase (NR; Glyma.06g109200, Glyma.13g084000), and nitrate transporter (NRT;
Glyma.05g042200, Glyma.11g195200) were positively correlated with the content of inorganic nitrogen such as
NH4-N and NO3-N in the bulk soil (Fig. 9, Supplementary Fig. S14) during 6 to 11 WAP, but not in the rhizo-
sphere soil (Supplementary Figs. S15, S16). Gene expression levels at 4 WAP were relatively low and did not
show a significant correlation, probably because of its small plant body. This result suggests that the mineral
environment in the bulk soil affected the physiological status in the soybean plants.
We constructed a co-abundant network among minerals and microbial taxa at the family level in each root-
associated compartment. To extract robust relationships during plant development, the network figures in four
growth stages were merged, and the intersection of the networks at all growth stages was shown in Fig. 10. The
microbial taxa in each compartment were highly clustered, and five modules in the network were found based on
the fast greedy modularity optimization a lgorithm34. Each module almost corresponded to each compartment,
and microbial taxa in the rhizosphere formed two modules, Module 2 and Module 3 (Fig. 10a; Additional file 5).
In the Module 2, we found that the minerals such as total C, total N, NH4-N, NO3-N, available N, available P, and
exchangeable K in the rhizosphere were correlated with the microbial taxa in the rhizosphere (Fig. 10b), but not
in the bulk soil in the Module 1. Relative abundance of the taxa composing the Module 2 gradually increased in
the rhizosphere during plant development (Fig. 10c), contrasting to the gradual decrease of the taxa belonging to
the Module 3, that was not connected to any minerals (Fig. 10d). These results are consistent with the significant
relationship between the bacterial communities and the mineral contents in the rhizosphere as shown in Fig. 8,
and it also suggests that the bacteria and the minerals in the rhizosphere are closely interrelated with each other
during plant development.
Scientific Reports | (2021) 11:8878 | https://doi.org/10.1038/s41598-021-87384-8 6
Vol:.(1234567890)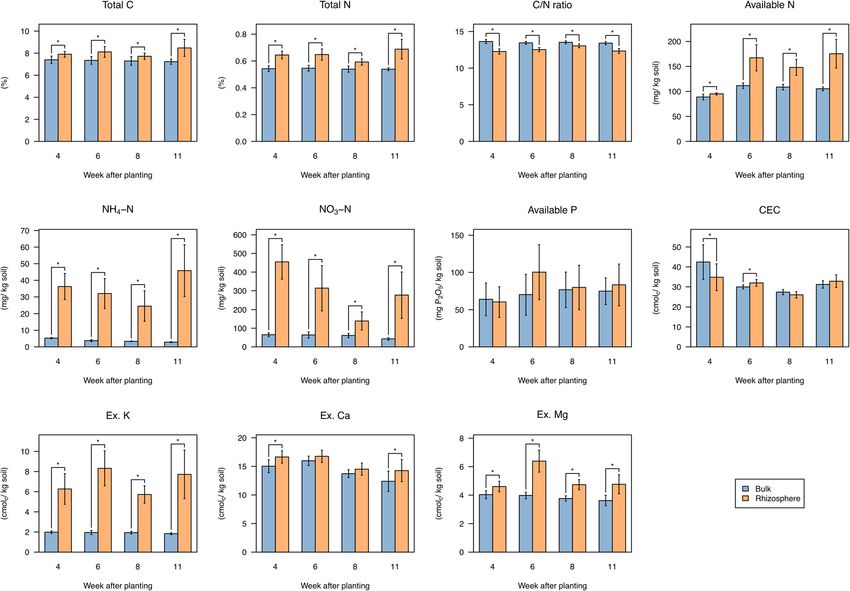
www.nature.com/scientificreports/
Figure 6. Dissimilarity of bacterial communities between the initial vegetative stage and later reproductive
stage. (a,b) PCoA plots of WUF distance matrices at 4 and 11 WAP, respectively. (c) Boxplot of WUF distances
between 4 and 11 WAP at each compartment. Different letters above boxes indicate significant differences
among different compartments (p < 0.05, Wilcoxon rank-sum test with the Bonferroni correction). (d) Boxplot
of WUF distances between the bulk soil and rhizosphere at 4 and 11 WAP. Asterisk (*) shows significant
difference (p < 0.05, Wilcoxon rank-sum test). PCoA, principal coordinate analysis; WAP, weeks after planting;
WUF, weighted UniFrac; BL, bulk soil; RS, rhizosphere; RP, rhizoplane; EN, endosphere.
Discussion
The root-associated environments are an important soil region that directly affects plant growth and crop produc-
tion and reflects the host plant’s status. Many studies have performed the characterization of those environments
on the individual aspects of biological and chemical properties. However, for a comprehensive understanding
of the root-associated environments, the integration of multiple layers of data is needed. In the present study,
we performed a multi-omics analysis of the root-associated environments of soybean grown in the field and
analyzed the interaction between biological and chemical components.
Our field experiment was designed to explore the effect of HV application on the rhizosphere environ-
ment including microbiota and mineral nutrients as well as the effect on the soybean physiological states. HV
is a leguminous cover crop that improves soil properties and increases crop p roduction28,29, and it also has an
35–37
allelopathic activity . Allelochemicals derived from allelopathic plants have effects not only on surround-
ing plants but also on soil microbial populations and c ommunities38,39. We therefore expected HV to affect the
rhizosphere environment. An increase in NO3-N content in the bulk soil and slight promotion of soybean growth
with HV application (Fig. 1, Supplementary Fig. S4) indicated that HV indeed improved soil fertility in our field
experiment. However, we observed almost no effects on the root-associated microbiome and gene expression of
Scientific Reports | (2021) 11:8878 | https://doi.org/10.1038/s41598-021-87384-8 7
Vol.:(0123456789)
www.nature.com/scientificreports/
Figure 7. Relative abundance of root-associated bacterial taxa at phylum and family levels. (a) Top 10
dominant taxa at phylum level and (b) top 15 dominant taxa at family level in root-associated compartment.
Asterisks (*) show taxa significantly more abundant in the rhizosphere than in the bulk soil at 11 weeks after
planting (FDR < 0.01, ALDEx2). Values are expressed as means of relative frequency at 10 plots.
soybean (Supplementary Fig. S9, Additional file 1), probably because the field soil was rich in organic matter and
mineral nutrients by application of fertilizer until the previous year. Allelopathic activity in the soil is affected
by various soil factors including organic m atter40, and symbiotic nitrogen fixation in legumes is suppressed by
nitrogen fertilizer41,42.
Transcriptome analysis of soybean plants grown in the field revealed that the expression of genes associated
with nitrogen assimilation in the root was positively correlated with inorganic nitrogen contents in the bulk
soil (Fig. 9, Supplementary Fig. S14). In Arabidopsis, the glutamine synthetase gene GLN1;2 is upregulated by
ammonium and nitrate supply43,44. Expression of nitrate reductase genes NR1 and NR2 and the nitrate trans-
porter genes NRT1.1 and NRT2.1 is also induced by the presence of n itrate45–47. Although short-term induction
of these genes was observed in Arabidopsis in laboratory e xperiments45–47, our data demonstrated that long-term
responses at the basal expression level were present in soybean plants grown in the field.
Gene expression patterns at different growth stages of soybeans in the field were partly consistent with those
in the laboratory31. Upregulation of genes responsive to biotic stress (chitin and fungus) and downregulation
of genes related to photosynthesis in the leaves at a later stage were commonly observed in the laboratory31 and
the field (Fig. 3), indicating that those gene expression patterns are typical responses to leaf senescence in the
soybean plants31. Upregulation of signaling pathways mediated by jasmonic acid, salicylic acid, and abscisic acid
at a later stage (Fig. 3) are consistent with these plant hormones promoting leaf s enescence48. In contrast to that
of the leaf, the senescence process of the root is poorly u nderstood49. Our data suggest that the downregulation
of genes related to cell wall biosynthesis in the roots at a later stage (Fig. 3) may represent root senescence or
suppression of root elongation.
Microbiome analysis characterized the spatial and temporal dynamics of root-associated microbiota of soy-
bean plants under field conditions. Bacterial communities in the rhizosphere changed more robustly during
Scientific Reports | (2021) 11:8878 | https://doi.org/10.1038/s41598-021-87384-8 8
Vol:.(1234567890)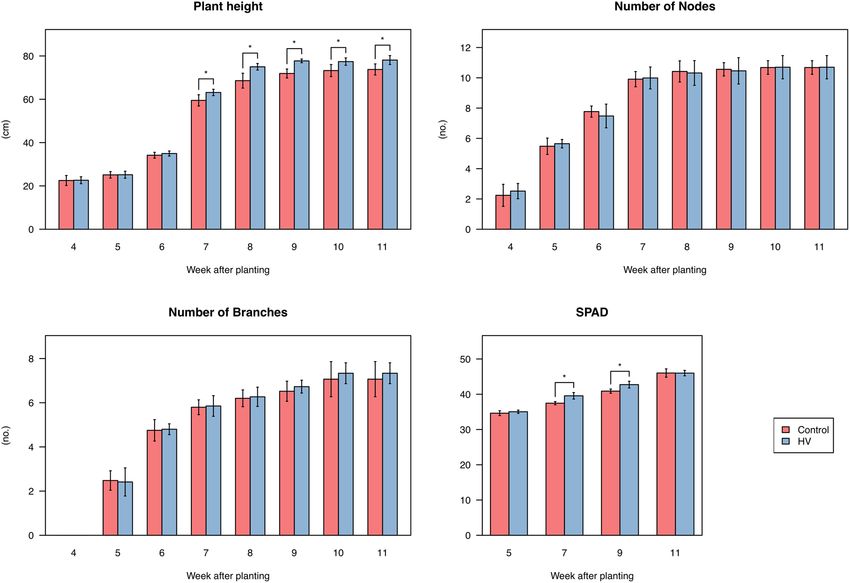
www.nature.com/scientificreports/
Figure 8. Mantel’s r statistics between root-associated bacterial communities and the soil environment. Mantel’s
test was performed using weighted UniFrac (WUF) distance matrix and the Euclidian distance matrix of each
mineral contents at each sampling time. Asterisks (*) show significant correlations (p < 0.01). PCC, Pearson
correlation coefficient; BL, bulk soil; RS, rhizosphere; RP, rhizoplane; EN, endosphere; Ex, exchangeable; CEC,
cation exchange capacity.
soybean development than those in the bulk soil (Fig. 6c, Supplementary Fig. S7), which is consistent with a
previous report50. Additionally, our analysis demonstrated that bacterial communities in the rhizoplane and
endosphere also drastically changed (Fig. 6c, Supplementary Figs. S7, S8). Previous studies reported that root
microbiota in rice was highly dynamic at the vegetative stage and then stabilized at the reproductive stage51.
We also found such dynamic changes of microbiota in soybeans at the vegetative stage (Supplementary Figs.
S7, S8), which is consistent with the high secretion of daidzein from the soybean root at the vegetative stage52.
Daidzein is an isoflavone involved in shaping rhizosphere microbiota and enriches specific bacterial taxa such
as Comamonadaceae18. Such enrichment of Comamonadaceae (assigned as Burkholderiaceae on the database
we used) in the rhizosphere was also observed in our analysis (Fig. 7, Supplementary Fig S12), suggesting that
it is a consistent modification in the soybean rhizosphere even at different locations. By contrast, our analysis
revealed that bacterial communities in the rhizosphere, rhizoplane, and endosphere were also significantly
Scientific Reports | (2021) 11:8878 | https://doi.org/10.1038/s41598-021-87384-8 9
Vol.:(0123456789)www.nature.com/scientificreports/
Figure 9. Correlation between the expression of nitrogen-responsive genes and the content of N H4–N in the
bulk soil. Scatter plots of gene expression levels and N
H4–N contents, and Spearman correlation coefficients
(SCC). SCC values with “a” indicate correlation during 4–11 WAP and those with “b” during 6–11 WAP.
Asterisks (*) show significant correlations (p < 0.05).
shifted during the reproductive stage (Supplementary Figs. S7, S8). Thus, different metabolites may be involved
in microbiome acquisition at different growth stages of soybean plants in the field, and additional investigation
including metabolome in the rhizosphere will further develop our understanding.
Soil mineral analysis using a small-scale protocol30 showed that most of the minerals, especially NH4-N and
exchangeable K, accumulated to high concentrations in the soybean rhizosphere (Fig. 2), which was defined
as the soil adhering to the root surface even after shaking (see Materials and Methods). This is consistent with
other plant rhizospheres such as sorghum (Sorghum bicolor) measured through the same method30. By contrast,
previous rhizobox experiments with separation of soil surrounding the roots into small compartments showed
that those nutrients exhibited a decreasing gradient from the surrounding soil to the root s urface22,53. These
apparent inconsistent results may indicate that proximity to the root surface has a great effect on mineral content
around the roots.
Mantel’s test and network analysis among bacterial communities and mineral contents revealed that the
bacterial communities in the rhizosphere were significantly interrelated with mineral content in the rhizosphere
(Figs. 8, 10). In particular, the unique bacterial communities to the rhizosphere at the later reproductive stage
(Fig. 6b) significantly interacted with several mineral components (Fig. 8). Furthermore, the bacterial taxa enrich-
ing in the rhizosphere (Fig. 10c) were correlated with minerals at all growth stages (Fig. 10b). This suggests that
the specific bacterial communities in the rhizosphere affect the availability of mineral nutrients and consequently
may have significant effects on plant growth. In the Module 2 in the co-abundant network (Fig. 10b), some of the
families such as Rhizobiaceae, Chitinophagaceae, and Streptomycetaceae include strains previously isolated as
plant growth-promoting rhizobacteria (PGPR)54–59, and they were also dominant bacterial families in the rhizos-
phere at the later reproductive stage (Fig. 7b). PGPR generally affect plant growth directly by biological nitrogen
fixation, phosphate solubilization, and phytohormone production and indirectly by biocontrol of pathogen and
induction of plant r esistance60–62. Some isolates belonging to Rhizobiaceae or Chitinophagaceae are reported to
solubilize phosphate, produce auxin, and increase plant b iomass54–57. Some members of Streptomyces produce
antibiotics and prevent pathogen infection in host p lants58,59. Streptomyces also is an ammonifying bacteria
that decomposes organic nitrogen compounds into ammonia in the s oil63,64. Other PGPR strains belonging to
Scientific Reports | (2021) 11:8878 | https://doi.org/10.1038/s41598-021-87384-8 10
Vol:.(1234567890)www.nature.com/scientificreports/
(a) Module 5 Module 1 (b)
Module 2 Total-N
Total-C
Total-C Avail. P Avail. P
Module 2
Total-N
Ex. K
NO3-N
NH4-N
Avail. N
BL−Microbiome Ex. K
Module 4 RS−Microbiome BL−Microbiome
RP−Microbiome RS−Microbiome
EN−Microbiome RP−Microbiome
BL−Mineral EN−Microbiome
Module 3 RS−Mineral BL−Mineral
RS−Mineral
(c) (d) Module 3, Top10
Sphingomonadaceae
60 60 Acidobacteria (p); Subgroup 6 (c)
Gemmatimonadaceae
Module 2, Top10 Xanthomonadaceae
50 50 Nitrosomonadaceae
Xanthobacteraceae
Relative abundance (%)
Relative abundance (%)
Diplorickettsiaceae
Burkholderiaceae Holophagae (c); Subgroup 7 (o)
40 Chitinophagaceae 40 uncultured Acidobacter iales bacterium
Bacillaceae Caulobacteraceae
Streptomycetaceae Acidobacteria (p); Subgroup 17 (c)
30 Rhizobiaceae 30 other
Nitrososphaeraceae
Gaiellales (o); uncultured (f)
20 Chthoniobacteraceae 20
Micrococcaceae
other
10 10
0 0
4 6 8 11 4 6 8 11
Week after planting Week after planting
Figure 10. Co-abundance network among soil minerals and bacterial taxa at the family levels in root-associated
compartments. (a) Co-abundance network constructed based on the correlation. Four networks in four growth
stages were merged, and the consistent network at all growth stages were extracted. Modules were found based
on the fast greedy modularity optimization algorithm. Nodes represent bacterial taxa at the family level and
mineral components, and edges are drawn based on the topological overlap. (b) Sub-network of the Module
2. (c) Relative abundance of taxa belonging to the Module 2 in the rhizosphere. (d) Relative abundance of taxa
belonging to the Module 3 in the rhizosphere. BL, bulk soil; RS, rhizosphere; RP, rhizoplane; EN, endosphere;
Avail, available; Ex, exchangeable.
Bacillaceae, that is included in the Module 2 in our network (Fig. 10b,c), are also reported to solubilize potassium
and increase its uptake into plants65,66. These are consistent with our network in that the Module 2 include miner-
als such as available P, N
H4-N, and exchangeable K in the rhizosphere (Fig. 10b). Together with these previous
reports, our findings suggest that specific bacterial activities in the rhizosphere may cause great accumulation
of minerals such as N H4-N and exchangeable K in the rhizosphere (Fig. 2).
In summary, we performed a field multi-omics analysis and characterized the spatiotemporal dynamics of the
soybean root-associated environment in the actual field condition. Mineral contents and bacterial communities
in the rhizosphere were distinct from those in the bulk soil, and they significantly interacted with each other.
Our findings suggest that the rhizosphere bacterial community has a close association with mineral availability
in the rhizosphere. Further understanding of the root-associated environment and optimal modification of them
will achieve the robust crop production under environmental changes.
Materials and methods
Plant materials, cultivation schedule, and sampling. Soybean cultivation was conducted at the
experimental field of the Tokyo University of Agriculture and Technology, Japan (35°40′59.2" N, 139°29′05.3"
E), in 2017–2018. Ten plots (4 × 10 m) within the farm were established for the current experiment. In each of
the odd-numbered plots (1, 3, 5, 7, 9 plot), a winter cover crop, HV (Visia villosa Roth subsp. Villosa, Takii) was
hand sown in early November 2017. The even-numbered plots (2, 4, 6, 8, 10 plot) were kept as fallow. The field
was maintained organically without the addition of fertilizer. HV and native weeds were allowed to grow until
May 2018. The soil was then plowed to a depth of about 30 cm to incorporate cover crop residues (plant organic
materials) using a rotary machine. Control plots were also tiled but with no additional plant materials. The
summer crop, soybean seeds (Glycine max, cv. Enrei, Takii Shubyo, Japan) were sown using a seeding machine
in June 2018. For analysis of bacterial communities, six soybean plants from each plot were collected on July
Scientific Reports | (2021) 11:8878 | https://doi.org/10.1038/s41598-021-87384-8 11
Vol.:(0123456789)www.nature.com/scientificreports/
4, 2018 (early vegetative stage), July 18, 2018 (beginning bloom stage), August 1, 2018 (full bloom stage), and
August 21, 2018 (beginning seed stage). Bulk soil, defined as soil that is at least 20 cm from the plants and does
not adhere to plant r oots50, was also collected at this time. The bulk soil in each plot was obtained by removing
the top 5 cm of the surface soil and then collecting the underneath soil using a shovel. The soil was collected from
five locations in each plot and then combined. For gene expression analysis of soybean plants, five lateral roots
and one top leaf from five plants in each plot were collected and immediately frozen in the field with dry ice. For
evaluation of plant growth, a portable SPAD-502 plus chlorophyll meter (Konica Minolta Company, Japan) was
used to measure relative chlorophyll content in soybean (SPAD value)67. The chlorophyll content of the top three
fully expanded leaves of each plant was measured and the average SPAD value was recorded. This procedure was
repeated for three plant in each plot in the farm condition.
Sample preparation of root‑associated compartments. Rhizosphere and rhizoplane soil were
collected as described previously50,68. Plant roots were shaken vigorously to remove any excess soil. The soil
still adherent to the root was gently brushed off onto clean paper using a brush and sieved with a tea strainer
(1 mm × 1 mm mesh) to remove excess organic material and gravels. The sieved soils were considered to be
“Rhizosphere soil.” Roots used for collecting rhizosphere soil were subsequently used for collection of “Rhizo-
plane soil.” The roots were put in a 500 mL beaker, and 300 mL potassium phosphate saline buffer (PBS) con-
taining surfactant (0.1% Silwet L-77) was added to fully submerge the roots. All beakers were placed on a rotary
shaker and shaken for 10 min to remove the excess soil particles and organic material from the root. The roots
were put in clean beakers with buffer and placed in a sonic bath at 25 °C for 10 min. The solution was then cen-
trifuged at 5,000 × g for 15 min, and the precipitation was collected as Rhizoplane soil. For collection of the roots
used for extraction of endophytes, four healthy, lateral roots of each plant were selected after the rhizoplane soil
was collected. The lateral roots were cleaned of rhizobium. All samples were immediately stored at − 80 °C until
further use.
Soil mineral analysis. Mineral contents were measured using a set of small-scale protocols for analyzing
reviously30. Briefly, total C and total N contents were
the nutrient minerals of small soil samples as described p
measured using an NC analyzer (Sumigraph NC-22F; Sumika Chemical Analysis Service, Ltd., Osaka, Japan).
The available N content was estimated using the phosphate buffer extraction of soil organic N. Inorganic N
(NH4-N, NO3-N) was extracted using a potassium sulfate solution and measured by colorimetric analysis. The
available P content was estimated using the Truog method: extraction using a weak acidic solution and meas-
urement by colorimetric analysis. Exchangeable bases (K, Ca, Mg) were extracted using an ammonium acetate
solution and measured by flame photometry for K and by atomic absorption spectrometry (AA-6200; Shimadzu,
Kyoto, Japan) for Ca and Mg. CEC was measured using residual soil after extraction of exchangeable bases, and
ammonium ion was used as an exchanger cation.
Transcriptome. Soybean tissues were homogenized using a pestle and mortar pre-chilled in liquid nitrogen.
Total RNA was isolated using the RNeasy Plant Mini Kit (QIAGEN, Hilden, Germany) with in-column DNase I
digestion according to the manufacturer’s protocol. The RNA samples were sequenced by single-end 50 bp mode
of HiSeq2500 platform (Illumina, CA).
RNA-seq reads were aligned to the soybean genome assembly v2.169 using STAR v2.7.0f.70 based on Ensembl
Plants release 4371 gene annotations. Gene expression level was estimated as transcripts per million (TPM)72
using RSEM v1.3.073 with default parameters.
After filtering low-expression genes based on the distribution of expression levels (Supplementary Fig. S17),
the whole transcriptome data set (41,682 genes; TPM > 0.125) was used for PCA analysis. To identify differentially
expressed genes, we used the count data of 36,516 genes (TPM > 0.125) in the leaf and 39,028 genes (TPM > 0.25)
in the root, and the R package DESeq274 with a false discovery rate (FDR) of 0.05 and twofold change. Gene
expression profiles were classified into six patterns: significant increase or decrease only between 4 and 6 WAP
(early stage), 6 and 8 WAP (middle or mid stage), or 8 and 11 WAP (later stage). GO enrichment analysis was
carried out using the Soybase GO term enrichment tool (https://www.soybase.org).
Microbiome. DNA was extracted from 250 mg of the soil samples with a DNeasy PowerSoil Kit (QIAGEN,
Hilden, Germany). To crush bacterial cells, a milling machine (CellDistroyer, Pro Sense Inc, model PS100) was
used. For extraction of endophytic bacterial DNA from soybean roots, the same kit was also used. The extracted
DNA was quantified using the Quantus Fluorometer and QuantiFluor Dyes (Promega Corporation, Madison,
CA) and stored at − 80 °C until use.
PCR amplification of the V4 region of 16S rRNA genes was performed as described p reviously18. Each 25 μL
of reaction mixture contained 1 ng template DNA, 0.3 μL of KOD FX neo (Toyobo, Osaka, Japan), 12.5 μL of
buffer (provided with the polymerase), 5 μL of dNTPs (2 mM), and 0.75 μL of 515F (5′-ACACTCT TTCCC
TACACGACGCTCTTCCGATCT-GTGCCAGCMGCCGCGGTAA-3′) and 806R (5′-GTGACTGGAGTTCAG
ACGTGTGCTCTTCCGATCT-GGACTACHVGGGTWTCTAAT-3′) primers. PCR conditions were as follows:
initial denaturation at 94 °C for 2 min and 22 cycles at 98 °C for 10 s, 50 °C for 30 s, and 68 °C for 30 s. The PCR
products were purified using AMPure XP magnetic beads (Beckman-Coulter, Indianapolis, IN, USA). For the
amplification of bacterial endophytic DNA, 2.5 pmol/μL peptide nucleic acid (Fasmac Co., Ltd, Kanagawa, Japan)
were added to the reaction mixture to avoid the amplification of root mitochondrial DNA.
To attach MiSeq adaptors, a second round of PCR was performed in a 25 μL reaction mixture containing 2 μL
template DNA (purified from the first PCR product), 0.3 μL of KOD FX neo (Toyobo, Osaka, Japan), 12.5 μL of
buffer (provided with the polymerase), and 0.75 μL of primers provided with Fasmac Co. Ltd. The second PCR
Scientific Reports | (2021) 11:8878 | https://doi.org/10.1038/s41598-021-87384-8 12
Vol:.(1234567890)www.nature.com/scientificreports/
products were purified using AMPure XP magnetic beads and confirmed by electrophoresis on 1.5% agarose
gels. The DNA concentration was measured using the Quantus Fluorometer and QuantiFluor Dyes (Promega
Corporation, Madison, CA, USA) according to the manufacturer’s protocol. Amplicon sequencing using the
Illumina MiSeq platform (2 × 250 bp) was outsourced to Fasmac Co., Ltd.
The obtained sequences were processed and analyzed using the QIIME2 pipeline (version 2019.10)75. Raw
fastq files were imported into QIIME2, and paired-end sequences were trimmed at the first 20 bases, truncated
at 200 bases from the start, quality filtered, denoised, and merged using DADA276 with the q2-dada2 plugin in
QIIME2. Multiple alignments of the representative sequences were performed using the MAFFT program, and
the phylogenetic tree was generated with the FastTree program in the q2-phylogeny p lugin77,78. Taxonomy was
assigned to the sequences using the q2-feature-classifier plugin and a Naive Bayes classifier, which was pre-trained
on operational taxonomic units (99% identity) from 515F/806R region of sequences on the SILVA rRNA gene
database release 1 3279,80. After filtering mitochondrial and chloroplastic sequences, 52,780–321,718 reads per
sample were obtained. Alpha and beta diversity analysis was performed using the core-metrics-phylogenetic
pipeline in the q2-diversity plugin within QIIME2, which rarefies ASV tables to 50,000 reads and calculates
Shannon’s diversity index, observed ASVs, Faith’s phylogenetic diversity, and Evenness for alpha diversity. It
furthermore computes Jaccard, Bray–Curtis, and weighted and unweighted UniFrac distances for beta diversity
and generates PCoA plots for each beta diversity metrics. Association between categorical metadata groups and
alpha diversity metrics were tested by Kruskal–Wallis and corrected by the Benjamini–Hochberg method, and
that for beta diversity were analyzed by PERMANOVA and corrected by the Benjamini–Hochberg method using
the R software packages stats and v egan81.
To identify differential abundant bacterial taxa at the family level between in the bulk soil and rhizosphere,
we used the R software package A LDEx282,83 with an FDR cutoff of 0.01.
Mantel’s test. Mantel’s test was performed to investigate the relationship between bacterial community
structure and soil chemical property. We used the weighted UniFrac distance of the bacterial community within
a compartment and the Euclidian distance of each mineral content. The correlations between those distance
matrices were analyzed using the R software package vegan81 with 10,000 permutations.
The correlation between gene expression profile and soil chemical property also was analyzed by Mantel’s
test. We calculated the correlation distance matrix of gene expression profiles as the subtraction of one from a
correlation matrix of whole transcriptome data sets without low expression genes.
Network analysis. A singed correlation network was constructed among the abundance of bacterial taxa
at the family level and concentrations of minerals using the weighted gene co-expression network analysis
(WGCNA) with the R package W GCNA84. Count data of taxonomy profile were log-transformed using the R
85
packages phyloseq and m icrobiome86, and low abundant taxa (Max < 0.1%) from each compartment at each
sampling time were filtered out. The soft thresholding power for each dataset at four growth stages was chosen
based on the scale-free topology fit index of 0.85. The adjacency matrix was calculated using the soft threshold-
ing power, and it was transformed into the topological overlap matrix. Network connections whose topological
overlap was above the thresholds of 0.05 were extracted. Networks at four growth stages were merged, and inter-
section of them was visualized using the R package igraph87.
Data visualization. Statistical analysis was conducted with the R s oftware88. Figures are drawn using the R
packages gplots89, corrplots90, and b
eeswarm91.
Data availability
The accession numbers of sequence data has been registered in the DNA Data Bank of Japan (DDBJ) Sequence
Read Archive are DRA011419 and DRA011795.
Received: 5 July 2020; Accepted: 26 March 2021
References
1. Bormann, F. H., Likens, G. E. & Melillo, J. M. Nitrogen budget for an aggrading northern hardwood forest ecosystem. Science (80-)
196, 981–983 (1977).
2. Nannipieri, P. & Eldor, P. The chemical and functional characterization of soil N and its biotic components. Soil Biol. Biochem. 41,
2357–2369 (2009).
3. Stevenson, F. J. Humus Chemistry: Genesis, Composition, Reactions (Wiley, 1994).
4. Kuypers, M. M. M., Marchant, H. K. & Kartal, B. The microbial nitrogen-cycling network. Nat. Rev. Microbiol. 16, 263–276 (2018).
5. Khan, M. S., Zaidi, A. & Wani, P. A. Role of phosphate-solubilizing microorganisms in sustainable agriculture—a review. Agron.
Sustain. Dev. 27, 29–43 (2007).
6. Sattar, A. et al. Perspectives of potassium solubilizing microbes in sustainable food production system: a review. Appl. Soil Ecol.
133, 146–159 (2019).
7. Colombo, C., Palumbo, G., He, J. Z., Pinton, R. & Cesco, S. Review on iron availability in soil: Interaction of Fe minerals, plants,
and microbes. J. Soils Sediments 14, 538–548 (2014).
8. Hinsinger, P. Bioavailability of soil inorganic P in the rhizosphere as affected by root-induced chemical changes: a review. Plant
Soil 237, 173–195 (2001).
9. Badri, D. V., Weir, T. L., van der Lelie, D. & Vivanco, J. M. Rhizosphere chemical dialogues: plant-microbe interactions. Curr. Opin.
Biotechnol. 20, 642–650 (2009).
10. Hiltner, L. Uber nevere erfahrungen und probleme auf dem gebiet der boden bakteriologie und unter besonderer beurchsichtigung
der grundungung und broche. Arbeit. Deut. Landw. Ges. Berlin 98, 59–78 (1904).
Scientific Reports | (2021) 11:8878 | https://doi.org/10.1038/s41598-021-87384-8 13
Vol.:(0123456789)www.nature.com/scientificreports/
11. Hartmann, A., Rothballer, M. & Schmid, M. Lorenz Hiltner, a pioneer in rhizosphere microbial ecology and soil bacteriology
research. Plant Soil 312, 7–14 (2008).
12. Uren, N. Types, amounts, and possible functions of compounds released into the rhizosphere by soil-grown plants. in The rhizo-
sphere: biochemistry and organic substances at the soil-plant interface, Second Edition (eds. Pinton, R., Varanini, Z. & Nannipieri,
P.) 1–21 (2007). https://doi.org/10.1201/9781420005585.ch1.
13. Hinsinger, P., Bengough, A. G., Vetterlein, D. & Young, I. M. Rhizosphere: biophysics, biogeochemistry and ecological relevance.
Plant Soil 321, 117–152 (2009).
14. Kuzyakov, Y. & Blagodatskaya, E. Microbial hotspots and hot moments in soil: concept & review. Soil Biol. Biochem. 83, 184–199
(2015).
15. Cooper, J. E. Early interactions between legumes and rhizobia: disclosing complexity in a molecular dialogue. J. Appl. Microbiol.
103, 1355–1365 (2007).
16. Weston, L. A. & Mathesius, U. Flavonoids: their structure, biosynthesis and role in the rhizosphere, including allelopathy. J. Chem.
Ecol. 39, 283–297 (2013).
17. Sugiyama, A. & Yazaki, K. Flavonoids in plant rhizospheres: secretion, fate and their effects on biological communication. Plant
Biotechnol. 31, 431–443 (2014).
18. Okutani, F. et al. Rhizosphere modelling reveals spatiotemporal distribution of daidzein shaping soybean rhizosphere bacterial
community. Plant Cell Environ. https://doi.org/10.1111/pce.13708 (2019).
19. Reinhold-Hurek, B., Bünger, W., Burbano, C. S., Sabale, M. & Hurek, T. Roots shaping their microbiome: global hotspots for
microbial activity. Annu. Rev. Phytopathol. 53, 403–424 (2015).
20. Fernández-González, A. J. et al. Defining the root endosphere and rhizosphere microbiomes from the World Olive Germplasm
Collection. Sci. Rep. 9, 1–13 (2019).
21. Sugiyama, A. The soybean rhizosphere: metabolites, microbes, and beyond—a review. J. Adv. Res. 19, 67–73 (2019).
22. Moritsuka, N., Yanai, J. & Kosaki, T. Non-destructive method for determining temporal and spatial changes of the soil solution
chemistry in the rhizosphere. Soil Sci. Plant Nutr. 46, 713–719 (2000).
23. Gahoonia, T. S. & Nielsen, N. E. A method to study zhizosphere processes in thin soil layers of different proximity to roots. Plant
Soil 135, 143–146 (1991).
24. Barber, S. A. & Ozanne, P. G. Autoradiographic evidence for the differential effect of four plant species in altering the calcium
content of the rhizosphere soil. Soil Sci. Soc. Am. J. 34, 635–637 (1970).
25. York, L. M., Carminati, A., Mooney, S. J., Ritz, K. & Bennett, M. J. The holistic rhizosphere: integrating zones, processes, and
semantics in the soil influenced by roots. J. Exp. Bot. 67, 3629–3643 (2016).
26. Kuzyakov, Y. & Razavi, B. S. Rhizosphere size and shape: temporal dynamics and spatial stationarity. Soil Biol. Biochem. 135,
343–360 (2019).
27. Ichihashi, Y. et al. Multi-omics analysis on an agroecosystem reveals the significant role of organic nitrogen to increase agricultural
crop yield. Proc. Natl. Acad. Sci. USA 117, 14552–14560 (2020).
28. Sainju, U. M. & Singh, B. P. Winter cover crops for sustainable agricultural systems_ influence on soil properties, water quality,
and crop yields. HortScience 32, 21–28 (1997).
29. Hartwig, N. L. & Ammon, H. U. Cover crops and living mulches. Weed Sci. 50, 688–699 (2002).
30. Yamazaki, S. et al. Properties of rhizosphere soil associated with herbaceous plant roots analyzed using small-scale protocols.
bioRxiv https://doi.org/10.1101/800664 (2019).
31. Brown, A. V. & Hudson, K. A. Developmental profiling of gene expression in soybean trifoliate leaves and cotyledons. BMC Plant
Biol. 15, 1–14 (2015).
32. Lee, S. A. et al. A preliminary examination of bacterial, archaeal, and fungal communities inhabiting different rhizocompartments
of tomato plants under real-world environments. Sci. Rep. 9, 1–15 (2019).
33. Edwards, J. et al. Structure, variation, and assembly of the root-associated microbiomes of rice. Proc. Natl. Acad. Sci. USA 112,
E911–E920 (2015).
34. Clauset, A., Newman, M. E. J. & Moore, C. Finding community structure in very large networks. Phys. Rev. E Stat. Phys. Plasmas
Fluids Relat. Interdiscip. Top 70, 6 (2004).
35. Fujii, Y. Allelopathy in the natural and agricultural ecosystems and isolation of potent allelochemicals from Velvet bean (Mucuna
pruriens) and Hairy vetch (Vicia villosa). Biol. Sci. Sp. 17, 6–13 (2003).
36. Kamo, T., Hiradate, S. & Fujii, Y. First isolation of natural cyanamide as a possible allelochemical from hairy vetch Vicia villosa.
J. Chem. Ecol. 29, 275–283 (2003).
37. Geddes, M. C., Cavalieri, A., Daayf, F. & Gulden, R. H. The allelopathic potential of hairy vetch (Vicia villosa Roth.) Mulch. Am.
J. Plant Sci. 06, 2651–2663 (2015).
38. Kong, C. H., Wang, P., Zhao, H., Xu, X. H. & Zhu, Y. D. Impact of allelochemical exuded from allelopathic rice on soil microbial
community. Soil Biol. Biochem. 40, 1862–1869 (2008).
39. Cipollini, D., Rigsby, C. M. & Barto, E. K. Microbes as targets and mediators of allelopathy in plants. J. Chem. Ecol. 38, 714–727
(2012).
40. Kobayashi, K. Factors affecting phytotoxic activity of allelochemicals in soil. Weed Biol. Manag. 4, 1–7 (2004).
41. McAuliffe, C., Chamblee, D. S., Uribe-Arango, H. & Woodhouse, W. W. Jr. Influence of inorganic nitrogen on nitrogen fixation by
legumes as revealed by N15. Agron. J. 50, 334–337 (1958).
42. Hardarson, G., Zapata, F. & Danso, S. K. A. Effect of plant genotype and nitrogen fertilizer on symbiotic nitrogen fixation by
soybean cultivars. Plant Soil 82, 397–405 (1984).
43. Ishiyama, K. et al. Kinetic properties and ammonium-dependent regulation of cytosolic isoenzymes of glutamine synthetase in
arabidopsis. J. Biol. Chem. 279, 16598–16605 (2004).
44. Lothier, J. et al. The cytosolic glutamine synthetase GLN1;2 plays a role in the control of plant growth and ammonium homeostasis
in Arabidopsis rosettes when nitrate supply is not limiting. J. Exp. Bot. 62, 1375–1390 (2011).
45. Cheng, C. L., Acedo, G. N., Dewdney, J., Goodman, H. M. & Conkling, M. A. Differential expression of the two arabidopsis nitrate
reductase genes. Plant Physiol. 96, 275–279 (1991).
46. Filleur, S. & Daniel-Vedele, F. Expression analysis of a high-affinity nitrate transporter isolated from Arabidopsis thaliana by dif-
ferential display. Planta 207, 461–469 (1999).
47. Okamoto, M., Vidmar, J. J. & Glass, A. D. M. Regulation of NRT1 and NRT2 gene families of Arabidopsis thaliana: responses to
nitrate provision. Plant Cell Physiol. 44, 304–317 (2003).
48. Lim, P. O., Kim, H. J. & Gil Nam, H. Leaf senescence. Annu. Rev. Plant Biol. 58, 115–136 (2007).
49. Großkinsky, D. K., Syaifullah, S. J. & Roitsch, T. Integration of multi-omics techniques and physiological phenotyping within a
holistic phenomics approach to study senescence in model and crop plants. J. Exp. Bot. 69, 825–844 (2018).
50. Sugiyama, A., Ueda, Y., Zushi, T., Takase, H. & Yazaki, K. Changes in the bacterial community of soybean rhizospheres during
growth in the field. PLoS ONE 9, 1–9 (2014).
51. Edwards, J. A. et al. Compositional shifts in root-associated bacterial and archaeal microbiota track the plant life cycle in field-
grown rice. PLoS Biol. 16, 1–28 (2018).
52. Sugiyama, A. et al. Developmental and nutritional regulation of isoflavone secretion from soybean roots. Biosci. Biotechnol. Bio-
chem. 80, 89–94 (2016).
Scientific Reports | (2021) 11:8878 | https://doi.org/10.1038/s41598-021-87384-8 14
Vol:.(1234567890)You can also read