Detection of Silver Nanoparticles in Seawater Using Surface-Enhanced Raman Scattering
←
→
Page content transcription
If your browser does not render page correctly, please read the page content below
nanomaterials

Article
Detection of Silver Nanoparticles in Seawater Using
Surface-Enhanced Raman Scattering
Monica Quarato, Ivone Pinheiro, Ana Vieira, Begoña Espiña                               and Laura Rodriguez-Lorenzo *

                                          International Iberian Nanotechnology Laboratory (INL), Avda Mestre José Veiga, 4715-310 Braga, Portugal;
                                          monica.quarato@inl.int (M.Q.); ivone.pinheiro@inl.int (I.P.); ana.vieira@inl.int (A.V.); Begona.Espina@inl.int (B.E.)
                                          * Correspondence: laura.rodriguez-lorenzo@inl.int

                                          Abstract: Nanomaterials significantly contribute to the development of new solutions to improve
                                          consumer products properties. Silver nanoparticles (AgNPs) are one of the most used, and as human
                                          exposure to such NPs increases, there is a growing need for analytical methods to identify and
                                          quantify nanoparticles present in the environment. Here we designed a detection strategy for AgNPs
                                          in seawater using surface-enhanced Raman Scattering (SERS). Three commercial AgNPs coated with
                                          polyvinylpyrrolidone (PVP) were used to determine the relative impact of size (PVP-15nmAgNPs and
                                          PVP-100nmAgNPs) and aggregation degree (predefined Ag aggregates, PVP-50–80nmAgNPs) on
                                          the SERS-based detection method. The study of colloidal stability and dissolution of selected AgNPs
                                          into seawater was carried out by dynamic light scattering and UV-vis spectroscopy. We showed that
                                          PVP-15nmAgNPs and PVP-100nmAgNPs remained colloidally stable, while PVP-50–80nmAgNPs
                                          formed bigger aggregates. We demonstrated that the SERS-based method developed here have
                                          the capacity to detect and quantify single and aggregates of AgNPs in seawater. The size had

                                   almost no effect on the detection limit (2.15 ± 1.22 mg/L for PVP-15nmAgNPs vs. 1.51 ± 0.71 mg/L
Citation: Quarato, M.; Pinheiro, I.;      for PVP-100nmAgNPs), while aggregation caused an increase of 2.9-fold (6.08 ± 1.21 mg/L). Our
Vieira, A.; Espiña, B.; Rodriguez-        results demonstrate the importance of understanding NPs transformation in seawater since this can
Lorenzo, L. Detection of Silver           influence the detection method performance.
Nanoparticles in Seawater Using
Surface-Enhanced Raman Scattering.        Keywords: AgNPs; SERS; NPs transformation; water; sensor
Nanomaterials 2021, 11, 1711. https://
doi.org/10.3390/nano11071711

Academic Editor: Maurizio                 1. Introduction
Muniz-Miranda
                                                Nanomaterials [1] are becoming more and more prevalent as ingredients for several
                                          consumer products such as paints, personal care products, food, and cosmetics [2–4]. Silver
Received: 2 June 2021
Accepted: 24 June 2021
                                          nanoparticles (AgNPs) are becoming, among others, one of the most-used engineered
Published: 29 June 2021
                                          nanomaterials as a result of their properties, mainly their antibacterial properties, in
                                          consumer products, including textiles, disinfectants and filtration membranes where the
Publisher’s Note: MDPI stays neutral
                                          particles can be found in both solid or liquid (coating and spray) state [5]. Despite all the
with regard to jurisdictional claims in
                                          promising applications, there is a growing concern about associated risks to humans and
published maps and institutional affil-   ecosystems. The production, transport, washing, or disposal of products containing AgNPs
iations.                                  are only some of the steps that could lead to Ag release into the environment compromising
                                          agricultural and fishery activities with a potential impact on human health [6–8]. Therefore,
                                          there is a growing need for an analytical method to directly detect these NPs present in
                                          the environment.
Copyright: © 2021 by the authors.
                                                At present, there are different techniques that allow the detection and quantification of
Licensee MDPI, Basel, Switzerland.
                                          AgNPs, including spectroscopic [9] and electrochemical methods [10,11], and, for the ma-
This article is an open access article
                                          jority, single-particle inductively coupled plasma mass spectrometry (sp-ICP-MS) [12–14].
distributed under the terms and           Although these techniques allow both qualitative and quantitative determination of NPs, it
conditions of the Creative Commons        is crucial to develop equally accurate and fast methods for their characterization and envi-
Attribution (CC BY) license (https://     ronmental risk assessment on-site. The development of portable sensors for their detection
creativecommons.org/licenses/by/          is also necessary since those will allow decentralized monitoring and quick implementation
4.0/).                                    of measures for risk mitigation [15].

Nanomaterials 2021, 11, 1711. https://doi.org/10.3390/nano11071711                                         https://www.mdpi.com/journal/nanomaterials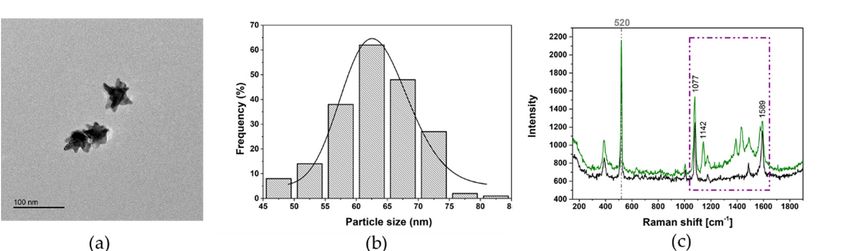
Nanomaterials 2021, 11, 1711                                                                                            2 of 13

                                     Taking advantage of the high scattering and plasmonic properties of AgNPs [16,17],
                               specific detection methods based on surface-enhance Raman scattering can be developed.
                               Unlike Raman spectroscopy, SERS overcomes the limitation due to weak signals by ex-
                               ploiting such AgNPs properties via electromagnetic enhancement mechanism to Raman
                               signal increase [18]. This, coupled with chemical interactions between molecular probe and
                               plasmonic NP and with the ability of metal surfaces to quench the fluorescence background
                               when both are in close proximity, makes SERS sensitive enough to detect trace amounts for
                               analysis even at the single molecule level [19]. A non-overlapped spectra with a narrow
                               bandwidth sensitive to slight changes in molecule structures and orientation is the output
                               of this technique [20]. The applicability of SERS in the detection of nanostructures, like
                               AgNPs, has been already reported, in which a Raman reporter molecule, ferbam (ferric
                               dimethyl-dithiocarbamate), allowed the detection of NPs in complex matrices after strong
                               interactions were established [21].
                                     This work aims to design a detection method for AgNPs by correlating the enhance-
                               ment of SERS signal of 4-aminobenzenethiol (4ABT)-attached to gold nanostars (AuNSs)
                               with the presence of AgNPs in seawater. Seawater was selected as an environmentally rele-
                               vant medium because coastal waters are one of the main sinks at the end-of-life of AgNPs-
                               containing products, mainly through treated and untreated wastewater discharges [22].
                               We selected AuNSs as a highly efficient SERS substrate due to the high localization of the
                               electromagnetic field at their tips and their consequent behavior as individual hot spots
                               allowing zeptomole detection of molecules attached to their surface [23–25]. 4ABT was
                               chosen as a Raman reporter due to both its aromatic nature that confers a high Raman
                               cross-section and its functional groups, -SH and -NH2 , which strongly interact with Au
                               and Ag. In fact, 4ABT has been already used as a Raman reporter to detect AgNPs in
                               dietary supplement products by SERS via the formation of S-Ag bond [26]. In this work,
                               we carried out a different approach: First, 4ABT was attached to AuNSs and, subsequently,
                               the free amino group of 4ABT was available bind to AgNPs [27]. Thus, the enhancement of
                               the SERS signal can be explained by inter-particles AgNPs-AuNSs interaction via 4ABT
                               generating hot spots, which increases the concentration of electromagnetic field at these sites
                               and, as a consequence, the enhancement of SERS signal also occurs [28]. This enhancement
                               depends on the plasmonic properties of AgNPs, which in turn depend on the physicochem-
                               ical properties of the NPs such as size, shape, aggregation state, and surface coating. To
                               investigate the effect of these parameters, we selected three commercially available AgNPs
                               coated with polyvinylpyrrolidone (PVP). PVP is a widely used water-soluble polymer
                               whose role as stabilizing agent is well known [29,30]. The molar ratio between silver and
                               macromolecule (i.e., polymer) is usually enough to prevent or at least slow down aggrega-
                               tion and dissolution processes over the time [31]. Having similar surface properties due
                               to the presence of PVP, we studied the effect of the size on SERS enhancement by having
                               two AgNPs with a diameter of 15 (PVP-Ag15nm NPs) and 100 nm (PVP-Ag100nm NPs)
                               and the effect of the aggregation including a predefined product formed by Ag aggregates
                               coated with PVP with a primary NP size of 50–80 nm (PVP-Ag50–80 NPs).
                                     We studied the colloidal stability (i.e., aggregation and dissolution) of selected AgNPs
                               in seawater by UV-vis spectroscopy, dynamic light scattering (DLS), and zeta potential.
                               After understanding the possible transformation of AgNPs in seawater, we performed
                               average SERS detection (i.e., in liquid) in both ultrapure water and seawater to study the
                               possible matrix interference [32] (i.e., salt concentration). In addition, we characterized the
                               AgNPs interaction with 4ABT-coated AuNSs by transmission electron microscopy (TEM)
                               and the colloidal stability of AuNSs in seawater by UV-vis spectroscopy. We were able
                               to construct calibration curves for all AgNPs even the smaller one, PVP-Ag15nm NPs,
                               in seawater. The limits of detection using a portable Raman system, which has lower
                               performance of the detector in comparison with the Raman confocal microscope [33,34],
                               were in the mg/L range.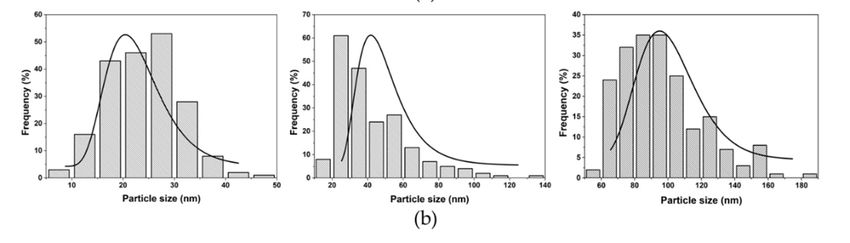
Nanomaterials 2021, 11, 1711                                                                                        3 of 13

                               2. Materials and Methods
                               2.1. Silver Nanoparticles (AgNPs)
                                    AgNPs powders with a core diameter of 15 nm (PVP-Ag15nm NPs) and 50–80 nm
                               (PVP-Ag50–80nm NPs) were supplied by SSNano (Houston, TX, USA; product code:
                               0127SH) and US Research Nanomaterials, Inc (Houston, TX, USA; product code: US1018),
                               respectively, and used without any further purification. The powder composition was
                               25% wt silver and 75% wt polyvinylpyrrolidone (PVP) for PVP-Ag15nm NPs and 0.2%
                               of PVP for PVP-Ag50–80nm NPs. Further, 1 g/L of AgNPs dispersion was prepared in
                               ultrapure water with a resistivity of 18.2 MΩ at 25 ◦ C (Millipore apparatus, MQ Aquantage
                               A10, Merck, Algés, Portugal) and this was sonicated for 15 min using a bath sonicator
                               (Elmasonic P, Elma, VWR, Amadora, Portugal) (37 kHz, 100% at 25 ◦ C). The dispersion
                               was stored at 4 ◦ C until further use.
                                    An AgNPs ink containing 30% wt AgNPs dispersed in ethylene glycol was purchased
                               from Sigma-Aldrich (Merck Life Science-Sigma Aldrich, Algés, Portugal; product code:
                               798738). In order to remove ethylene glycol due to its toxicity [35], 4 g of the AgNPs ink
                               were diluted with ultrapure water to reach a concentration of ethylene glycol of 0.15–0.3 M
                               (30–15 mL final volume). The diluted ink was then dialyzed using a 12 kDa cellulose
                               membrane (Merck Life Science Sigma-Aldrich, Algés, Portugal), product code: D6191)
                               against ultrapure water for 6 h. After dialysis, AgNPs were mixed with 24 mL of 150 g/L
                               PVP solution, reaching an Ag:PVP ratio of 1:3 wt. The PVP-Ag100nm NPs dispersion
                               was stored at 4 ◦ C until further use. The purification process and PVP coating of these
                               AgNPs were characterized by dynamic light scattering (SZ-100 device, Horiba, ABX SAS,
                               Amadora, Portugal) and UV-vis spectroscopy (Perkin-Elmer LAMBDA 950 spectropho-
                               tometer, Scientific Laboratory Supplies, Wilford, Nottingham, UK). The results are shown
                               in Figure S1.

                               2.2. Synthesis and Functionalization of Gold Nanostars (AuNSs)
                                    The synthesis of AuNSs followed the seed-mediated growth method, in which gold
                               spherical nanoparticles (AuNPs) with a diameter of 13 nm work as seeds for the following
                               star-shaped particles formation.
                                    AuNPs were obtained by in-house synthesis according to the reduction method
                               developed by Turkevich et al. [36] where a small amount of gold salt is reduced by the
                               presence of sodium citrate. Briefly, 250 mL of 0.5 mM of an aqueous solution of HAuCl4
                               (Merck Life Science Sigma-Aldrich, Algés, Portugal) was brought to boil for 5–10 min
                               while being kept under vigorous stirring. Then, 12.5 mL of a warm sodium citrate solution
                               (1% wt/V; Merck Life Science, Sigma-Aldrich, Algés, Portugal) was quickly added. The
                               formation of AuNPs was confirmed by the color change of the dispersion from light yellow
                               to dark red.
                                    Once the synthesis was over, the suspension was cooled down until room temperature
                               was reached and kept in the dark at 4 ◦ C until further use.
                                    For the coating, an aqueous solution containing 530 mg of polyvinilpyrrolidone
                               (PVP) with a molecular weight (MW) of 10K (TCI Europe, Zwinjdrecht, Belgium) was
                               prepared and added to the AuNPs solution to provide a ratio of 60 PVP molecules per
                               nm2 . The reaction was left overnight under magnetic stirring and the PVP excess was then
                               removed, performing a centrifugation step at 7000× g for 90 min. PVP-coated AuNPs were
                               re-dispersed in ethanol and stored in dark condition at 4 ◦ C until further use.
                                    The formation of AuNSs took place by mixing 20 g of PVP-10K with 200 mL of
                               N-dimethylformamide (DMF, Merck Life Science, Sigma-Aldrich, Algés, Portugal) in
                               the presence of 0.5 mM of HAuCl4 and 0.023 mM of preformed AuNPs seeds. After a
                               20 min reaction, the solution became dark blue, and 3 cycles of 60 min centrifugation were
                               performed to finally re-disperse the solution in ethanol.
                                    The functionalization occurred by the conjugation of AuNSs with a Raman reporter
                               molecule, 4-aminobenzenthiol (4-ABT; Merck Life Science, Sigma-Aldrich, Algés, Portugal),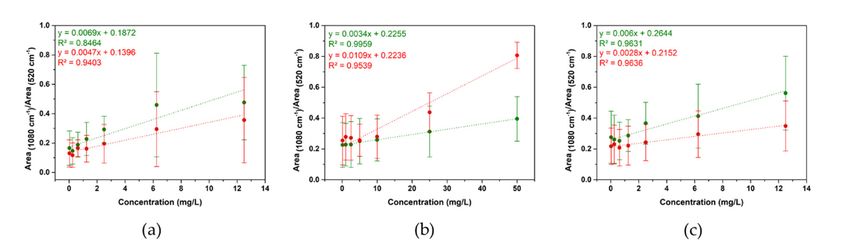
Nanomaterials 2021, 11, 1711                                                                                          4 of 13

                               using 1:1 molar ratio. If freshly prepared, the reaction took place in 10 min, followed by
                               3 centrifugation steps in order to remove the molecules excess (3300× g, 4 min).

                               2.3. Nanoparticles Characterization
                                    Optical and morphological particles characterization was carried out using UV-vis-
                               NIR spectroscopy (Perkin-Elmer LAMBDA 950 spectrophotometer, Scientific Laboratory
                               Supplies, Wilford, Nottingham, UK), size/zeta potential analyzer (SZ-100 device, Horiba,
                               ABX SAS, Amadora, Portugal), and transmission electron microscopy (JEOL 2100 200 kV
                               TEM, Izasa Scientific, Carnaxide, Portugal). The sample concentration of 12.5 mg/L for
                               PVP-Ag15nm and PVP-Ag100nm and 50 mg/L for PVP-Ag50–80nm was loaded into a
                               quartz cuvette, 10 mm optical path, to perform light scattering and UV-vis analysis. A
                               scattering angle of 90◦ and a working temperature of 25 ◦ C was used for size determination.
                               For TEM analysis, the particles were subjected to several centrifugation cycles (3 cycles
                               of 60 min at 8960× g for PVP-Ag15nm; 3 cycles of 15 min at 2500× g for PVP-Ag100nm;
                               and 1 cycle of 10 min at 1500× g for PVP-Ag50–80nm) in order to remove the excess PVP
                               that could interfere with the analysis. To prevent particle aggregation, several drops of the
                               suspension were placed on the grid by drying the excess every time. Furthermore, 400 Cu
                               mesh formvar/carbon grids were used for gold investigations, and instead, pure carbon
                               400 Ti mesh grids were used when silver was analyzed. In both cases, an acceleration
                               voltage of 200 kv was used.

                               2.4. Surface-Enhanced Raman Spectroscopy
                                     For SERS average experiments, 4ABT functionalized AuNSs were chosen as the SERS
                               substrate for the detection of different concentration of AgNPs, in a range 12.5–0.025 mg/L
                               for single particles and 50–0.1 mg/L in the case of aggregates. Different concentrations of
                               AgNPs were added to the AuNSs suspension (1:1, v/v) and 20 µL of the suspension was
                               then placed on a silicon wafer. The SERS measurements were carried out in the liquid.
                                     The standards were prepared by diluting the testing AgNPs in ultrapure water or
                               synthetic seawater. The artificial seawater was prepared by dissolving a commercial salt
                               (ICA Sal Marinho Basic Plus, Aqualovers, Portugal) in DI water (35 ppm salinity) in order
                               to assess salt interference during detection.
                                     SERS spectra were acquired using a 300 Alpha Confocal Raman (WiTEC, Ulm, Ger-
                               many) using 10× objective and a portable Raman spectrometer (B&Wtek, ILC-Inst. De
                               Lab. E Cientificos, Lisboa, Portugal) with optical fiber configuration, where 785 nm was the
                               excitation laser line used. The spectra acquisition was performed for 3 s and with 1 scan
                               per measurement and collected using a laser power of 70 mW and 50 mW for the Confocal
                               and the portable Raman, respectively. The resulting SERS spectra were processed using
                               SpectraGriph 1.2.14 software (Software for optical spectroscopy 2016-20 developed by Dr.
                               Friedrich Menges, Oberstdorf, Germany) after being baseline corrected.

                               3. Results
                               3.1. Physicochemical Characterization of AgNPs in Artificial Seawater
                                    We selected three commercial AgNPs coated with polyvinylpyrrolidone (PVP), named
                               here PVP-Ag15nm NPs, PVP-Ag50–80nm NPs, and PVP-Ag100nm NPs. PVP is a well-
                               known stabilizer agent of NPs, and it has been amply used as a stabilizer of AgNPs [37].
                               Figure 1 shows morphology and size distribution characterized by transmission electron
                               microscopy (TEM). TEM analysis reveals that all NPs present a pseudo-spherical shape
                               and a mean size of 24 ± 7 nm for PVP-Ag15nm NPs, 42 ± 21 nm for PVP-Ag50–80nm NPs,
                               and 96 ± 25 nm for PVP-Ag100nm NPs.
                                    AgNPs have unique optical properties resulting in a very particular UV-vis extinction
                               spectrum in the visible range, which corresponds to the typical yellow color. When excited
                               by an electromagnetic field, AgNPs support coherent oscillations of the surface conduction
                               electrons, and this phenomenon, confined oscillations of the charge density, is referred
                               to as localized surface plasmon resonance (LSPR) [38]. This LSPR can be used to obtain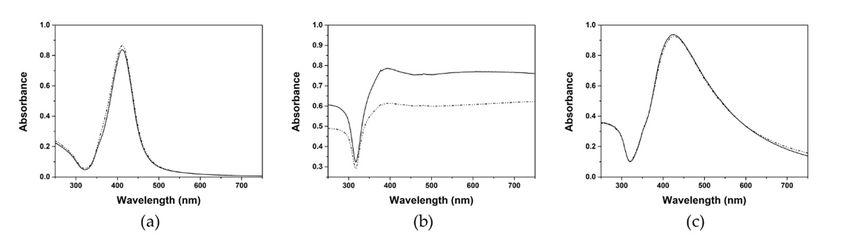
Nanomaterials 2021, 11, 1711 5 of 13
information about the colloidal stability of the AgNPs dispersion. Figure 2 shows the
UV-vis extinction spectra of three commercial PVP-AgNPs in both ultrapure water and
artificial seawater. The extinction spectra of the PVP-Ag15nm NPs and PVP-Ag100nm
NPs displayed a single LSPR band centered at 412 nm and 425 nm in both media, which
demonstrated that these nanoparticles are colloidally stable in media with high ionic
strength like artificial seawater even after 28 days (see Figure S2a–f). This is due to
the presence of PVP since this polymer stabilizes the NPs by electrosteric repulsion [39].
However, the extinction spectrum of PVP-Ag50–80nm NPs showed a broad LSPR band
developed in the visible-near-infrared region and a decrease of the concentration when in
artificial seawater. These features can be attributed to the aggregation of AgNPs, i.e., the
plasmonic coupling between closely packed NPs, especially in the presence of high ionic
strength. Interestingly, the presence of PVP prevented the collapse running out-of-control
Nanomaterials 2021, 11, x FOR PEER REVIEW 5 of 13
Figure 1. (a) TEM images and showstabilized the formed aggregates in artificial seawater (Figure 2b).
morphology and particles dispersion. Particles of 15 (PVP-Ag15nm NPs), 50–80 (PVP-
Ag50–80nm NPs), and 100 nm (PVP-Ag100nm NPs) are shown. Scale bar of 200 nm. (b) Particle size distribution, estimated
by measuring an average of 200 particles, and Gaussian fitting are represented by histograms and continuous line, respec-
tively.
AgNPs have unique optical properties resulting in a very particular UV-vis extinc-
tion spectrum in the visible range, which corresponds to the typical yellow color. When
excited by an electromagnetic field, AgNPs support coherent oscillations of the surface
conduction electrons, and this phenomenon, confined oscillations of the charge density,
is referred to as localized surface plasmon resonance (LSPR) [38]. This LSPR can be used
to obtain information about the colloidal stability of the AgNPs dispersion. Figure 2 shows
the UV-vis extinction spectra of three commercial PVP-AgNPs in both ultrapure water
and artificial seawater. The extinction spectra of the PVP-Ag15nm NPs and PVP-Ag100nm
NPs displayed a single LSPR band centered at 412 nm and 425 nm in both media, which
demonstrated that these nanoparticles are colloidally stable in media with high ionic
strength like artificial seawater even after 28 days (see Figure S2a–f). This is due to the
presence of PVP since this polymer stabilizes the NPs by electrosteric repulsion [39]. How-
ever, the extinction spectrum of PVP-Ag50–80nm NPs showed a broad LSPR band devel-
oped in the visible-near-infrared region and a decrease of the concentration when in arti-
ficial seawater. These features can be attributed to the aggregation of AgNPs, i.e., the plas-
monic coupling between closely packed NPs, especially in the presence of high ionic
Figure 1. (a)
Figure 1. (a)TEM
TEMimages
imagesshow
show morphology
morphology
strength.
and particles
and dispersion.
particles
Interestingly,
Particles
dispersion.
the presence
of 15of(PVP-Ag15nm
Particles
of PVP prevented15 (PVP-Ag15nmNPs), 50–8050–80
the collapse NPs),
(PVP-Ag50–
(PVP-
running out-of-control
80nm NPs), and 100 nm (PVP-Ag100nm NPs) are shown. Scale bar of 200 nm. (b) Particle size distribution, estimated
Ag50–80nm NPs), and 100 nm (PVP-Ag100nm NPs) are shown. Scale bar of 200 nm. (b) Particle size distribution, estimated by
and stabilized the formed aggregates in artificial seawater (Figure 2b).
measuring an average
by measuring of 200
an average particles,
of 200 andand
particles, Gaussian fitting
Gaussian are represented
fitting by histograms
are represented and continuous
by histograms line, respectively.
and continuous line, respec-
tively.
AgNPs have unique optical properties resulting in a very particular UV-vis extinc-
tion spectrum in the visible range, which corresponds to the typical yellow color. When
excited by an electromagnetic field, AgNPs support coherent oscillations of the surface
conduction electrons, and this phenomenon, confined oscillations of the charge density,
is referred to as localized surface plasmon resonance (LSPR) [38]. This LSPR can be used
to obtain information about the colloidal stability of the AgNPs dispersion. Figure 2 shows
the UV-vis extinction spectra of three commercial PVP-AgNPs in both ultrapure water
and artificial seawater. The extinction spectra of the PVP-Ag15nm NPs and PVP-Ag100nm
Figure2.2.UV-vis
Figure UV-visextinction spectra
extinctionNPs
of (a)
spectra of PVP-Ag15nm
displayed(a) PVP-Ag15nm NPs,NPs,
a single LSPR
(b) PVP-Ag50–80nm
(b) PVP-Ag50–80nm
band
NPs, and
centered at 412 nm
(c)
NPs,and PVP-Ag100nm
and NPs dispersed
(c) PVP-Ag100nm
425 nm in both media,NPs dis-which
inpersed
ultrapure water and
in ultrapure artificial
water and seawater,seawater,
artificial represented by solid line
represented by and dotted
solid line andline spectra,
dotted line respectively.
spectra, respectively.
demonstrated that these nanoparticles are colloidally stable in media with high ionic
strength
Owing liketoartificial
the fact seawater
the polymereven after
shell can28act
days
as a(see Figurespacer
dielectric S2a–f).and
Thisbeisandue to the
effective
presence
insulator,of PVP since
which this polymer
may hinder stabilizes
additional the NPs
coupling by electrosteric
of LSPR oscillationsrepulsion
between [39]. How-
associated
ever, the extinction spectrum of PVP-Ag50–80nm NPs showed a broad
particles provoking the decrease of the sensitivity of the UV-vis spectroscopy on the ag- LSPR band devel-
oped in the
gregation visible-near-infrared
monitoring region andthis
[40]. DLS overcomes a decrease
obstacleof thetherefore
and concentration when in arti-
the hydrodynamic
ficial seawater. These features can be attributed to the aggregation
size of the AgNPs was also characterized. DLS analysis in ultrapure water confirmed of AgNPs, i.e., the plas-
the
monic coupling between closely packed NPs, especially in
UV-vis results (Table 1). PVP-Ag15nm NPs and PVP-Ag100nm NPs had a hydrodynamic the presence of high ionic
strength. Interestingly, the presence of PVP prevented the collapse running out-of-control
and stabilized the formed aggregates in artificial seawater (Figure 2b).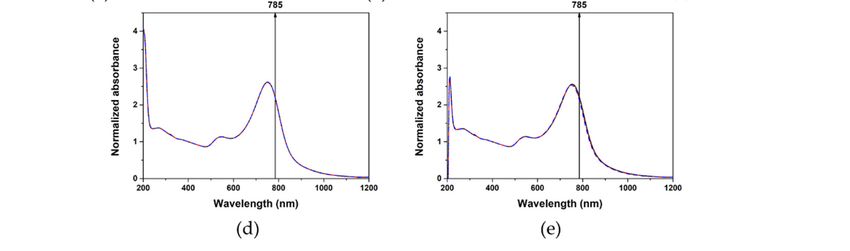
Nanomaterials 2021, 11, 1711                                                                                                           6 of 13

                                        size of 49 ± 3 nm and 139 ± 2 nm, respectively, which are higher diameters than the
                                        diameter obtained by TEM. This is due to the presence of the PVP layer around AgNPs.
                                        PVP-Ag50–80nm NPs presented a hydrodynamic size of 619 ± 75 nm confirming the aggre-
                                        gation of these AgNPs. Interestingly, these AgNPs dispersed in ultrapure water presented
                                        different NP populations with different sedimentation as shown in the time evolution of
                                        the hydrodynamic size in Figure S2h. The presence of PVP is crucial, especially when
                                        the particles are dispersed in artificial seawater. Hydrodynamic diameters of 47 ± 2 nm
                                        and 97 ± 1 nm are recorded for PVP-Ag15nm NPs and PVP-Ag100nm NPs, showing that
                                        the presence of salts does not destabilise the NPs even after 28 days of exposure to this
                                        medium (see Figure S2). The value of 1348 ± 407 reported for PVP-Ag50–80nm NPs proves
                                        instead that the lower amount of PVP is not enough to prevent aggregation to occur and the
                                        particles re-arranged themselves into newly formed aggregates. Moreover, these AgNPs
                                        sedimented completely after 1 day of being dispersed in seawater as shown in the time
                                        evolution of the UV-Vis extinction spectrum (Figure S2g) and the decrease in the DLS
                                        intensity (kcounts) over time (Figure S2j). The hydrodynamic size of PVP-Ag50–80nm NPs
                                        displayed an increase in the first 2 h dispersed in seawater and then reached an equilibrium,
                                        maintaining a similar aggregate size before complete sedimentation (Figure S2i). The PVP-
                                        Ag50–80nm NPs were redispersed after complete sedimentation and their hydrodynamic
                                        size were measured by DLS. A similar size was obtained before and after redispersion
                                        (Figure S2l).

                                          Table 1. Physicochemical characterization of selected AgNPs.

                                              Ultrapure Water                                       Artificial Seawater
                        PVP-15nmAg           PVP-100nmAg        PVP-50–80nmAg      PVP-15nmAg        PVP-100nmAg        PVP-50–80nmAg
                           NPs                   NPs                 NPs              NPs                NPs                 NPs
  Hydrodynamic
                               49 ± 3            139 ± 2           618 ± 83           47 ± 2             97 ± 1            1348 ± 407
  diameter 1 (nm)
     PDI 2 (%)                 57 ± 7            20 ± 2            146 ± 11           36 ± 3             27 ± 4              78 ± 12
   Z potential 3
                           −24 ± 5              −21 ± 12           −83 ± 6            −9 ± 16            −6 ± 10             −5 ± 10
      (mV)
      1Mean hydrodynamic diameter and polydispersity index. 2 obtained by DLS at a scattering angle of 90◦ and 25 ◦ C. DLS measurements
      were carried out by quintupled mean ± standard deviation (SD). 3 Zeta potentials were measured in 5 runs (mean ± SD).

                                             Zeta-potential measurements reveal a negatively charged surface in the case of AgNPs
                                        dispersed in ultrapure water, confirming the repulsion between similarly charged particles
                                        in the dispersion (Table 1). These values can be attributed to the negatively charged PVP
                                        polymer (zeta potential—30 mV) offering a stabilization of AgNPs due to the combined
                                        electrosteric repulsion [39]. A higher negative value of −83 ± 6 mV is recorded for PVP-
                                        Ag50–80nm NPs, demonstrating, once again, that the initial aggregates are stable. All
                                        AgNPs in seawater showed a decrease (i.e., lower net surface charge) in the zeta potential
                                        values: −9 ± 16, −6 ± 10, and −5 ± 10 mV for PVP-Ag15nm NPs, PVP-Ag100nm NPs,
                                        and PVP-Ag50–80nm NPs, respectively. This decrease likely is due to the compression of
                                        electric double layer (EDL) promoted by the presence of high ionic strength in seawater.
                                        This compression of EDL induces aggregation when the only repulse force is electrostatic;
                                        however, in this case, the steric repulsions remain due to the presence of PVP on the
                                        surface, keeping AgNPs stable. In the case of PVP-Ag50–80nm NPs, an increase of the
                                        hydrodynamic size in seawater was observed, which can be attributed to the fact that the
                                        concentration of PVP is lower than in the other two NPs (0.2% vs. 75%).

                                        3.2. Detection of AgNPs in Artificial Seawater Using SERS
                                             We selected AuNSs as the SERS active substrate because they offer an enhancement
                                        factor of the Raman signal up to 1012 thanks to the lowest-energy, localized surface plasmon
                                        mode highly concentrated at the apex of the tips [41,42]. In addition, the core of the
                                        AuNSs acts as an electron reservoir due to strong plasmonic coupling effects, contributing
the fact that the concentration of PVP is lower than in the other two NPs (0.2% vs. 75%).
3.2. Detection of AgNPs in Artificial Seawater Using SERS
We selected AuNSs as the SERS active substrate because they offer an enhancement
Nanomaterials 2021, 11, 1711 factor of the Raman signal up to 1012 thanks to the lowest-energy, localized surface 7 ofplas-
13
mon mode highly concentrated at the apex of the tips [41,42]. In addition, the core of the
AuNSs acts as an electron reservoir due to strong plasmonic coupling effects, contributing
significantly to the enhancement of the SERS signal. AuNSs were synthesized (see more
significantly to the enhancement of the SERS signal. AuNSs were synthesized (see more
details in Methods section) by reducing a gold(III) salt in N,N-dimethylformamide (DMF)
details in Methods section) by reducing a gold(III) salt in N,N-dimethylformamide (DMF)
in the presence of a high concentration of PVP and preformed 13 nm-spherical PVP-coated
in the presence of a high concentration of PVP and preformed 13 nm-spherical PVP-coated
Au seeds (see TEM image and UV-vis spectrum in Figure S3). TEM analysis of AuNSs
Au seeds (see TEM image and UV-vis spectrum in Figure S3). TEM analysis of AuNSs
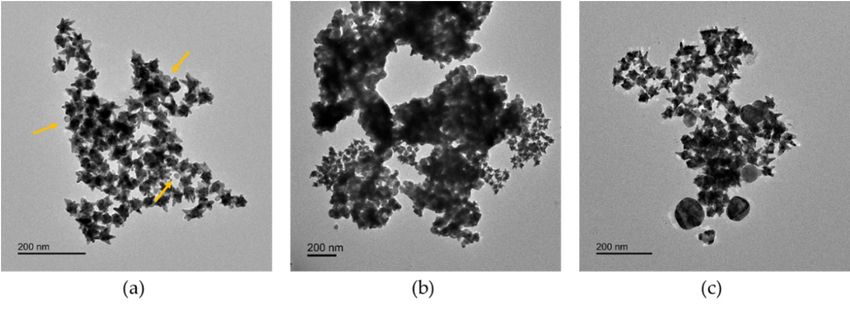
reveals a particle size diameter of 63 ± 7 nm (Figure 3a,b). The UV-vis spectrum of AuNSs
reveals a particle size diameter of 63 ± 7 nm (Figure 3a,b). The UV-vis spectrum of AuNSs
showed two LSPR modes, one of them showing a maximum wavelength in the near in-
showed two LSPR modes, one of them showing a maximum wavelength in the near
frared region (NIR) at 753 nm, related to a plasmon mode localized at the NSs tips and a
infrared region (NIR) at 753 nm, related to a plasmon mode localized at the NSs tips and a
second lower mode, at 540 nm, associated with the internal core. As a consequence, we
second lower mode, at 540 nm, associated with the internal core. As a consequence, we
selected the 785 nm laser as the excitation source adopted in the SERS measurement be-
selected the 785 nm laser as the excitation source adopted in the SERS measurement because
cause this laser overlaps with the LSPR mode at the tips (see Figure 3d). In addition, this
this laser overlaps with the LSPR mode at the tips (see Figure 3d). In addition, this laser
laser was selected to avoid any photodegradation of the probe molecule (4-aminoben-
was selected to avoid any photodegradation of the probe molecule (4-aminobenzenethiol,
zenethiol,
4ABT) used 4ABT) used and
and reduced thereduced
possiblethe possible
matrix matrix interference
interference suppressing suppressing the fluo-
the fluorescence
rescence background and absorption from organic matter dissolved in real
background and absorption from organic matter dissolved in real water samples. water samples.
Figure
Figure3. (a) TEM
3. (a) TEMimage of of
image AuNSs
AuNSs andand (b)(b)
relative particles
relative size
particles distribution
size and
distribution Gaussian
and Gaussianfitting estimated
fitting on on
estimated an an
average
average
of 200 particles
of 200 analysed.
particles Scale
analysed. barbar
Scale of of
100100
nm. (c)(c)
nm. Average
AverageSERS
SERSspectra of of
spectra 4ABT-functionalised
4ABT-functionalised AuNSs
AuNSs(1 mM
(1 mM of of
AuNSs,
AuNSs,
black
black line)
line) andand sandwich-likeconfiguration
sandwich-like configurationofofAgNPs-4ABT-AuNSs
AgNPs-4ABT-AuNSs(0.5 (0.5 mM of AuNSs
AuNSsin inthe
thepresence
presenceofof2525
mg/L
mg/L of PVP-
of
Ag100nm NPs,
PVP-Ag100nm NPs,green line).
green The
line). characteristic
The characteristic peaks
peaksofof4ABT
4ABT(purple
(purpledashed
dashedrectangle,
rectangle,C-H
C-Hring
ringbending
bending11421142cmcm−1−and
1
ring stretching 1077 and 1589 cm −1)
− are
1 shown. The light-grey dashed line indicates the characteristic
and ring stretching 1077 and 1589 cm ) are shown. The light-grey dashed line indicates the characteristic peak of silicon peak of silicon (520
cmcm
(520
−1) that was used as internal standard. AuNSs stability in (d) ultrapure water and (e) artificial seawater is shown. Times
−1 ) that was used as internal standard. AuNSs stability in (d) ultrapure water and (e) artificial seawater is shown.
of 0, 15, and 30 min are represented by black, red, and blue lines, respectively. Black arrows show the wavelength excita-
Times of 0, 15, and 30 min are represented by black, red, and blue lines, respectively. Black arrows show the wavelength
tion source at 785 nm used in SERS analysis.
excitation source at 785 nm used in SERS analysis.
Before
Before performing
performing SERSexperiments,
SERS experiments,we weassessed
assessedthe
thecolloidal
colloidalstability
stability of
of AuNSs
AuNSs in
in order to confirm that the chosen SERS substrate is not affected by the influence of of
order to confirm that the chosen SERS substrate is not affected by the influence thethe
surrounding environment. As explained before, level of aggregation, formation
surrounding environment. As explained before, level of aggregation, formation of hot-spot of hot-
spot regions, and modification of the involved particles could modify SERS
regions, and modification of the involved particles could modify SERS sensitivity also sensitivity
affecting system reproducibility. AuNSs were tested for their colloidal stability in both
ultrapure water and synthetic seawater for a period of time of 30 min, allowing AgNPs
detection. Recorded spectra show how AuNSs are not affected by the surrounding media
and the presence of high ionic strength is not able to modify their initial colloidal stability
(Data are shown in Figure 3d,e).
SERS is a surface-sensitive technique and, by coupling metallic surfaces with a reporter
molecule, it is possible to increase not only the sensitivity but also the specificity toward the
interested analyte. We then functionalized AuNSs with 4ABT, which is able to form a self-
assembled monolayer (SAM) on the Au surface by forming S-Au bond. As a consequence,both ultrapure water and synthetic seawater for a period of time of 30 min, allowing
AgNPs detection. Recorded spectra show how AuNSs are not affected by the surrounding
media and the presence of high ionic strength is not able to modify their initial colloidal
stability (Data are shown in Figure 3d,e).
Nanomaterials 2021, 11, 1711
SERS is a surface-sensitive technique and, by coupling metallic surfaces with 8aofre- 13
porter molecule, it is possible to increase not only the sensitivity but also the specificity
toward the interested analyte. We then functionalized AuNSs with 4ABT, which is able to
form a self-assembled monolayer (SAM) on the Au surface by forming S-Au bond. As a
a strong SERSa signal
consequence, strong in
SERSsuspension (i.e., average
signal in suspension SERS)
(i.e., wasSERS)
average recorded
was (Figure
recorded 3c,(Figure
black
spectrum)
3c, [43].
black spectrum) [43].
This average SERS spectrum −1
spectrum displays
displays three
threepeaks
peaksat at1589,
1589,1077,
1077,and
and390
390cmcm−1, which
correspond to
correspond to ring
ring stretching
stretching vibrations.
vibrations. The The amine
amine group
group ofof 4ABT,
4ABT, inin para-substitution,
para-substitution,
has a strong interaction with Ag surface, allowing a specific detection of of
has a strong interaction with Ag surface, allowing a specific detection AgNPs.
AgNPs. This This
in-
interaction
teraction between
between thetheamine
aminegroupgroupand andAgNPs
AgNPsgenerated
generatedvery very clear
clear changes
changes inin SERS
SERS
spectrum of
spectrum of 4ABT
4ABT (Figure
(Figure 3c,3c, green
green spectrum).
spectrum). Apart
Apart from
from the
the obvious
obvious enhancement
enhancement of of
the SERS intensity, four additional peaks are observed: 1142, 1175, 1390, and 1431 cm −1
the SERS intensity, four additional peaks are observed: 1142, 1175, 1390, and 1431 cm−1
that correspond
that correspond to to C-H
C-H ring
ring bending
bending vibrations. Despite its
vibrations. Despite its extensive
extensive use
use in
in SERS,
SERS, it it is
is
common to consider p-ABT as a molecule with an abnormal
common to consider p-ABT as a molecule with an abnormal enhancement mechanism de- enhancement mechanism
depending
pending onon both
both substrates
substrates (i.e.,
(i.e., AuAu andandAg)Ag)
andand
usedused experimental
experimental conditions
conditions [26,27].
[26,27]. In
this case, our system could be considered, which forms a sandwich-like configuration of
In this case, our system could be considered, which forms a sandwich-like configuration of
AuNSs-4ABT-AgNPs (see Figure 4a) and the selective enhancement
AuNSs-4ABT-AgNPs (see Figure 4a) and the selective enhancement of those peaks can be of those peaks can be
associated with
associated with the
the charge
charge transfer
transfer mechanism (i.e., charge
mechanism (i.e., charge transfer
transfer between
between both
both metal
metal
NPs coupled with the vibrations of 4ABT), as reported by Zhou et al. [43].
NPs coupled with the vibrations of 4ABT), as reported by Zhou et al. [43].
Figure
Figure 4. TEM images
4. TEM images of
of AgNPs-4ABT-AuNSs
AgNPs-4ABT-AuNSs interaction.
interaction. (a)
(a) PVP-Ag15nm
PVP-Ag15nm NPs,
NPs, (b)
(b) PVP-Ag50–80nm
PVP-Ag50–80nm NPs,
NPs, and
and (c)
(c) PVP-
PVP-
Ag100nm NPs in ultrapure water. Scale bar of 200 nm. Yellow arrows point AgNPs.
NPs in ultrapure water. Scale bar of 200 nm. Yellow arrows point AgNPs.
In this
In this work,
work, we
we proposed
proposed anan indirect
indirect detection
detection based
based on on changes
changes in in the
the 4ABT
4ABT SERS
SERS
signal in presence of AgNPs. We chose this indirect SERS strategy because it increases the
signal in presence of AgNPs. We chose this indirect SERS strategy because it increases the
selectivity by
selectivity by covalent
covalentinteraction
interactionofofthe amino
the amino group
group andand
AgAg surface andand
surface the enhancement
the enhance-
of SERS
ment signalsignal
of SERS produced by theby
produced formation of sandwich-like
the formation configuration
of sandwich-like AgNPs-4ABT-
configuration AgNPs-
AuNSs can be correlated with the AgNPs concentration. The
4ABT-AuNSs can be correlated with the AgNPs concentration. The correlation correlation among
amongsilver
sil-
concentrations was determined by the analysis of the band at ~1080 cm −1 , the one supposed
ver concentrations was determined by the analysis of the band at ~1080 cm−1, the one sup-
to arise from electromagnetic field enhancement coupled with chemical enhancement [44].
posed to arise from electromagnetic field enhancement coupled with chemical enhance-
The in-suspension SERS analysis was performed (i.e., the measurements were done in
ment [44]. The in-suspension SERS analysis was performed (i.e., the measurements were
liquid) and all integrated areas under the 1080 cm−1 peak were normalized with respect
done in liquid) and all integrated areas under the 1080 cm −1 peak were normalized with
to those of silicon wafers (520 cm−1 ) used for support and internal standard. For an
respect to those of silicon wafers (520 cm−1) used for support and internal standard. For an
on-field monitoring application, this average SERS strategy should be implemented into
on-field monitoring application, this average SERS strategy should be implemented into
a portable system. Thus, average SERS spectra of 4ABT on AuNSs in the presence of
a portable system. Thus, average SERS spectra of 4ABT on AuNSs in the presence of dif-
different concentration of PVP-15nmAg NPs with a portable Raman system and a confocal
ferent concentration of PVP-15nmAg NPs with a portable Raman system and a confocal
Raman system with a 10× objective were acquired to compare the performance. The
Raman system with a 10× objective were acquired to compare the performance. The SERS
SERS measurements were carried out both in ultrapure water, as a control medium, and
artificial seawater. Figure 5a and Figure S4c show the calibration curve, where the error
bars indicate standard deviations from three independent experiments, obtained in both
media (ultrapure water, in green, and artificial seawater, in red) and using the two Raman
systems. For both ultrapure water and seawater, the plot of the ratio between the areas
under the peaks at 1080 and 520 cm−1 against AgNPs concentration showed a good linear
correlation with r2 values of 0.8464 (ultrapure water) and 0.9403 (seawater) for portable
Raman system and 0.9162 and 0.9137 for confocal Raman system, when PVP-Ag15nm
NPs were analyzed. The limit of detection (LoD) was calculated from the sensitivity of
the calibration curve using the equation 3.3 SDy/a, where SDy is the standard deviation(ultrapure water, in green, and artificial seawater, in red) and using the two Raman sys-
tems. For both ultrapure water and seawater, the plot of the ratio between the areas under
the peaks at 1080 and 520 cm−1 against AgNPs concentration showed a good linear corre-
lation with r2 values of 0.8464 (ultrapure water) and 0.9403 (seawater) for portable Raman
Nanomaterials 2021, 11, 1711 system and 0.9162 and 0.9137 for confocal Raman system, when PVP-Ag15nm NPs9 were of 13
analyzed. The limit of detection (LoD) was calculated from the sensitivity of the calibra-
tion curve using the equation 3.3 SDy/a, where SDy is the standard deviation of the re-
sponse of the curve and a is the slope of the calibration curve. LoD values were similar for
of the response of the curve and a is the slope of the calibration curve. LoD values were
both the media and the two Raman systems: 3.08 ± 1.47 (ultrapure water) and 2.15 ± 1.22
similar for both the media and the two Raman systems: 3.08 ± 1.47 (ultrapure water) and
mg/L (seawater) for the portable Raman system and 3.12 ± 2.28 (ultrapure water) and 2.17
2.15 ± 1.22 mg/L (seawater) for the portable Raman system and 3.12 ± 2.28 (ultrapure
± 0.93 mg/L for the confocal Raman system. The similar performance shown for both sys-
water) and 2.17 ± 0.93 mg/L for the confocal Raman system. The similar performance
tems can be explained by the fact that we selected an average SERS strategy (i.e., in liquid)
shown for both systems can be explained by the fact that we selected an average SERS
for AgNPs detection, and therefore we did not take advantage of the better spatial reso-
strategy (i.e., in liquid) for AgNPs detection, and therefore we did not take advantage of
lution of the confocal Raman system.
the better spatial resolution of the confocal Raman system.
Figure5.5.Calibration
Figure Calibrationcurve
curveofof(a)
(a)PVP-15nmAg
PVP-15nmAgNPs, NPs,(b)(b)PVP-50–80nmAg
PVP-50–80nmAgNPs,
NPs,and
and(c)
(c)PVP-100nmAg
PVP-100nmAgNPs
NPsdetection
detectioninin
ultrapure
ultrapurewater
water(green
(greenline)
line)and
andartificial
artificialseawater
seawater(red
(redline).
line).
We
Weperformed
performedSERS SERSanalysis
analysisabout
aboutthethepossible
possibleeffect
effectof ofthe
theparticle
particle size
size and
and aggre-
aggre-
gation
gation degree of AgNPs using only the portable Raman system. Thus, we carried outout
degree of AgNPs using only the portable Raman system. Thus, we carried the
the set of SERS measurements using the same conditions as before
set of SERS measurements using the same conditions as before for PVP-15nmAg NPs, for PVP-15nmAg NPs,
PVP-100nmAg
PVP-100nmAgNPs, NPs,and
andPVP-50–80nmAg
PVP-50–80nmAgNPs. NPs.Figure
Figure55shows
showsthe thecalibration
calibrationcurves
curvesfor for
PVP-50–80nmAg
PVP-50–80nmAg NPs (b) and PVP-100nmAg NPs (c) obtained in both ultrapurewater
NPs (b) and PVP-100nmAg NPs (c) obtained in both ultrapure water
and 2 of
and artificial seawater. AAbetter
artificial seawater. better
fitfit
was was obtained
obtained related
related to PVP-100nmAg
to PVP-100nmAg NPs (rNPs
2
2 of (r
0.9631
0.9631 in ultrapure water and 0.9636 in seawater) and PVP-50–80nmAg NPs (r of 0.9959
in ultrapure water and 0.9636 in seawater) and PVP-50–80nmAg NPs (r2 of 0.9959 in ul-
in ultrapure water and 0.9539 in seawater). This is probably due to the better coupling
trapure water and 0.9539 in seawater). This is probably due to the better coupling of the
of the LSPR band (see Figure 2b,c) to the 785 nm excitation wavelength and the higher
LSPR band (see Figure 2b,c) to the 785 nm excitation wavelength and the higher local
local electromagnetic field generated from NPs with bigger size [45]. However, similar
electromagnetic field generated from NPs with bigger size [45]. However, similar LoD
LoD values were obtained in ultrapure water: 2.28 ± 1.46 mg/L for PVP-100nmAg NPs
values were obtained in ultrapure water: 2.28 ± 1.46 mg/L for PVP-100nmAg NPs and 3.75
and 3.75 ± 1.00 mg/L for PVP-50–80nmAg NPs, which may be related to AgNPs-4ABT-
± 1.00 mg/L for PVP-50–80nmAg NPs, which may be related to AgNPs-4ABT-AuNSs
AuNSs sandwich-like configuration (see Figure 4b,c). The enhancement is produced in
sandwich-like configuration (see Figure 4, b and c). The enhancement is produced in the
the gap between AuNSs and AgNPs and non-all surface area of AgNPs is covered by
gap between AuNSs and AgNPs and non-all surface area of AgNPs is covered by 4ABT.
4ABT. Interestingly, we observed different behavior of the detection in seawater. The LoD
Interestingly, we observed different behavior of the detection in seawater. The LoD values
values were similar for AgNPs that remained colloidally stable in seawater (see Figure 2,
were similar for AgNPs that remained colloidally stable in seawater (see Figure 2, Table 1
Table 1 and Table S2), i.e., PVP-15nmAg NPs (LoD = 2.15 ± 1.22 mg/L) and PVP-100nmAg
and 1.51
NPs S2), ±i.e., PVP-15nmAg
0.71 mg/L), while NPs
LoD(LoD
for Ag= 2.15 ± 1.22 mg/L)
aggregates and 4-fold
increased PVP-100nmAg NPs
(6.08 ± 1.21 1.51 ±
mg/L),
0.71 mg/L), while
demonstrating thatLoD for Ag aggregates
aggregation increasedhigh
has an extremely 4-fold (6.08 ±on
impact 1.21
themg/L), demonstrat-
sensitivity of our
ing that aggregation has an extremely high impact on the sensitivity of
average SERS approach. This can be explained in terms of decreasing the available surface our average SERS
area that interacts with 4ABT-AuNSs (see Figure 4b). Nonetheless, the integration ofin-
approach. This can be explained in terms of decreasing the available surface area that a
teracts with 4ABT-AuNSs
pre-concentration step will(see
be Figure 4b). Nonetheless,
a considerable improvement the integration
to bring theof adetection
pre-concentra-
level
tion step
down will
to an be aof
order considerable
magnitude improvement to bring the detection
relevant to environmental level down
concentrations [46]. to an order
of magnitude relevant to environmental concentrations [46].
4. Discussion
Herein, we have designed an average SERS (i.e., in-suspension SERS) strategy for
the detection of PVP-coated AgNPs in artificial seawater using a portable Raman system.
We selected 4ABT as a chemoreceptor to trap the AgNPs, which was already used as an
SERS reporter for AgNPs detection in dietary supplement products and nasal spray [47].
However, higher AgNPs concentrations were used (20 mg/L) and a microRaman spec-
trometer was used for detection. In this study, the main aim was to design a detection
system that could be implemented in a portable Raman system, allowing its future use for
point-of-care monitoring, despite the initial limitations of those systems such as less spatial
resolution, less sensitivity, less reproducibility, and lower control of emission losses. To thisNanomaterials 2021, 11, 1711 10 of 13
aim, we performed the measurement in a suspension [48] and used a silicon wafer as an
internal standard, which helped in overcoming those limitations. This, together with the
short time for analysis and being a non-destructive technique, makes SERS a promising
approach for the detection of AgNPs traces in the aquatic environment, regardless of size
and particles aggregation. With this in-suspension SERS strategy, it was possible to detect
a concentration of AgNPs down to 1.51 ± 0.71 mg/L. The sensitivity was affected by the
aggregation of AgNPs, increasing to almost 4-fold in the LoD when NPs were aggregated.
It is important to note that despite the high demand for portable systems that can
detect and characterize these new emerging nanocontaminants, the innovation of these
portable systems has been focused on the detection of nanoplastics [15,49] and pathogens
at nanoscale (e.g., virus) [50]. This could be because of the wide variety of plastics found
in the ocean at a high concentration: 11.6–21.1 million tons in the Atlantic Ocean [51].
However, the effort of the development of these portable systems should also address
the detection of engineered inorganic nanoparticles (EINPs) in the aquatic system. The
predicted environmental concentration (PEC) for these EINPs covers a wide range from the
highest PEC for titanium dioxide NPs in the scale of mg/L [22] to a concentration of ng/L of
total silver for AgNPs [46]. Taking into account the PEC for AgNPs to be able to implement
our average SERS methods, a pre-concentration step must be integrated. The utilization
of solid phase extraction [52] or cloud point extraction [53] has been reported for this
purpose; however, these were coupled to “non-portable” analytical methods: Flame atomic
absorption spectrometry and inductively coupled plasma mass spectrometry, respectively.
Despite the appeal of this strategy, important challenges hinder the implementation of
the portable sensors based on SERS: (1) The transformation of these nanocontaminants as
a function of chemical transformation (e.g., aggregation or dissolution and (2) the matrix
interferences (e.g., sulfidation), organic matter or the presence of others plasmonic NPs),
which compromise the robustness, selectivity, and sensitivity of the SERS-based method.
In the case of the effect of AgNPs transformation, we already demonstrated the negative
impact of aggregation on the SERS strategy increasing the LoD4-fold. The dissolution could
apparently have less impact since the variation of the sensitivity of the method as a function
of the size was minimal (PVP-15nmAg NPs LoD 2.15 ± 1.22 mg/L and PVP-100nmAg
NPs LoD 1.51 ± 0.71 mg/L). The formation of Ag2 S from the sulfidation of AgNPs in
seawater [54] would have an important impact on the SERS enhancement, which does not
mean “a decrease in the signal”. The contributions of charge-transfer in the SERS effect of
Ag and Ag2 S NPs are different, being higher in the case of Ag2 S as reported by Fu et al. [55].
Moreover, other noble metal NPs that could be released into the environment at significant
concentrations would be platinum, palladium, or copper NPs from the catalysis industry
and the wood preservation industry. Therefore, we cannot rule out their interference in
the detection system and the calibration curves for AgNPs detection must be performed
in the presence of these NPs (including Ag2 S). It is then possible that mixed signals will
be obtained with the added contribution of several types of plasmonic NPs preventing
the exact identification; however, in this case, we may be able to extract a correlation in
terms of “AgNPs equivalents”, which would nevertheless have high impact as an early
warning system.
Given the promising results, the next steps will be to develop a portable device
involving a sample preparation module coupled with the SERS-based detection module in
order to reduce the challenges presented by on real samples, reduce the lack of specificity
and noise, and increase the robustness of these sensors.
Supplementary Materials: The following are available online at https://www.mdpi.com/article/10
.3390/nano11071711/s1, Figure S1: Characterization of physicochemical properties of AgNPs with a
diameter of 100 nm as a function of each purification and functionalization step; Figure S2: Spectral
evolution of optical absorbance and hydrodynamic size evolution of PVP-15nmAg NPs (upper line)
and PVP-100nmAg NPs; Figure S3: Physicochemical characterization of spherical AuNPs with a
diameter of 15 nm; and Figure S4: SERS analysis of PVP-15nmAgNPs dispersed in both ultrapure
water and artificial seawater using a confocal Raman microscope.Nanomaterials 2021, 11, 1711 11 of 13
Author Contributions: Conceptualization L.R.-L.; funding acquisition B.E.; investigation M.Q., I.P.,
A.V., and L.R.-L.; writing—original draft preparation M.Q. and L.R.-L.; writing—review and editing,
M.Q., I.P., A.V., L.R.-L., and B.E. All authors have read and agreed to the published version of
the manuscript.
Funding: This research was funded by NANOCULTURE Interreg Atlantic Area project (EAPA_590/2018)
and ACUINANO Interreg POCTEP project (code 1843). L.R.-L. acknowledges funding to FCT (Fundação
para a Ciência e Technologia) for the Scientific Employment Stimulus Program (2020.04021.CEECIND).
Institutional Review Board Statement: Not applicable.
Informed Consent Statement: Not applicable.
Data Availability Statement: The data presented in this study are available on request from the
corresponding author. The data are not publicly available due to the database is still developing and
the public access is still limited.
Acknowledgments: We thanks the Advanced Electron microscopy (AEMIS) and Nanophotonics &
Bioimagins facilities and staff for their contribution to this publication.
Conflicts of Interest: The authors declare no conflict of interest.
References
1. Auría-Soro, C.; Nesma, T.; Juanes-Velasco, P.; Landeira-Viñuela, A.; Fidalgo-Gomez, H.; Acebes-Fernandez, V.; Gongora, R.; Parra,
M.J.A.; Manzano-Roman, R.; Fuentes, M. Interactions of nanoparticles and biosystems: Microenvironment of nanoparticles and
biomolecules in nanomedicine. Nanomaterials 2019, 9, 1365. [CrossRef]
2. Sarfraz, J.; Gulin-Sarfraz, T.; Nilsen-Nygaard, J.; Pettersen, M.K. Nanocomposites for food packaging applications: An overview.
Nanomaterials 2021, 11, 10. [CrossRef] [PubMed]
3. Wang, H.; Thorling, C.A.; Liang, X.; Bridle, K.R.; Grice, J.E.; Zhu, Y.; Crawford, D.H.G.; Xu, Z.P.; Liu, X.; Roberts, M.S. Diagnostic
imaging and therapeutic application of nanoparticles targeting the liver. J. Mater. Chem. B 2015, 3, 939–958. [CrossRef]
4. Otsuka, H.; Nagasaki, Y.; Kataoka, K. PEGylated nanoparticles for biological and pharmaceutical applications. Adv. Drug Deliv.
Rev. 2003, 55, 403–419. [CrossRef]
5. Fabrega, J.; Luoma, S.N.; Tyler, C.R.; Galloway, T.S.; Lead, J.R. Silver nanoparticles: Behaviour and effects in the aquatic
environment. Environ. Int. 2011, 37, 517–531. [CrossRef] [PubMed]
6. Benn, T.M.; Westerhoff, P. Nanoparticle silver released into water from commercially available sock fabrics. Environ. Sci. Technol.
2008, 42, 4133–4139. [CrossRef] [PubMed]
7. Geranio, L.; Heuberger, M.; Nowack, B. The behavior of silver nanotextiles during washing. Environ. Sci. Technol. 2009, 43,
8113–8118. [CrossRef]
8. Tortella, G.R.; Rubilar, O.; Durán, N.; Diez, M.C.; Martínez, M.; Parada, J.; Seabra, A.B. Silver nanoparticles: Toxicity in model
organisms as an overview of its hazard for human health and the environment. J. Hazard. Mater. 2020, 390, 121974. [CrossRef]
9. Ricardo, A.I.C.; Fariñas, N.R.; Bernardo, F.J.G.; Martín-Doimeadios, R.C.R.; Ríos, Á. Screening-confirmation strategy for nanoma-
terials involving spectroscopic analytical techniques and its application to the control of silver nanoparticles in pastry samples.
Spectrochim. Acta Part A Mol. Biomol. Spectrosc. 2021, 246, 119015. [CrossRef] [PubMed]
10. Culková, E.; Lukáčová-Chomisteková, Z.; Bellová, R.; Melicherčíková, D.; Durdiak, J.; Rievaj, M.; Vojs, M.; Tomčík, P. Voltammetric
detection of silver in commercial products on boron doped diamond electrode: Stripping at lowered potential in the presence of
thiosulfate ions. Mon. Chem. 2020, 151, 1009–1017. [CrossRef]
11. Laborda, F.; Bolea, E.; Cepriá, G.; Gómez, M.T.; Jiménez, M.S.; Pérez-Arantegui, J.; Castillo, J.R. Detection, characterization and
quantification of inorganic engineered nanomaterials: A review of techniques and methodological approaches for the analysis of
complex samples. Anal. Chim. Acta 2016, 904, 10–32. [CrossRef] [PubMed]
12. Mahdi, K.N.M.; Peters, R.J.B.; Klumpp, E.; Bohme, S.; van der Ploeg, M.; Ritsema, C.; Geissen, V. Silver nanoparticles in soil:
Aqueous extraction combined with single-particle ICP-MS for detection and characterization. Environ. Nanotechnol. Monit. Manag.
2017, 7, 24–33. [CrossRef]
13. Yang, Y.; Long, C.L.; Li, H.P.; Wang, Q.; Yang, Z.G. Analysis of silver and gold nanoparticles in environmental water using single
particle-inductively coupled plasma-mass spectrometry. Sci. Total Environ. 2016, 563–564, 996–1007. [CrossRef] [PubMed]
14. Ramos, K.; Gómez-Gómez, M.M.; Cámara, C.; Ramos, L. Silver speciation and characterization of nanoparticles released from
plastic food containers by single particle ICPMS. Talanta 2016, 151, 83–90. [CrossRef] [PubMed]
15. Asamoah, B.O.; Kanyathare, B.; Roussey, M.; Peiponen, K.E. A prototype of a portable optical sensor for the detection of
transparent and translucent microplastics in freshwater. Chemosphere 2019, 231, 161–167. [CrossRef] [PubMed]
16. Wu, M.; Zhang, C.; Ji, Y.; Tian, Y.; Wei, H.; Li, C.; Li, Z.; Zhu, T.; Sun, Q.; Man, B.; et al. 3D Ultrasensitive Polymers-Plasmonic
Hybrid Flexible Platform for In-Situ Detection. Polymers 2020, 12, 392. [CrossRef] [PubMed]
17. Willner, M.R.; Vikesland, P.J. Nanomaterial enabled sensors for environmental contaminants. J. Nanobiotechnol. 2018, 16, 1–16.
[CrossRef]You can also read