WORKING PAPER NO: 381 - Reliability of agricultural statistics in developing countries: Reflections from a comprehensive village survey on crop ...
←
→
Page content transcription
If your browser does not render page correctly, please read the page content below
WORKING PAPER NO: 381

     Reliability of agricultural statistics in developing countries:
    Reflections from a comprehensive village survey on crop area
                            statistics in India

                                                         Gopal Naik 1
                                                          Professor
                                                Economics & Social Science
                                         Indian Institute of Management Bangalore
                                         Bannerghatta Road, Bangalore – 5600 76
                                                      Ph: 080-26993266
                                                   gopaln@iimb.ernet.in

                                                       K P Basavaraj
                                         Indian Institute of Management Bangalore
                                                      bas@iimb.ernet.in

                                                          V R Hegde
                                              Zoomin Softech, Bangalore, India
                                                vrhegde@zoominsoftech.com

                                                          Vijay Paidi
                                         Indian Institute of Management Bangalore
                                                     vhpaidi@gmail.com

                                                Arjunan Subramanian
                                            University of Glasgow, Glasgow, UK
                                            arjunan.subramanian@glasgow.ac.uk

                                                                                          Year of Publication-November 2012

1
 Corresponding author: Gopal Naik, Professor of Economics and Social Science, Indian Institute of Management Bangalore , Bannerghatta
Road, Bangalore – 5600 76 , Ph: 080-26993266, Email: gopaln@iimb.ernet.in
                                                                  1
Reliability of agricultural statistics in developing countries: Reflections from a
               comprehensive village survey on crop area statistics in India

Abstract

Despite the importance of agriculture in developing countries, and the general recognition of

the need for strengthening data quality, very few studies examine the quality of available data

and the data generation methods in agriculture. In this paper, we use data from an extensive

deployment of geospatial technology, administrated concurrently alongside the conventional

method in the Indian state of Karnataka, to assess the discrepancy between methods in terms

of the magnitude of difference in the crop area, type and number of crops grown. The crop

area estimates based on alternative method, utilising the geospatial technology, exceeded that

from the estimates based on conventional method. Conventional method is unable to respond

quickly to changes in the cropping pattern and therefore, do not record accurately the area

under high value cash crops. This has wider implications for commercializing agriculture and

delivery of farm credit and insurance services in the developing countries. Some research and

policy implications are discussed.

Keywords: Agricultural Statistics, crop area data, data quality, geospatial data

The recent World Development Report on “Agriculture for Development” demonstrates that

agriculture is central to achieving the Millennium Development Goal of poverty reduction

and environmental sustainability (World Bank 2008). Yet, the quality of available data and

the data generation methods in agriculture are notoriously weak in several developing

countries. Although there is a general recognition for long on strengthening data availability

in developing countries (United Nations 1979; World Bank 2011; African Development Bank

Group 2011), surprisingly little research exists examining the reliability of existing data and

                                               2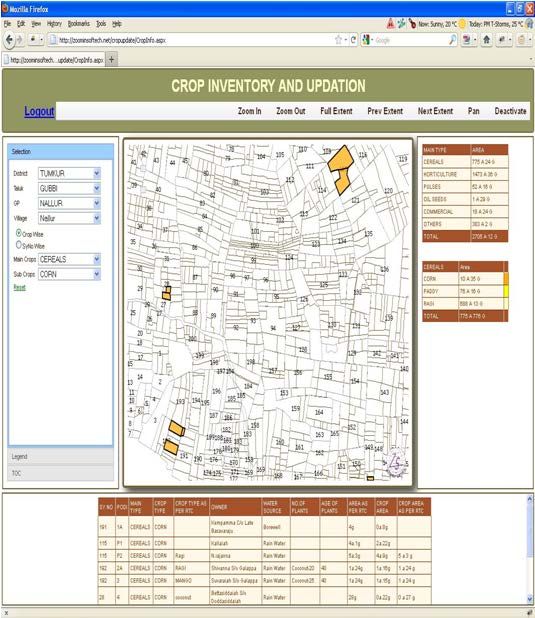
its method of collection (Beegle et al. 2012; Deininger et al. 2012). However, some recent

studies examine the reliability of household consumption data (Sen 2000; Kulshrestha and

Kar 2005; Deaton and Kozel 2005; Caeyers et al. 2012), albeit the production side of

agriculture still remains limited.

We are aware of only two recent contributions, examining the reliability of traditional recall-

based survey method in the generation of agriculture production statistics. The evidence from

these studies are mixed - Beegle et al. (2012) find little evidence of large recall bias in the

agricultural data, while Deininger et al. (2012) note significant differences in the data

generated between recall-based survey and production diaries. However, it is not clear yet

which of these two methods can generate data that is closer to the true value, as the true value

is unlikely to be known.

This article contributes to this emerging literature in examining the reliability of agricultural

statistics, by probing the data quality and data collection methods of the crop area statistics,

which is both measureable and also independently verifiable using existing technology. We

examine the reliability of crop area statistics from India, which has one of the best developed

survey capacity in the world, and a long tradition of collecting data on a range of economic

indicators (Deaton and Kozel 2005). Although Indian consumption data has been subjected to

extensive scrutiny, agricultural statistics has eluded the attention of researchers, especially the

data on crop area statistics. The information on crop area and land use, however, is vital for

effective policy planning and design interventions to fully realize agriculture’s potential

strengths.

In this article, we extend this literature by drawing on the extensive deployment of geospatial

technology in the Indian state of Karnataka to collect crop area statistics in parallel to

applying the contemporary data collection method. Having administered the geospatial
                                          3
technology to the crop area for the same households also included in the conventional

method, we are able to compare the crop area estimates by the two methods.

The analysis here presents some interesting results. First, conventional method, which entails

manually gathering data, does not capture the changing cropping patterns stirred by

commercializing agriculture in a developing country. Comparing area under crops and the

type and number of crops shows considerable discrepancies between both the methods.

Conventional method provides information only for 13 of the 19 crops grown ignoring some

of the vital high value cash crops in transitional agriculture. The crop area using alternative

method significantly differ from estimates based on conventional method (by 56%) suggests

that administrative data on crop area collected routinely are likely to be underestimate. This

could significantly affect the projections of crop production, underestimating the actual

production. The resulting excess production, with no planning on utilisation in place, will

result in rotting food stocks observed recurrently in India (Basu 2010).

Second, conventional method seems appropriate for measuring area under crops with

minimal year-to-year changes such as cereals but not for high value cash crops. The

discrepancies in the area estimates between both methods for some cash crops are over 80%,

for instance arecanut (84%) and tamarind (96%). Changes in the magnitude and direction of

these differences across crops can help identify ways to improve the quality of area statistics.

Third, although the first application of geospatial tool is not cost effective, the cost of

subsequent updating is even lower compared to the conventional method. Several recent

applications of global positioning systems (GPS) in access to infrastructure and social

services (Perry and Gessler 2000; Hong et al. 2006), household leaning (Conley and Udry

2010) and collection of household surveys (Landry and Shen 2005) have been reported, but

improving agricultural statistics have not yet been examined. 1 This article contributes to this
                                               4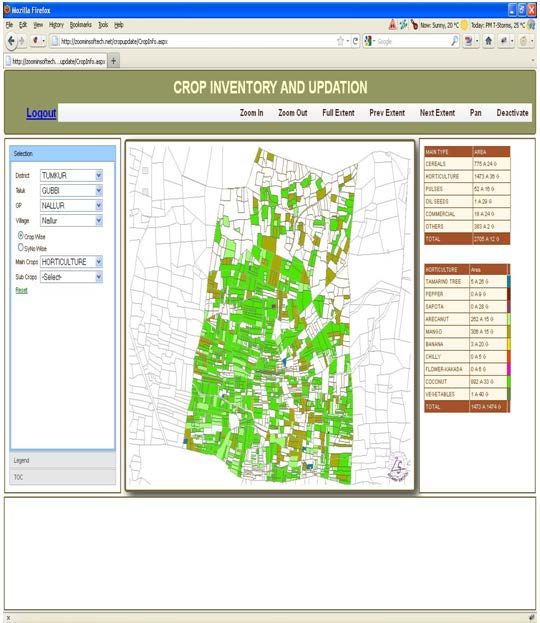
growing literature documenting the importance that GPS/GIS can make to improving

agricultural statistics in developing countries.

The article is structured as follows: next section describes the conventional method used in

the estimation of crop area, highlighting the different challenges that exist using this method.

The following section discusses the two alternative geospatial approaches and examines the

appropriateness of each method. The data collected using the alternative method are

presented in the next section, followed by a section comparing the crop area data collected

using both methods to evaluate the agreement between conventional and alternative methods

in measuring the crop area. The last section presents some concluding observations.

Current approach and challenges

In the current approach, the collection of crop area statistics is assigned to the village level

government functionary known as the patwari or village accountant, who is expected to

provide timely information using conventional method, which involves manually gathering

data about each crop in every village. 2 Traditionally, the village accountant (VA) is the

person responsible for gathering the entire crop information. About 4600 acres of land in one

gram panchayat (GP) is allocated to each VA to collect crop information. 3 In order to

corroborate and systemically document the conventional method, we carried out detailed

interviews with two VA’s from two different GP’s in the Gubbi Taluk – Nallur and

Marashetty Halli, chosen to adequately represent the spatial diversity of the data collection

method. 4 Both interviews with the VA’s were recorded using a voice recorder with prior

permission from the respondents. However, the name and location of the respondents are kept

anonymous here for ethical reasons.

Each VA is assigned to collect crop information from the 4600 acres allocated to him for all

the three seasons in a year. The VA goes to the crop area and visually maps the crop area, and
                                              5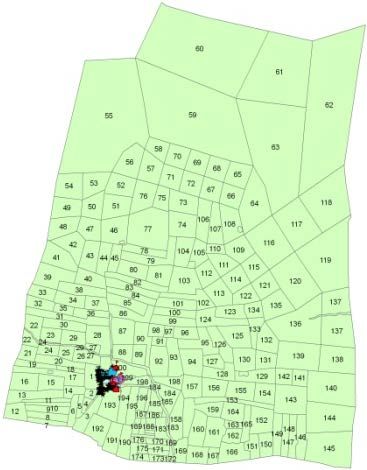
enters all the relevant details into the pahani book (Bhoomi 2012). 5 Pahani or record of

Rights, Tenancy and Crops (RTC) contains details of land ownership, area measurement, soil

type, nature of possession, liabilities, tenancy and crops grown. The VA is required to use

one book for five years to store the details. This registered data is usually verified by the

Revenue Inspector (RI) using previous year’s crop area data. In case of no corrections, the

data is sent back to the VA for further processing. The VA sends the verified data to the

computer center (CC), which in turn sends the data to a private software firm for

digitalization process. The private software firm takes about 20 to 30 days to digitalize and

documents the data into a CD. The CD is given back to the CC for uploading the data on to

an online database called Bhoomi. For illustration, a flow chart describing the conventional

method is presented in the Appendix (Figure A2).

Realistically, considering the VA’s work load, his potential to collect the crop information

can be stretched at most to half of the total allocated area. Moreover, one month time

allocated to complete the data collection process each season also seems inadequate.

Consequently, the major drawback of the conventional method is the lack of quality

information on crops grown. The crop area observed from the RTC for the current season and

yield information, gathered from samples in the crop cutting experiment of the previous

season, is used to estimate the production of crops in the forthcoming season to predict crop

prices. Hence, inaccurate crop area statistics has a direct bearing on the predicted prices,

resulting in false policy making and erroneous procurement process (India’s paradox of

hunger amidst plenty), and thus inadequate preparedness to deal with fluctuating production,

also affecting the farmers directly and significantly.

                                                6
Appropriateness of the Alternative methods

To address the problems in conventional method described in the previous section, this

section considers two available geospatial technologies to improve the quality of crop area

statistics. Apart from describing each method below, we also point out the potential

challenges.

Satellite remote sensing

Remote sensing (RS) is a potential approach for collecting crop area data, crop area

assessment and forecasts. It provides multi-spectral, synoptic and repetitive coverage with

less scope for human intervention in the data generation process, reducing non-sampling

errors. This method can be used for anomaly detection amid high temporal resolution with at

least 5-6 observations per season (Ray et al. 2008). RS technique gathers crop area

information when the crop has sufficiently grown (Srivastava 2011). It can correlate soil

physical properties such as soil water, organic matter and soil texture to spectral reflectance.

It is also capable of integrating biophysical parameters (such as temperature or leaf area

index). This method takes approximately 24-48 hrs to acquire, correct and process the data.

However, time to process a given area depends on the resolution as 1m resolution data takes

more time to cover the area than 60m resolution data. This in turn depends on the type of

satellite used. In Table 1, we list the type of satellites used in the Indian context with their

associated resolutions.

Although this method has been widely used before in many countries 6, the Government of

India (GOI) adopted this method with the launch of the program for Crop Acreage and

Production Estimation (CAPE) in the year 1987, covering all the major cereals, pulses and

oilseeds. Following huge losses in 1998 due to late decision about wheat import, this program

was further strengthened with the commencement of forecasting agricultural output using
                                               7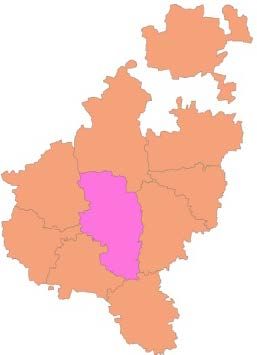
space agro-meteorology and land-based observation (FASAL) in August 2006. FASAL

provides in-season multiple forecasts using weather data, economic factors and land based

observations, and is capable of producing multiple crop forecasts, starting from sowing to the

end of the season (Parihar and Oza 2006). It also has the potential to provide changes in

cropping pattern, soil moisture and rainfall. Key crops covered under the FASAL are rice,

wheat, cotton, sugarcane, rapeseed/mustard, rabi-sorghum, winter-potato and jute.

The satellite image associated with this method, however, has a major drawback of not being

enlarged beyond 1:10000 (Tsiligirides 1997). Timely and reliable crop estimates cannot be

given for areas having persistent cloud cover which blocks the satellite view. However, usage

of Synthetic Aperture Radar (SAR) can identify the crop even during cloud cover. Integration

of optical and SAR images would also increase the accuracy of crop mapping (McNairn et al.

2009). Besides, the accuracy of crop inventory using this method can be further improved

when combined with field surveys (Mehta            2000). However, this method appears

inappropriate in the Indian context owing to the heterogeneous nature of cropping pattern and

small plot sizes (Ray et al. 2008).

Geographical information systems and tools

The second geospatial technology considered here is the integrated approach involving both

the geographical information system (GIS) and the global positioning system (GPS). The

geographical information system (GIS) is an information system used for editing, storing and

displaying geographic coordinates, while GPS is the tool which references the ground data

using longitude and latitude coordinates. Here GIS acts as an interface to visualize geography

in various layers. The coordinates can also be referenced using spatial grid maps; however, it

can only be used if the area is intimately familiar. Since, GIS and GPS technologies were

adaptable and easy to use compared to RS (Nelson et al. 1999), they have been chosen as the

                                              8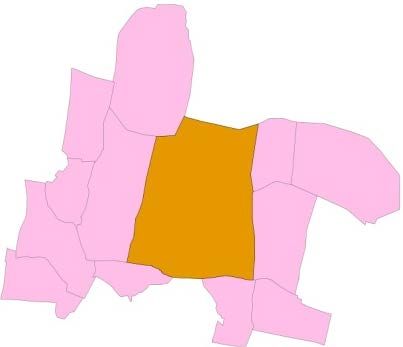
alternative approach for this study. Also due to existence of small crop sizes and mixed crops

in India, GIS/GPS system suites better than RS. Previous instances of successful

experimentation with this technology have already been documented elsewhere. 7

Under this method, an important process improvement is made in order to ensure easy

recording of the data in the subsequent rounds of crop area recording. That is, instead of

traversing each crop area, each farmer demarcated parcel within each survey number 8 is

traversed using a GPS device, along with the owner to record the boundary. Farmer

demarcated parcels are small sub-plots within a survey number created based on topography

in order to take single crop. From season to season and year to year crop in a parcel may

change, but changes in a parcel boundary are rare. This provides a detailed base map for crop

area data collection. For the geospatial application to provide accurate results, it is

recommended that the first survey has to be implemented rigorously by traversing every

single farmer demarcated parcel of land within a survey number. Corresponding irrigation

facilities are also documented using the GPS device. If a single land parcel/ sub-parcel have

more than one crop, the boundary of each crop plot needs to be traced using the GPS device

for recording details of each crop. To improve the accuracy of the data, mapping of the entire

geographical terrain within the village is recommended, including all the survey numbers,

fallow land, scrub land, water streams, roads and water tank/pond. This map is then

superimposed on the cadastral map for authentication. The data from the GPS device is

uploaded to the server through internet whenever possible. For illustration, a flow chart

describing the alternative method is presented in the Appendix (Figure A3).

For this study, a specialized geospatial company Zoomin Softech, developed the application

and designed the knowledge data base using RTC records and village area maps. A seamless

geographic database for understanding disposition of the lands was also developed that

                                              9
contains village, GP, taluk and district boundaries and location of village settlements. The
GIS application developed by Zoomin Softech updates the changes in server and functions as
a Graphical User Interface (GUI) for the user. One advantage with this method is that it
suffices to update and map for only those crop areas that are subject to seasonal flux, keeping
the operational cost of data collection lower in the subsequent rounds.
Comparing alternative approaches
The data collected from interviewing the VA’s are transcribed and interpreted to identify the
processes involved in the conventional method, which is then compared to the alternative
method proposed in this article. The key differences between the methods are briefly
described here and documented in detail in the Appendix (Table A1). The differences in the
processes identified in both these approaches can be classified into three categories: (a)
process of data collection (b) verification of data (c) digitization and dissemination of data.
Process of Data collection
The process of data collection in the alternative approach is completely digitized, reducing
the time for collection and dissemination of information. Under conventional method, crop
area is gathered by the eye-balling technique and recorded manually in the Pahani book. In
the alternative method, the data for crop area is gathered and recorded using a GPS device
traversing the parcel along with the farmer, and then digitally transferring the information to
the database. The automated process in the alternative method helps secure the accuracy of
the data. Adequate provision of recording the corresponding irrigation facilities are also
available under the alternative method.
10Verification of data
The data collected in the conventional method is verified by the Revenue Inspector (RI) using
previous RTC records. In the case of alternative method, the data is verified by comparing the
digitized RTC records with the owner of the crop area while traversing.
Digitization and dissemination of data
The digitization of the crop area gathered by the VA using conventional approach takes about
20-30 days. However, in the alternate approach the process of data collection is digitized
using GPS device, and the data uploaded to server instantaneously through internet. The other
drawback in the conventional approach is the lack of a GUI in displaying crop area
information. The GIS application gives micro details of the crop area data and this facilitates
accurate crop area forecast.
Data
The geospatial crop area survey for this study using the GIS/GPS technology was carried out
in partnership with the specialized geospatial company Zoomin Softech. Zoomin Softech
assisted us in gathering and storing the crop information in about 2700 acres of land area,
covering the entire Nallur village in the Indian state of Karnataka. This is a typical village
located in the Nallur GP of the Gubbi taluk in Tumkur district with a total population of
about 1645. This medium size village has a mix of irrigated and dry crops, different land size
holdings and diverse occupational structure. A detailed map with survey number of each plot
of land in the Nallur village is presented in the appendix (Figure A1) along with the other
maps aggregating to the Karnataka State. Apart from mapping crop area, the survey also
included fallow land, scrub land, water streams, roads, water tanks/ponds and habitation.
11Due to the soaring cost of the first survey and limited budget, we limit the geospatial survey
to one single village, however, implemented rigorously by comprehensively traversing every
single plot of land within the Nallur village. It is the implementation of the first survey that is
expensive, but the cost of subsequent updating is lower. Surprisingly, this cost of subsequent
updating is even lower than the cost of using conventional method (see appendix Table A1
for cost comparison under both methods).
Large scale print of the Nallur village map and the village land register for the Nallur GP was
obtained from the Department of Planning, Karnataka State. Crop inventory as available in
the RTC on January 2011 was also collected. The owner of the crop area was requested to
show and walk along the boundary of his/her land. The field crew also walked along the
boundary of the parcel with the GPS device. When the traverse was closed, the details were
recorded and crop grown identified. The source of water supply for irrigation was also noted
and the structure if any (i.e. bore well/open well/ canal) was located with the GPS device. 9
Using the GIS application developed by Zoomin Softech, information for each parcel of land
was populated with information on the land ownership, crop area and the type grown,
irrigation facility and survey number. The field notes used by Zoomin Softech were used to
identify the design, development and implementation of the geospatial survey. These field
data were corroborated and supplemented with information collected from the interviews
with the village accountant.
Results
This section compares the crop area data collected using the alternative method (GIS/GPS
technologies) with the administrative data collected by the conventional method (RTC
records) described previously.
12Comparing methods of measurement
As Table 2 illustrates, 19 crops are grown in total with only 13 listed in the RTC, covering on
average only 42% of the total number of plots under conventional method. Note that the crop
area information for both methods presented in the same table is not based on matching the
plot wise information reported under each method. For some of the major crops grown,
comparing column 3 and column 6 of Table 2 shows that the conventional method covers
only 63% and 47% of the total number of plots for coconut and finger millet, respectively.
The worst coverage is for arecanut (10%) and mango (34%). As is typical in agriculture in
many developing countries, most farmers cultivate a mix of both subsistence and cash crops
with a portfolio of short duration and long duration crops. The rest of the analysis presented
below is based on plot wise matching of the crop area data reported under both methods.
Although the overall difference in the total crop area estimates between both methods is 56%,
the discrepancies depend on the type of crops grown. The differences in crop area estimated
for each crop using conventional and alternative methods are presented in Figure 1. The
differences, reported here in acres, are measured for each crop along the ray from the centre.
The differences are negligible for some crops like groundnut, eucalyptus, chilly, beans,
banana, teak, pepper, flower, beetle leaf, tamarind, sapodilla and sorghum. However, these in
total constitute an insignificant crop area of 2.5% and 1.6% of the total crop area estimated
from conventional and alternative methods, respectively.
The Figure 1 shows that the largest absolute difference in crop area (54%) estimates between
the methods is for finger millet. This short duration staple crop constitutes about 30% of the
total crop area. For coconut, the under estimates by the conventional method is somewhat
lower (27 percent), however, this crop constitutes a larger area of about 38% of the total crop
13area. The other crops that show considerable difference in estimates between the methods are
for arecanut and mango.
Note that except for finger millet, all the other crops showing considerable divergence in the
area estimates between the methods are for high value long duration cash crop. Since these
cash crops constitute about 63% of the total crop area, it is paramount to investigate the
reasons for divergence. This is surprising, given that long duration crop can be easily
predictable using conventional method as they remain planted for several years, while short
duration crops could potentially vary between seasons. However, discussion with farmers
pointed to the changing cropping pattern as the key reason. Over the years, the crop area
under all the three cash crops has expanded, while the area under finger millet has contracted.
These changing cropping patterns, not captured and reflected in the administrative data
collected using conventional method, have wider implications for availing crop loan and crop
insurance, and also could potentially pose serious threat to food security.
The amount of credit a farmer can get from formal financial institutions depends on the area
under each crop and the estimated cost of cultivation. Cash crops generally require larger
amount of credit than the food crops. Under-recording of cash crop areas in RTC will limit
the credit availability to farmers. Similarly, insurance coverage and premium to be paid is
specific to crops. Inaccurate recording of the crop area makes it difficult to offer crop
insurance to farmers due to which the insurance agency mainly focus on farmers who have
availed credit from formal institutions such as banks and cooperative societies. Offering crop
insurance to farmers who have availed credit from other sources involves additional cost to
the agency for physical verification of the crop areas and therefore, these farmers generally
are not covered by the insurance companies. Ironically, such farmers are small and marginal
farmers, who need the insurance the most.
14A comparison of crop area between methods shows that conventional method, in general,
underestimates crop area and is not appropriate for capturing the changing cropping pattern.
This is an enormous concern for a developing country with its agriculture sector in transition
towards commercialization and adoption of high value crops. Are the differences in crop area
estimates from the two methods statistically significant? In the next section, we examine this
question using the Bland-Altman approach, used extensively for methods comparison in the
medical and biological sciences literature (Bland and Altman 1986; Euser et al. 2005), to
evaluate the agreement between the conventional and alternative measurement methods. The
key emphasis of this approach with no parallels in the economics literature is on a direct
comparison of the results obtained by the different methods. The aim of the following section
is to examine whether low cost conventional method is comparable to the expensive
alternative method (first geospatial survey), to the extent that one might replace the other
with sufficient accuracy in measuring the area under each cultivated crop.
The Bland-Altman method
The Bland-Altman approach (Bland and Altman 1983; Bland and Altman 2012) deployed
here to test the agreement between both methods of measurement can be represented as
follows:
= + + N(0, )
with denoting measurement by method m on land parcel i. Here m signify two methods
of measuring crop area (i) conventional method c and (ii) alternative method a. The
difference in measurement between the methods, = - being identically distributed
with mean and variance , independent of the averages if = or r = 0,
where r is the correlation between mean and variance. The Bland-Altman plot between and
15is used to inspect visually whether the difference and its variance is constant as a function
of the average. From this plot, it is much easier to assess the magnitude of the disagreement,
spot outliers, and see whether there is any trend. If the measurements from both methods are
comparable (agree), the differences should be small and centred around zero, showing no
systematic variation with the mean of the measurement pairs.
The Bland-Altman analysis is supplemented with a more formal test, Pitman’s test of
difference in variance (Pitman 1939; Snedecor and Cochran 1967), comparing two correlated
variances in paired samples to test the agreement between conventional and alternative
methods for measuring the crop area. The results from this test are reported in Table 3 for all
the crops.
The Bland-Altman plot for the total crop area (All crops) presented in Figure 2 shows the
presence of outliers, and existence of association between the difference and the size of the
measurements. The log transformation did not alter the results considerably. The plot displays
considerable lack of agreement between the conventional and alternative methods, with
discrepancies stretching the limits of agreement (-2.1 and 2.9) beyond acceptable levels
(Table 3 column 3). The limits of agreement are not small enough for us to be confident that
the conventional method can be used in place of the alternative method. The results from the
test of independence (null hypothesis of r = 0), presented in Table 3 column 4 and 5, shows a
significant relationship between the methods difference and the size of measurement (r =
0.21, p = 0.00). It confirms the lack of agreement between the methods for All crops (last row
in Table 3).
Similar results are also observed for all the long duration high value crops - arecanut, coconut
and mango. The bias, shown by the mean difference in Table 3 column 1, is the largest for
arecanut with 0.81, while a lower r (r = 0.12, p < 0.10) is observed for coconut (Table 3
16column 4 and column 5), however, significant only at 10% level. For all the three high value
crops, the mean differences indicate a significant bias in crop area estimation from the
conventional method (observed in Figures 3, 4 and 6 and also confirmed in Table 3 column
1) and lack of agreement between the methods (Table 3 column 4 and column 5).
As also noted in the previous section, somewhat surprising are the results for the short
duration staple crops – sorghum, paddy and finger millet, reported in Figures 5, 7 and 8,
respectively, and also in Table 3. The mean difference of 0.05 for paddy reported in Figure 6
and also in Table 3 column 1 shows negligible bias. The mean differences for sorghum and
finger millet (Table 3 column 1), however, are beyond acceptable levels, indicating
underestimation of the crop area by the conventional method in comparison to the alternative
method. However, the Pitman’s test showed no significant difference between variances in
the conventional and alternative method for all the three crops (Table 3 column 4 and 5),
accepting the null hypothesis of no correlation between the methods difference and the size of
measurement, hence, demonstrating good agreement between the two methods.
Concluding discussion
Despite the significance of agriculture in developing countries and the general recognition of
improving agriculture and rural statistics in these countries, surprisingly little research on this
topic exists. This article contributes to this literature by focusing on how agricultural statistics
can be strengthened in developing countries using new geospatial tools taking the case of
rural Karnataka in India. We implemented a comprehensive survey of crop area using the
GPS/GIS tools in parallel to the conventional method to document any differences between
the methods in the crop area estimates for the same plots of land.
India has a long-standing tradition of generating comprehensive crop area and land use
statistics using a decentralized village level agency with little systematic evaluation of the
17data generated. However, new technologies offer the potential to improve measurement by
rigorously evaluating the data, considered by many Indian policy makers as folk wisdom.
Results presented here suggests that conventional method do not seem to capture the
changing cropping patterns stirred by commercializing agriculture in developing countries,
however, seems appropriate for measuring crop area under staples but not high value cash
crops. The major reason for the poor quality of crop area and land use statistics is the failure
of the village accountants to devote adequate time and attention under the conventional
method. Hence, policies aimed at strengthening and modernizing this legacy of the Indian
data system with new geospatial tools can potentially contribute to strengthening food
security, augmenting agricultural price policies and improve predictions from crop and land
use models. As accuracy of the estimates of food production is primarily dependent on the
accuracy of the crop acreage estimate, the new approach would help in generating more
accurate data on food production.
Although this article demonstrates the merit of using geospatial technology in collecting crop
area information, there are potential payoffs in routinely deploying this technology for
household surveys, household asset and resource mapping, geo-referencing of village
infrastructure and geo-referenced poverty mapping. With extensive parcel mapping, it is
possible to develop a self-reporting based crop area system where each parcel mapped is
given an identification number and farmers made aware of this. Farmers can then report the
crop he intends to grow or is growing either in person or over phone to an agency, private or
public, in-charge of crop area database. The agency can do a sample checking of the farmers
reported data through field visit with the help of GPS enabled hand held devices. With falling
costs of this technology and increasing evidence of the potential benefits, this technology will
see wider applications within developing countries.
18Some analytical caveats remain, however. First, although the results presented in this article
are specific to Nallur village in the Indian state of Karnataka, the implications and issues
raised are highly relevant to the rest of India, where conventional method is still widely
deployed in gathering crop area statistics. A second critique is on the usage of GIS/GPS
technology, which requires manually traversing the crop area accompanied by the crop
owner. However, an unscrupulous crop inventor could choose to ignore the directions of the
crop owner. This geospatial survey was subjected to strict quality controls, requiring presence
of the crop owner and also independently monitored by a supervisor. This was a
comprehensive survey where each parcel of land within each survey number in the village
was accounted for.
Third, more generally, GIS/GPS technology cannot be a panacea as are the other
technologies, because the success of the technology depends also on the proper use, data
management and transfer system. This specific geospatial survey by Zoomin Softech required
considerable resources, refining the application based on the inputs from the RTC records and
village area maps, to design the knowledge base. For the geospatial survey to be robust, this
technology requires traversing every plot of land within each village for the first survey.
Hence, budget considerations may limit the use of this technology. However, with time the
cost of the technology may fall enabling wider use of this technology strengthening a range
of statistics.
19References
African Development Bank Group 2011. Improving Statistics for Food Security, Sustainable
Agriculture, and Rural Development: An Action Plan for Africa (2011-2015), African
Development Bank Group, Ghana.Food and Agriculture Organization (1999) Crop
Information Systems. http://www.fao.org/sd/EIdirect/EIre0078.htm. Accessed 31
August 2012.
Basu, K. 2010. The Economics of Foodgrain Management in India, Ministry of Finance,
Government of India, New Delhi.
Beegle, K., Carletto, C., and Himelein, K. 2012. “Reliability of Recall in Agricultural Data”,
Journal of Development Economics, 98(1):34-41.
Bhoomi. 2012. Pahani (RTC). Retrieved 02 17, 2012, from Bhoomi:
http://bhoomi.karnataka.gov.in/faq.htm#What is Pahani(RTC)?
Bland, J. and Altman, D. 1983. “Measurement in Medicine: The Analysis of Method
Comparison Studies”, Statistician, 32(3):307-317.
Bland, J. and Altman, D. 1986. “Statistical methods for assessing agreement between two
methods of clinical measurement”, Lancet, 1(8476):307-310.
Bland, J. and Altman, D. 2012. “Measurement Method Comparison”, Anesthesiology,
116(1):182-185.
Caeyers, B., Chalmers, N., and Weerdt, J. 2012. “Improving Consumption Measurement and
Other Survey Data Through CAPI: Evidence from a Randomized Experiment”,
Journal of Development Economics, 98(1):19-33.
20Conley, T. and Christopher, U. 2010. “Learning about a New Technology: Pineapple in
Ghana”, American Economic Review, 100(1):35-69.
Deaton, A. and Kozel, V. 2005. “Data and Dogma: The Great Indian Poverty Debate”, World
Bank Research Observer, 20(2):177-199.
Deininger, K., Carletto, C., Savastano, S., and Muwonge, J. 2012. “Can Diaries Help in
Improving Agricultural Production Statistics? Evidence from Uganda”, Journal of
Development Economics, 98(1):42-50.
Euser AM, Finken MJ, Keijzer-Veen MG, Hille ET, Wit JM, and Dekker FW. 2005.
“Associations between prenatal and infancy weight gain and BMI, fat mass, and fat
distribution in young adulthood: a prospective cohort study in males and females born
very preterm”, American Journal of Clinical Nutrition, 81(2):480- 487.
ESRI. 2008. GIS for Sustainable Agriculture. Retrieved 20-03-2012, from ESRI:
www.esri.com/library/bestpractices/sustainable-agriculture.pdf
Gallego, F. 1999. Crop Area Estimation in the MARS Project. Conference on ten years of the
MARS project, (pp. 1-11). Brussels.
GEO. 2011. Examples of Global to Regional Agricultural Monitoring Systems. Retrieved 22-
03-2012, from Group on Earth Observations:
http://www.earthobservations.org/cop_ag_gams_pp.shtml
Gibson, J. and McKenzie, D. 2007. “Using Global Positioning Systems in Household
Surveys for Better Economics and Better Policy”, The World Bank Research
Observer, 22(2):217-241.
21Hong, R., Montana, L., and Mishra, V. 2006. “Family Planning Services Quality as a
Determinant of Use of IUD in Egypt”, BMC Health Services Research, 6(1):79.
Kulshrestha, A. and Kar, A. 2005. “Consumer Expenditure from the National Accounts and
National Sample Survey.” In Deaton, A., Kozel, V., The Great Indian Poverty
Debate. New Delhi: Macmillan.
Landry, P. and Shen, M. 2005. “Reaching Migrants in Survey Research: The Use of the
Global Positioning System to Reduce Coverage Bias in China”, Political Analysis,
13(1):1-22.
McNairn, H., Champagne, C., Shang, J., Holmstrom, D., and Reichert, G. 2009. “Integration
of optical and Synthetic Aperture Radar (SAR) imagery for delivering operational
annual crop inventories”, ISPRS Journal of Photogrammetry and Remote Sensing,
64(5):434-449.
McNairn, H., Ellis, J., Van Der Sanden, J. J., Hirose, T., and Brown, R. 2002. “Providing
crop information using RADARSAT-1 and satellite optical imagery”, International
Journal of Remote Sensing, 23(5):851-870.
Mehta, R. 2000. Remote sensing applications in agriculutral statistics system: Scope,
potential and limitations. Indian Journal of Agricultural Economics, 55(2):87-95.
Moran, M. 2000. Image-Based Remote sensing for Agricultural management perspectives of
image providers, research scientists and users. Second International on Geospatial
information in Agriculture and Forestry Conference, (pp. 23-30). Florida.
22Nelson, M. R., Orum, T. V., and Jaime-Garcia, R. 1999. Applications of Geographic
Information Systems and Geostatistics in Plant Disease Epidemiology and
Management. Arizona: The American Phytopathological Society.
Parihar, J. and Oza, M. 2006. FASAL: an integrated approach for crop assessment and
production forecasting. In Kuligowski, R., Parihar, J., Saito G., Agriculture and
Hydrology Applications of Remote Sensing. SPIE Press.
Perry, B. and Gessler, W. 2000. “Physical Access to Primary Health Care in Andean
Bolivia”, Social Science & Medicine, 50(9):1177-1188.
Pitman, E. 1939. “A note on normal correlation”, Biometrika, 31(1/2):9-12.
Ray, S., Panigrahy, S., and Parihar, J. 2008. Precision farming in Indian Context - Role of
Remote Sensing. In Anandaraja, N., Chandrakandan, K., Ramasubramaniam, M.,
Extension of Technologies from Labs to Farms (pp. 491). New Delhi: New India
Publishing Agency.
Reichardt, M., Jurgens, C., Kloble, U., Huter, J., and Moser, K. 2009. “Dissemination of
precision farming in Germany: acceptance, adoption, obstacles, knowledge transfer
and training activities”, Precision Agriculture, 10(6):525-545.
Sen, A. 2000. “Estimates of Consumer Expenditure and Its Distribution: Statistical Priorities
after the 55th Round”, Economic and Political Weekly, 35(51):4499–4518.
Snedecor, G. and Cochran, W. 1967. Statistical Methods. 6th ed. Aimes, IA: Iowa State
University Press.
Srivastava, S. 2011. Case study: Harnessing new tools and techniques for making agricultural
statistics more efficient and evidence based support food security policy decisions in
23India. Retrieved on 17-09-2012 from http://www.unescap.org/stat/meet/data-use-
oct2011/india.pdf
Tsiligirides, T. 1997. “Remote sensing as a tool for agricultural statistics: a case study of area
frame sampling methodology in Hellas”, Computers and Electronics in Agriculture,
20(1):45-77.
United Nations 1979. Improving Social Statistics in Developing Countries: Conceptual
Framework and Methods, Studies in Methods Series F, No. 25, Department of
International Economic and Social Affairs Statistical Office, New York.
World Bank 2008. World Development Report 2008: Agriculture for Development.
Washington, D.C.: The World Bank.
World Bank 2011. Global Strategy to Improve Agricultural and Rural Statistics; Report No.
56719-GLB, Washington, D.C.: The World Bank.
24Figure 1 Difference in crop area obtained by conventional (c) and alternative methods
(a) for the year 2011
Note: The crop area in acres obtained by alternative method is the simple average of the
estimates obtained twice, first during January and again in November 2011. The differences
are calculated from plot wise matching (same plot) of crop area information from both
methods.
259.6
8.8
8
7.2
6.4
5.6
4.8
Conventional - Alternative
4
3.2 mean + 2 sd
2.4
1.6
.8 mean difference
0
-.8
-1.6
-2.4 mean - 2 sd
-3.2
-4
-4.8
-5.6
-6.4
-7.2
-8
1 2 3 4 5 6 7 8 9 10
Average of Conventional and Alternative
Figure 2 Difference in methods against their mean for total crop area (All crop)
9.6
8.8
8
7.2
6.4
5.6
4.8
Conventional - Alternative
4
mean + 2 sd
3.2
2.4
1.6
.8 mean difference
0
-.8
-1.6
-2.4
-3.2 mean - 2 sd
-4
-4.8
-5.6
-6.4
-7.2
-8
1 2 3 4 5 6 7
Average of Conventional and Alternative
Figure 3 Difference in methods against their mean for arecanut crop area
269
8
7
6
5
Conventional - Alternative
4
3 mean + 2 sd
2
1
mean difference
0
-1
-2 mean - 2 sd
-3
-4
-5
-6
2 4 6 8 10
Average of Conventional and Alternative
Figure 4 Difference in methods against their mean for coconut crop area
2
1.6 mean + 2 sd
1.2
Conventional - Alternative
.8
.4
mean difference
0
-.4
-.8
mean - 2 sd
-1.2
0 2 4 6
Average of Conventional and Alternative
Figure 5 Difference in methods against their mean for sorghum crop area
279.6
8.8
8
7.2
6.4
Conventional - Alternative
5.6
4.8
4
mean + 2 sd
3.2
2.4
1.6
.8
mean difference
0
-.8
-1.6
-2.4
-3.2 mean - 2 sd
-4
2 4 6 8 10
Average of Conventional and Alternative
Figure 6 Difference in methods against their mean for mango crop area
2.4
2
mean + 2 sd
1.6
1.2
.8
Conventional - Alternative
.4
0 mean difference
-.4
-.8
-1.2
-1.6
mean - 2 sd
-2
-2.4
-2.8
-3.2
-3.6
.4 .8 1.2 1.6 2 2.4 2.8 3.2 3.6 4
Average of Conventional and Alternative
Figure 7 Difference in methods against their mean for paddy crop area
286.4
5.6
4.8
4
Conventional - Alternative
3.2
2.4 mean + 2 sd
1.6
.8
0
mean difference
-.8
-1.6
mean - 2 sd
-2.4
-3.2
-4
-4.8
0 2 4 6 8
Average of Conventional and Alternative
Figure 8 Difference in methods against their mean for finger millet crop area
Table 1 RS Satellites and their Resolution
Satellite Name Resolution
IKONOS 1m
IRS Pan 5.6m
Resourcesat -1 6m (multi spectral)
29Table 2 Type of Plot Area Utilization
Land use type Conventional method Alternative method
Mean SD N Mean SD N
1 2 3 4 5 6
Arecanut 1.57 0.91 27 1.04 1.03 250
Banana 0.68 0.37 7 0.43 0.30 8
Beans 2.42 1.12 3 0.66 0.16 3
Beetle Leaf n.a. n.a. n.a. 0.31 0 1
Chilly 0.75 0 1 0.11 0 1
Coconut 1.72 1.43 377 1.51 1.36 591
Eucalyptus 3.07 0 3 1.67 1.44 10
Fallow 0.2 0 4 1.62 1.96 87
Flower-Kakad n.a. n.a. n.a. 0.15 0 1
Government Land n.a. n.a. n.a. 4.29 0 1
Groundnut 0.5 0 1 1.72 0 1
Habitation 0.62 0.89 27 2.11 2.34 5
Horsegram n.a. n.a. n.a. 3.74 3.28 5
Sorghum 1.01 0.87 6 1.35 1.41 8
Mango 1.67 2.05 68 1.51 1.36 202
Paddy 1.11 1.17 15 1.07 1.24 71
Pepper n.a. n.a. n.a. 0.22 0 1
Finger Millet 1.66 1.20 191 1.68 1.67 408
Road n.a. n.a. n.a. 0.44 0.46 17
Sapodilla 0.75 0 1 0.69 0 1
30Scrub Land n.a. n.a. n.a. 6.59 6.92 26
Stream n.a. n.a. n.a. 1.12 1.80 5
Tamarind 0.25 0 1 0.56 0.39 10
Tank/Pond n.a. n.a. n.a. 3.53 4.82 8
Teak n.a. n.a. n.a. 1.50 0 1
Pigeon Pea n.a. n.a. n.a. 1.08 1.13 31
All 1.62 1.41 732 1.53 1.80 1753
Note: n.a. refers to information not available in the administrative records (RTC). Mean and
SD are calculated from area in acres while N is the number of plots under different land use
types. These calculations are not based on plot wise matching (same plot) of crop area
information from both methods.
31Table 3 Comparison of Methods for Estimating Crop Area
Crop Mean difference Limits of Pitman’s test of
agreement difference in variance
Mean 95% CI r value p value
1 2 3 4 5
Arecanut (n = 148) 0.81 0.51 to 1.10 - 2.83 to 4.45 0.34 0.000
Coconut (n = 458) 0.33 0.21 to 0.45 -2.32 to 2.99 0.12 0.009
Sorghum (n = 11) 0.33 -0.08 to 0.75 -0.91 to 1.57 0.43 0.180
Mango (n = 127) 0.40 0.11 to 0.68 -2.89 to 3.69 0.49 0.000
Paddy (n = 44) 0.05 -0.22 to 0.32 -1.73 to 1.83 0.25 0.089
Finger Millet (n = 249) 0.32 0.18 to 0.45 -1.84 to 2.49 0.00 0.886
All crops (n = 655) 0.36 0.27 to 0.46 -2.16 to 2.90 0.21 0.000
Note: The comparisons are based on plot wise matching (same plot) of crop area information
from both methods. The total number of observation under All Crops (last row) does not
match with the addition of observations across crops due to mismatch in cultivated crops
recorded under both methods across all the crops. Apart from the crops listed in this table, All
Crops also includes banana, beans, chilly, eucalyptus, groundnut, sapodilla, tamarind, teak
and pigeon pea. These crops were excluded from the disaggregated analysis due to
insignificant crop area under each of these crops. The first two columns show the estimated
bias with the expected intra-individual difference’s 95% confidence interval (CI) limits’. The
third column shows the mean difference plus or minus 2 standard deviation ( ± sd). The
Pitman’s test is reported in column 4 and 5 with correlation between difference in methods
and their average denoted as r and the next column reports the p-value of a test with the null
hypothesis that there is no significant difference in variances between the conventional and
alternative methods.
32Appendix A
Figure AI Map of the Karnataka State, Gubbi Taluk, Nallur GP and Village
Karnataka State Gubbi Taluk inTumkur District Nallur GP in Gubbi Taluk
Nallur Village in Nallur GP Nallur Village map
33Figure A2 Summary of the conventional method
Crop area data
VA is assigned to Approximate area
Should collect for 3 1 month in every
gather the data for each VA is
seasons in an year season
4600 acres
VA goes to
crop area
VA estimates the crop area visually
without any tools. For instance; 40
coconut tree = 1 acre, etc. The output
is only an approximate value
Enters the data manually
into a Pahani book
VA sends the data to
Revenue Inspector (RI)
RI verifies the data
Correction
The private firm documents
VA sends the data to Computer CC uploads the data
the data to a CD and sends
Center (CC) at Taluk Office to online database of
back to CC
Bhoomi
34Figure A3 Summary of the alternative method
Crop area data
The crop inventor Area of 2700 acres is
from Zoomin allocated for the pilot
collects the data study
Collected data by Collected the data
traversing the crop twice (i.e. in Jan and
area using a GPS Nov 2011)
device
Crop updating for the
The data is next season is
Since, all the crops are not
automatically stored performed in a similar subjected to change during each
in GPS device way season; the crop inventor updates
the crops which are subjected to
change using previous season’s
The traversed area is Corresponding crop area map as a reference
accompanied by the irrigation facilities
farmer and verified were also
by comparing it with documented in the
previous RTC records GPS device
The data from the
GPS device is The GIS application
uploaded to the server updates changes in
through internet server and works as a
front-end for viewing
the data
35Table A1. Methods comparison
Parameters Conventional method Alternative method
Costs 485.86 US$
Costs 538.88 US$ (1 US$ = Rs. Cost breakdown*: cost of updating
55.67) = 414 US$ (0.09 US$ price paid
Cost per season for the total area for traversing per acre X 4600
of 4600 acres (assigned to each Cost breakdown: 2 months VA acres) + 26.94 US$ is the user cost
VA) salary= 2 X 269.44 US$ of a hand held device + 44.92 US$
paid for verification of data
The digitized data is available in
Bhoomi database (Bhoomi
database is operated by govt.) The data is directly transferred to
Connectivity which can be accessed by all the server which can be accessed
stakeholders using GIS application
According to VA, collecting
4600 acres in one month is a
tough task. Therefore, VA can
Capacity only collect 50% of the data in The crop inventor had covered
one month 2700 acres in one month
The information collected by VA
is used by government since
many years. Therefore, it should The information collected by crop
be adequate. However, the quality inventor is capable of providing
Adequate of the data has deteriorated in adequate information using
recent year GPS/GIS
The data collected by VA is
through eye-balling technique and The crop inventor collects the
it is stored manually in Pahani data using GPS device and
Reliable books which is later digitized and transfers the data to server using
transferred to Bhoomi database internet
The time required by VA to The crop inventor collected
collect the data is 30 days. It accurate data in less number of
Timely again takes 20-30 days for days then VA. The data collected
digitization is in digitized format
The data is collected manually The data collected is not manually
and stored in Pahani books which stored in records, which reduces
can be subjected to risks. The human intervention. The crop area
data is then verified by RI. The is traversed using GPS device. The
data is digitized by a third party GPS device transfers the data to a
Security (i.e. a private player) and is server which is accessed
transferred to Bhoomi database authentically
The collection and dissemination The collection and dissemination
of data takes nearly 60 days. The of data occurs on the same day.
accuracy is poor and the Data has high accuracy and the
Better Planning of Government technique for data collection is technique for data collection is
not reliable also reliable
The delivery of data is The delivery of data is
instantaneous after digitization. instantaneous after collecting the
However, the delay in digitization data using GPS device. There is no
Effective Delivery and poor accuracy are some of the delay in digitization and the
the drawbacks accuracy is above 90%. GIS
36application provides various
options for viewing the data
The data is easy for monitoring
The data can be easily monitored and evaluation from the beginning
Easy Monitoring and Evaluation and evaluated after the data is of the process (i.e. during data
uploaded in the Bhoomi database collection using GPS device)
The data is collected by crop
The data is collected by VA once inventor during every season.
every season and is capable of Additional updating is also
Frequency of data collection collecting data during anytime of possible at anytime of the year,
the year irrespective of the climate
Note: * Further disaggregation of the costs and their justifications can be requested from the
corresponding author.
37Figure A4 Plotting of crop area using GPS
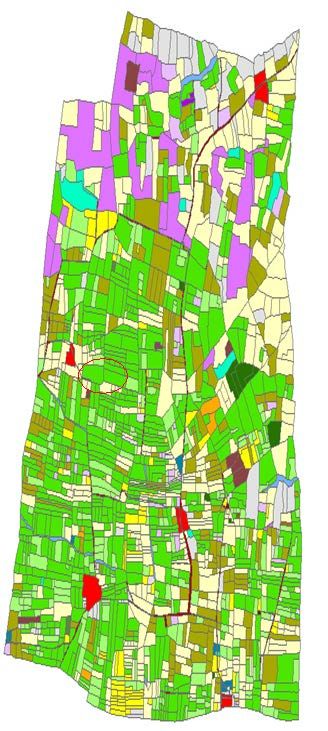
38Figure A5 GIS application presenting different crops in Nallur village
39Figure A6 GIS application presenting Horticulture crops in Nallur village
40Figure A7 GIS application presenting Cereal crops in Nallur village
41Figure A8 GPS locations traversed during November 2011
42Figure A9 Crop map for both seasons separately
January 2011 November 2011
431
See Gibson and McKenzie (2007) for a comprehensive survey of literature on several other applications of
GPS for better economics and better policy.
2
A Village Accountant is an administrative head of “revenue circle”, the lower most units in revenue
administrative hierarchy. A revenue circle has on average 3-4 villages covering on an average of about 3800
acres. Some gram panchayat have two revenue circles and some revenue circles fall in two or more gram
panchayats.
3
GP is the smallest local government unit in rural areas in India comprising of 3-5 villages with total population
of approximately 5000. A Taluk comprising of several GP’s (generally 30-40 GP’s but can be higher or lower
depending on the size of the Taluk) is a sub division of a revenue district and a revenue district is a sub division
of a state.
4
A copy of the questionnaire can be requested from the corresponding author.
5
Pahani (RTC) is a book with listed attributes of land holdings, irrigation, property, crop type and area
developed under the Bhoomi project. Bhoomi is the project of on-line delivery and management of land records
in Karnataka.
6
The use of RS for crop inventory began in United States (U.S) with Large Area Crop Inventory Experiment
(LACIE) in late 1970’s (Moran 2000). The experiment was a success in gathering the information. National
Agriculture Statistics Service (NASS) of U.S provides timely and accurate statistics to U.S agriculture using RS
as a valuable tool to improve accuracy. U.S uses Landsat, Resourcesat-1, NASA MODIS, etc for RS purposes.
Kazakhastan began the use of RS in 1997 and it has approximately 14 million hectares of net sown area (GEO
2011). Due to its large field sizes, satellite images provide high accuracy in gathering crop area information.
Netherlands had used sample ground survey data and high resolution image to gather crop inventory data
(Gallego, 1999). Similarly, Canada uses optical imagery for mapping crop information and crop condition
(McNairn et al. 2002). Brazil has approximately 54 million hectares of agricultural land and it had started using
RS through Geosafras project in 2003 to improve crop monitoring, forecasts, etc. Landsat and CBERS – 2 were
used for field mapping and area estimates. MARS-Stat provides accurate and timely crop information for
European countries since 1992. It includes RS satellites such as; NOAA-AVHR, SPOT-VGT, MODIES, MSG.
China started using RS to monitor agriculture in late 1970’s. Later on it improved its capabilities with
44advancements in technology. RS is extensively used to provide agricultural statistics and monitor/manage
agriculture in China. Other countries such as Argentina, Russia, etc also use RS as an important tool to improve
accuracy of crop area information.
7
According to Reichardt et al. (2009), GPS tool has been used successfully by a group of farmers in Germany
for data collection. Sri Lanka used GIS to manage irrigation systems with the help of United Nations World
Food programme. In New Zealand, the use of GPS/GIS devices helped in managing application of fertilizers.
Usage of geospatial technology reduced 10 % of expenditure on fertilizers and it also avoided the harmful runoff
of fertilizer into streams/canals (ESRI, 2008).
8
A survey number is officially demarcated and recorded plot with a specific identification number. A survey
number may have multiple owners and crops.
9
The snapshots and other details of the GIS application are presented in the appendix (Figure A4 to Figure A9).
45You can also read