Wing Planform Effect on the Aerodynamics of Insect Wings - MDPI
←
→
Page content transcription
If your browser does not render page correctly, please read the page content below
insects
Article
Wing Planform Effect on the Aerodynamics of Insect Wings
Hao Li 1 and Mostafa R. A. Nabawy 1,2, *

                                          1   Department of Mechanical, Aerospace and Civil Engineering, The University of Manchester,
                                              Manchester M1 3BB, UK; hao.li@manchester.ac.uk
                                          2   Aerospace Engineering Department, Faculty of Engineering, Cairo University, Giza 12613, Egypt
                                          *   Correspondence: mostafa.ahmednabawy@manchester.ac.uk

                                          Simple Summary: This study aims to provide an improved understanding of the effect of wing
                                          planform shape on the aerodynamic performance of insect flapping wings. We focus our investigation
                                          on three planform parameters, namely aspect ratio, radial centroid location, and wing root offset, and
                                          their effect on the aerodynamic performance is characterised at a flow Reynolds number most relevant
                                          to small insects similar to fruit flies. We show that aspect ratio and root offset mainly influence the
                                          flow detachment area near the wingtip, whereas radial centroid location mainly influences the local
                                          flow evolution time on the wing surface. Overall, increasing the aspect ratio is beneficial to lift and
                                          efficiency up to a limit where flow detachment near the wing tip leads to less-favorable performance.
                                          Similarly, increasing the wing root offset leads to an increased flow detachment area near the wing
                                          tip, resulting in reduced lift coefficient, but the aerodynamic efficiency remains relatively unaffected
                                          by the root offset value for most aspect ratios. Finally, increasing the radial centroid location mainly
                                          increases the aerodynamic efficiency.

                                          Abstract: This study investigates the effect of wing planform shape on the aerodynamic performance
                                          of insect wings by numerically solving the incompressible Navier-Stokes equations. We define the
                                          wing planforms using a beta-function distribution and employ kinematics representative of normal
                                          hovering flight. In particular, we use three primary parameters to describe the planform geometry:
                                          aspect ratio, radial centroid location, and wing root offset. The force coefficients, flow structures,
Citation: Li, H.; Nabawy, M.R.A.          and aerodynamic efficiency for different wing planforms at a Reynolds number of 100 are evaluated.
Wing Planform Effect on the               It is found that the wing with the lowest aspect ratio of 1.5 results in the highest peaks of lift and
Aerodynamics of Insect Wings.
                                          drag coefficients during stroke reversals, whereas the higher aspect ratio wings produce higher lift
Insects 2022, 13, 459. https://
                                          and drag coefficients during mid half-stroke translation. For the wings considered, the leading-edge
doi.org/10.3390/insects13050459
                                          vortex detachment is found to be approximately at a location that is 3.5–5 mean chord lengths from
Academic Editor: Brian T. Forschler       the wing center of rotation for all aspect ratios and root offsets investigated. Consequently, the
                                          detachment area increases with the increase of aspect ratio and root offset, resulting in reduced
Received: 5 April 2022
Accepted: 11 May 2022
                                          aerodynamic coefficients. The radial centroid location is found to influence the local flow evolution
Published: 13 May 2022                    time, and this results in earlier formation/detachment of the leading-edge vortex for wings with a
                                          smaller radial centroid location. Overall, the best performance, when considering both average lift
Publisher’s Note: MDPI stays neutral
                                          coefficient and efficiency, is found at the intermediate aspect ratios of 4.5–6; increasing the centroid
with regard to jurisdictional claims in
                                          location mainly increases efficiency; and increasing the root offset leads to a decreased average lift
published maps and institutional affil-
iations.
                                          coefficient whilst leading to relatively small variations in aerodynamic efficiency for most aspect
                                          ratios.

                                          Keywords: insect flight; flapping wings; aerodynamics; wing planform; leading-edge vortex
Copyright: © 2022 by the authors.
Licensee MDPI, Basel, Switzerland.
This article is an open access article
distributed under the terms and           1. Introduction
conditions of the Creative Commons
                                               Flying insects are prevalent in nature and offer diverse examples of successful flight
Attribution (CC BY) license (https://
                                          concepts. Despite their prolonged existence, serious steps towards understanding how
creativecommons.org/licenses/by/
                                          insects fly only started in the past few decades. In fact, our understanding of insect wing
4.0/).

Insects 2022, 13, 459. https://doi.org/10.3390/insects13050459                                                https://www.mdpi.com/journal/insects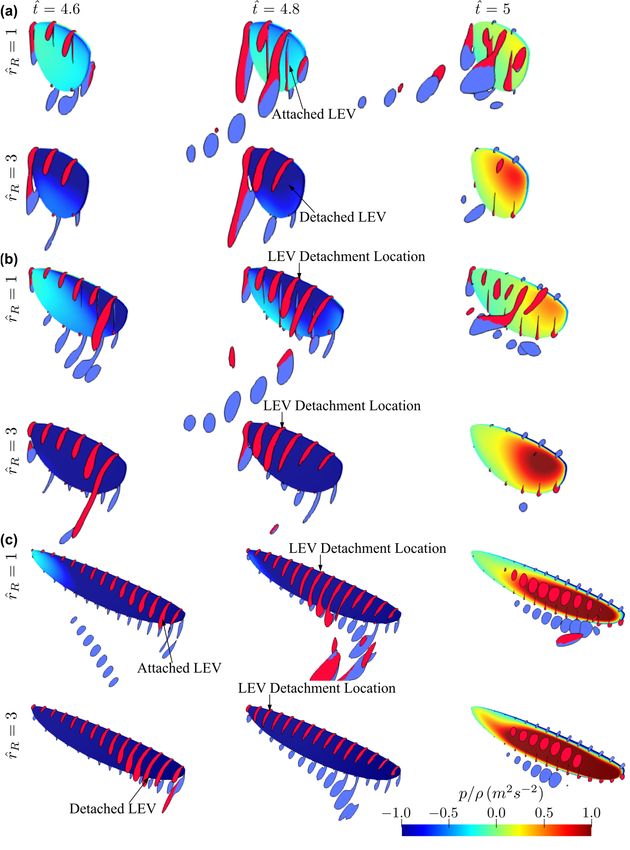
Insects 2022, 13, 459                                                                                            2 of 26

                        aerodynamics has lately been significantly improved, thanks to the numerous studies that
                        considered the primary aerodynamic mechanisms enabling insects to stay aloft while hover-
                        ing. These mechanisms include: (1) the formation of a stably attached leading-edge vortex
                        (LEV), which allows reattachment of flow on the wing’s upper surface, preventing stall and
                        augmenting lift production [1–4]; (2) rotational circulation due to the wing pitching rotation
                        at the end of each half-stroke, which is a main contributor to the transient force production
                        during stroke reversals [5]; (3) added mass effects, resulting from the periodic accelera-
                        tion and deceleration of the flapping wing, again influencing transient force production
                        mainly around stroke reversals [6]; and (4) wake capture, which is a unique aerodynamic
                        mechanism for flapping wings, arising from the interaction of the wing with wake shed
                        from the preceding half-stroke [1,5,7]. Despite the current progress, there is still limited
                        understanding of how the aerodynamic behaviour of flapping insect wings changes for dif-
                        ferent wing morphologies. The objective of this paper is, therefore, to provide an improved
                        understanding of the physics underlying insect-like flapping wing aerodynamics through
                        identifying the key morphological variables that can enhance aerodynamic performance at
                        this scale.
                              Early studies concerned with wing planform shape effects primarily focused on
                        aerodynamic force production. Usherwood and Ellington [8] conducted an experimental
                        campaign using revolving wing models of hawkmoth-like planform shape to study the
                        effect of aspect ratio on aerodynamic force production. By changing the wing aspect ratio
                        within a range between 2.27 and 7.92, they found that, when the wing angle of attack was
                        less than 65◦ , aspect ratio had little effect on aerodynamic force coefficients; nevertheless,
                        higher aspect ratio wings still resulted in a steeper growth in lift coefficient with the
                        increase of angle of attack. Luo and Sun [9] used Computational Fluid Dynamics (CFD)
                        simulations to study the aerodynamic force production of different wing planform shapes
                        obtained from 10 different insect species. Their results showed that wing planform had
                        minor influence on the aerodynamic force coefficients. However, they only considered
                        a small range of aspect ratio values, between 2.84 and 5.45. Shahzad et al. [10] also
                        used CFD simulations to study the effect of radial centroid location and aspect ratio
                        on the aerodynamic performance of hovering insect-like flapping wings. The planform
                        shapes in their study were defined using the beta-function distribution, proposed by
                        Ellington [11] as representative of insect wing planform shapes. Their study investigated
                        wings with aspect ratio and radial centroid location values varying between 1.5–6.0 and
                        0.43–0.63, respectively. They found that lift coefficient increased with the increase of aspect
                        ratio, whereas aerodynamic efficiency defined as the ratio of average lift coefficient to
                        power coefficient reached its maximum value at an aspect ratio of 2.96. On the other
                        hand, increasing the radial centroid location was found to decrease the hovering efficiency.
                        However, in their study, a sinusoidal waveform was employed for both flapping and
                        pitching kinematics. Hence, the contribution from wing rotational/acceleration effects
                        during stroke reversals was rather weak, despite the fact that these effects can have a
                        significant influence on insect wing aerodynamic performance [5].
                              Several analytical studies have also been conducted to better understand the wing
                        planform effects within revolving/flapping motions. Ansari et al. [12] developed a poten-
                        tial flow-based model and used it to assess the effect of different wing planform shapes.
                        They found an increasing trend of lift with aspect ratio and root offset. They, additionally,
                        proposed that more area at the wing outboard region is beneficial for lift force production,
                        due to the higher velocity towards the wing tip. Nabawy and Crowther [13] developed a
                        quasi-steady lifting line theory and used it to investigate the aerodynamic performance of
                        revolving/flapping wings experiencing fully attached flows. They showed that increasing
                        the aspect ratio and decreasing the wing radial centroid location increases the wing lift
                        coefficient. In a series of studies using analytical models [14–16], Nabawy and Crowther
                        identified the optimum wing planform shape that would minimize the induced power
                        factor, a metric for lift efficiency production. They showed that as more wing area is allo-
                        cated near the wing root (smaller radial centroid location), the more efficient the planform
Insects 2022, 13, 459                                                                                             3 of 26

                        becomes with respect to induced power effects. Moreover, they identified the elliptic wing
                        planform as the optimum planform when profile power effects are concerned. In a study
                        on the effect of wing morphology on aerodynamics of wings in flies, Krishna et al. [17]
                        used numerical simulation to compare the aerodynamic force and power of a so-called
                        ‘ideal-shaped’ wing, a rectangular wing, and a wing planform similar to that of a blowfly,
                        all with the same wing area and span. The ‘ideal-shaped’ wing planform was derived
                        analytically based on the optimal distribution of circulation along the wingspan, taken
                        from Prandtl and Betz [18,19]. They found that for both revolving and flapping kinemat-
                        ics the rectangular wing and fly wing showed similar lift force and power performance,
                        whereas the ‘ideal-shaped’ wing, surprisingly, under-performed with respect to both lift
                        and efficiency.
                              The effect of wing planform shape on the evolution and attachment of the LEV on
                        insect wings has also been investigated. Phillips et al. [20,21] used a robotic flapping wing
                        apparatus to experimentally study rectangular wings with different aspect ratios and root
                        offsets at a Reynolds number of 1400. They found that for wing aspect ratios greater
                        than three, the LEV starts to detach at approximately 70% of wingspan at mid half-stroke;
                        furthermore, a higher aspect ratio results in earlier detachment of LEV. Moreover, they
                        found that circulatory lift from the LEV peaks at an aspect ratio of six. Similar observations
                        on the LEV detachment were found by Han et al. [22] for insect-like flapping wings with
                        aspect ratios greater than three, thus proposing that the lift coefficient peaks at an aspect
                        ratio of three. Harbig et al. [23] investigated Drosophila shaped wing planforms with aspect
                        ratios between 2.9 and 7.3 using CFD simulations. Small differences in lift coefficient were
                        found for wing aspect ratios between 2.9 and 5.1, but a decrease in lift coefficient was
                        found when the aspect ratio was further increased to 7.3. This led them to propose that the
                        reduction in LEV circulation near the wingtip at a high aspect ratio leads to the reduction
                        in lift coefficient. Kruyt et al. [24] used particle image velocimetry (PIV) to study the LEV
                        structures of revolving rectangular wings with different aspect ratios. They found that the
                        LEV remains attached up to a spanwise location that is four times of the wing chord length,
                        measured from the centre of rotation. Further outboard, the LEV lifts away from the wing
                        surface, leading to tip stall and reduced aerodynamic efficiency.
                              Most recently, the effect of wing planform shape on LEV structure and aerodynamic
                        performance has been investigated in connection to the Rossby number [25], defined as
                        the ratio of the radius of gyration to the mean chord length. Such investigations are
                        mainly useful for ascertaining the effect of the wing root offset (how distant the wing
                        root station is from the centre of rotation) on aerodynamic performance. Lee et al. [26]
                        studied rectangular revolving wings using CFD, with wing aspect ratios varying between
                        1 and 10. By changing the wing root offset, they forced the Rossby number to vary within
                        a range between 0.58 and 7.57. They found that when the Rossby number is kept fixed,
                        lift coefficient increases with the increase of aspect ratio until plateauing at aspect ratios
                        between four and five. On the other hand, they showed that increasing Rossby number, for
                        a given aspect ratio, leads to decreased lift coefficients due to the reduced stability of the
                        LEV. Jardin and Colonius [27] also investigated rectangular revolving wings with aspect
                        ratios ranging between 1 and 7, and Rossby numbers ranging between 1.73 and 5.77. They
                        found that for fixed Rossby number cases, lift coefficient increases monotonically with
                        aspect ratio, and that the increase rate is high for small aspect ratios but asymptotic for
                        large aspect ratios. On the other hand, for fixed aspect ratio cases, lift coefficient decreases
                        monotonically with the increase of the Rossby number. Similarly, Bhat et al. [28] also
                        demonstrated a decreasing lift coefficient with the increase of the Rossby number in a
                        numerical study of revolving wings. In fact, they proposed that the weakening of the LEV
                        due to the reduced spanwise flow caused the reduction of lift at higher Rossby numbers.
                              Despite the abundance of results in the literature, arguably, our understanding of the
                        effect of wing planform shape on the aerodynamics of insect wings is still limited. This is
                        because many of the existing studies have focused mainly on the effect of aspect ratio, but
                        provided less attention to investigating the radial centroid location and root offset effects,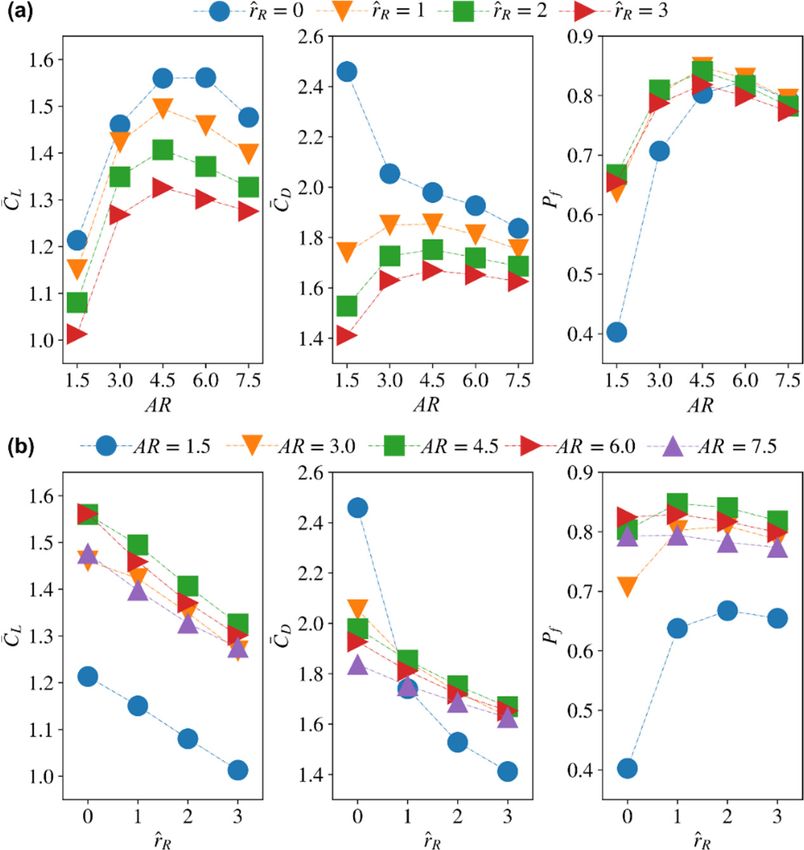
Insects 2022, 13, 459                                                                                              4 of 26

                        which are arguably prominent features in defining the wing planform shape. In fact, most of
                        the investigated wings were either rectangular wings or of a specific insect-inspired shape;
                        hence, a systematic variation of the morphological parameters for representative insect
                        planforms is needed. Furthermore, most of the existing studies employed revolving wings
                        for the simplicity they bring while investigating the flow structure and aerodynamic forces;
                        however, insect wings employ reciprocating motions, where unsteady aerodynamic effects
                        can be significant due to the cyclic formation of vortical structures. As such, in this study,
                        we simultaneously investigate the effect of aspect ratio, radial centroid location, and root
                        offset of insect wings to provide a detailed understanding of the holistic effect of planform
                        shape on their aerodynamics performance. The wing geometry is defined using a beta-
                        function distribution, known to provide accurate representation (within 5% error) of many
                        natural insect wing planforms [11]. The kinematic functions used in this study provide
                        fair representation of ‘normal hovering’ flight. The flow structures and aerodynamic force
                        coefficients at a Reynolds number of 100, relevant to insects similar to fruit flies, are obtained
                        by numerically solving the incompressible Navier-Stokes equations using the open-source
                        CFD package OpenFOAM (Open-source Field Operation and Manipulation).
                              The rest of this paper is organised as follows: Section 2 provides the definition of
                        the wing planform shapes and kinematic waveforms chosen for investigation. The setup
                        and validation of the numerical model are also presented. Section 3 demonstrates the
                        simulation results for different wing planform cases, including the influence of aspect ratio,
                        radial centroid location, and root offset on the flow structure evolution, instantaneous and
                        average aerodynamic force production, and power efficiency. Finally, Section 4 presents the
                        conclusions of this study.

                        2. Materials and Methods
                        2.1. Wing Planforms and Kinematics
                             The wing planform representation used in this study is based on the beta-function
                        distribution of wing area, conceived by Ellington [11]. Here, the non-dimensional wing
                        chord length (i.e., local wing chord length divide by the mean chord, ĉ(r̂ ) = c(r̂ )/c) along
                        the wing is given by [11]:
                                                                       r̂ p−1 (1 − r̂ )q−1
                                                         ĉ(r̂ ) = R 1                                               (1)
                                                                          p−1 (1 − r̂ )q−1 dr̂
                                                                    0 r̂
                        where r̂ = r/R is the non-dimensional radial position along the wing length, R. The
                        parameters p and q are defined using the non-dimensional radial centroid location and the
                        non-dimensional radius of gyration location, r̂1 and r̂2 , respectively, as follows [11]:
                                                                                   !
                                                                 r̂1 (1 − r̂1 )
                                                        p = r̂1                 −1                                (2)
                                                                    r̂22 − r̂12
                                                                                          !
                                                                       r̂ (1 − r̂1 )
                                                        q = (1 − r̂1 ) 1 2           −1                               (3)
                                                                          r̂2 − r̂12
                        The parameters r̂1 and r̂2 for the wing planform shape are linked via the relation
                        r̂2 = 0.929[r̂1 ]0.732 proposed by Ellington [11]. As such, r̂2 value can be evaluated based on
                        a prescribed value of r̂1 . The aspect ratio of the wing is defined as:

                                                                        rT − rR
                                                                 AR =                                                 (4)
                                                                           c
                        where r T and r R are the radial positions of the wing tip and wing root, respectively. The
                        non-dimensional root offset r̂ R is defined by:
                                                                             rR
                                                                    r̂ R =                                            (5)
                                                                              c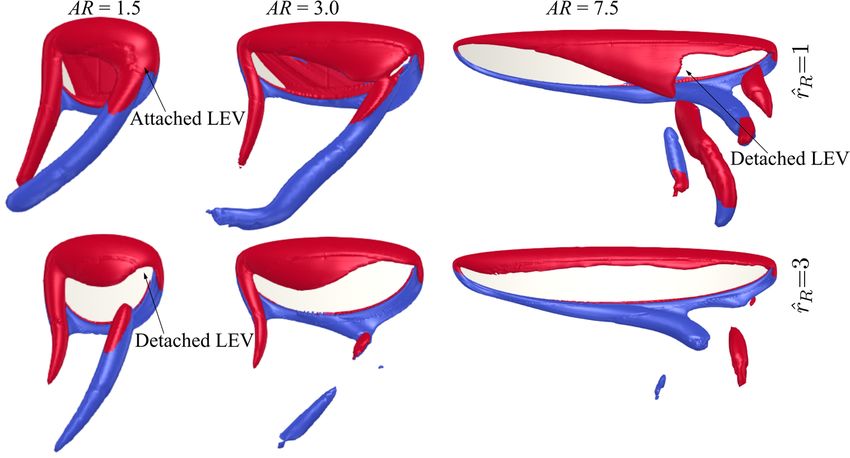
Insects 2022,13,
Insects2022, 13,459
x FOR PEER REVIEW 55 of
of 26
26
wherer R isisthe
where thedistance
distanceby bywhich
whichthe thewing
wingroot
rootstation
stationisisdisplaced/offset
displaced/offset fromfromthe thecentre
centre
of
ofrotation.
rotation.
Based
Basedon onthe
theabove
abovedefinitions,
definitions,the theeffect
effectofofwing
wing planform
planform shape
shapeononthethe
aerodynamics
aerodynam-
of insect wings can be investigated by varying the aspect ratio, radial
ics of insect wings can be investigated by varying the aspect ratio, radial centroid centroid location, and
location,
wing root offset. Note that other secondary planform parameters
and wing root offset. Note that other secondary planform parameters such as the shape such as the shape of the
of
leading-edge contour or the location of the pitching axis are not considered
the leading-edge contour or the location of the pitching axis are not considered in this in this study.
The
study.aspect
Theratio range
aspect ratiochosen
rangefor investigation
chosen is AR = 1.5–7.5,
for investigation is =the radialthe
1.5–7.5, centroid
radial location
centroid
islocation
investigated within the range r̂ = 0.4–0.6, and the non-dimensional
is investigated within the range ̂ = 0.4–0.6, and the non-dimensional wing root
1 wing root offset is
investigated within the range r̂ = 0–3. These chosen ranges for investigation
offset is investigated within the range ̂ = 0–3. These chosen ranges for investigation are
R are selected
to ensureto
selected most insect
ensure wings
most planforms
insect are covered,
wings planforms arefollowing data collected
covered, following data in [11]. The
collected in
wing set as 5% of the mean chord length, c,
[11]. The wing thickness is set as 5% of the mean chord length, ̅, for all cases, andpitching
thickness is for all cases, and the axis of the axis
rotation is constantly set at 0.25c from the leading-edge. The specific values considered in
of pitching rotation is constantly set at 0.25 ̅ from the leading-edge. The specific values
this study for aspect ratio, non-dimensional radial centroid location, and non-dimensional
considered in this study for aspect ratio, non-dimensional radial centroid location, and
wing root offset are summarized in Table 1. The resulting wing planform morphologies for
non-dimensional wing root offset are summarized in Table 1. The resulting wing plan-
these geometric parameters are visualised in Figure 1.
form morphologies for these geometric parameters are visualised in Figure 1.
Table 1. Morphological parameters describing the wing planforms considered for investigation.
Table 1. Morphological parameters describing the wing planforms considered for investigation.
Morphological Parameter Values
Morphological Parameter Values
AR 1.5, 6,
1.5, 3, 4.5, 3, 7.5
4.5, 6, 7.5
r̂1 0.4, 0.5, 0.6
̂ r̂ R
0.4, 0.5, 0.6
0, 1, 2, 3
̂ 0, 1, 2, 3
Figure 1. Wing planform shapes for different aspect ratios and non-dimensional radial centroid lo-
Figure 1. Wing planform shapes for different aspect ratios and non-dimensional radial centroid
cations.
locations.
Thewing
The wingmotion
motionemployed
employed in inthis
thisstudy
studyisisselected
selectedto
torepresent
representlift-based
lift-based‘normal
‘normal
hovering’ kinematics of insect wings, where the flapping waveform is
hovering’ kinematics of insect wings, where the flapping waveform is defined using defined using aa
sinusoidal function near the beginning and end of the half-stroke, whereas between
sinusoidal function near the beginning and end of the half-stroke, whereas between stroke stroke
reversals, the
reversals, the wing
wing has
hasconstant
constantvelocity.
velocity. The
The waveform
waveform function
function for
for flapping
flapping angular
angular
velocityatatstroke
velocity strokereversal
reversalis,
is,thus,
thus,given
givenbyby[29]:
[29]:
" ( ̂ − ̂ #)
( ̂ ) =. ± cosπ t̂ − t̂sa
. , ̂ ≤ ̂≤ ̂ + ̂ (6)
φ t̂ = ±φ M cos ̂ , t̂sa ≤ t̂ ≤ t̂sa + t̂ a (6)
t̂ a
where is the maximum flapping angular velocity; ̂ = / is the non-dimensional
.
time ranging
where φ M is thebetween
maximum 0 and 1 within
flapping angular a flapping t̂ = t/T̂ is
velocity; cycle; = the/non-dimensional
( being the
time ranging between 0 and 1 within a flapping cycle; t̂ a = t a /T (t a being the acceleration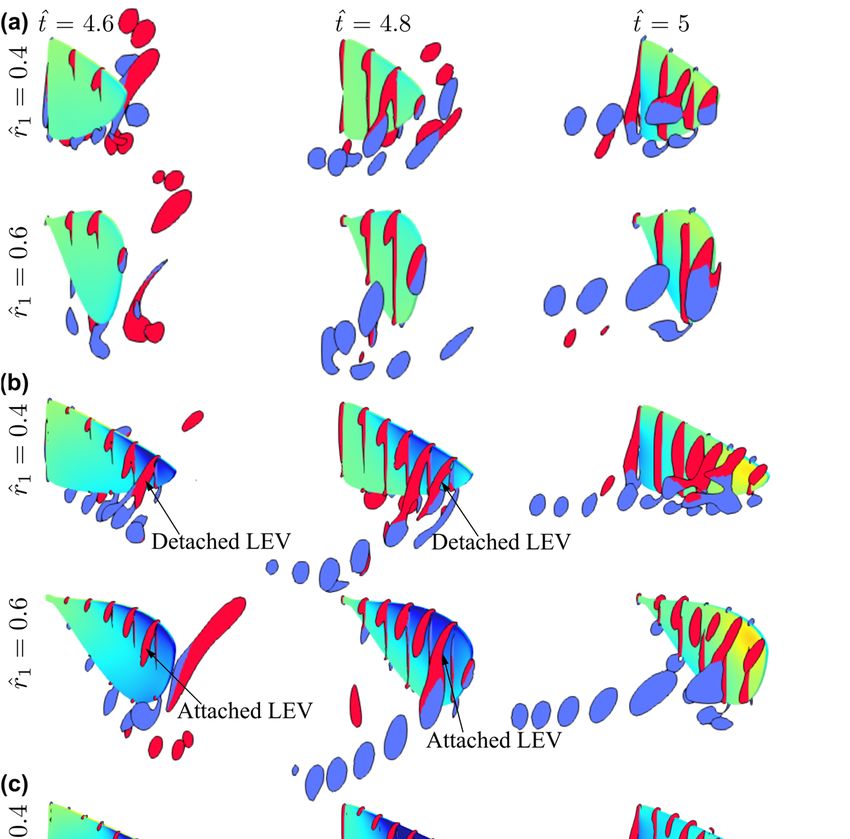
Insects 2022, 13, 459 6 of 26
duration) is the total non-dimensional acceleration duration at the beginning and end of a
half-stroke; and t̂sa is the non-dimensional time at which wing acceleration starts.
The pitching kinematic waveform is defined similarly, using a sinusoidal function
near the beginning and end of the half-stroke, while allowing a constant angle-of-attack
between stroke reversals. The pitching angular velocity near stroke reversal is, thus, given
by [29]: ( " #)
. Θ 2π t̂ − t̂sp
θ t̂ = ± 1 − cos , t̂sp ≤ t̂ ≤ t̂sp + t̂ p (7)
t̂ p t̂ p
where the wing pitch amplitude, Θ, is fixed as 90◦ for all wing planform shapes in the
Insects 2022, 13, x FOR PEER REVIEW
current study, corresponding to an angle of attack at mid half-stroke of 45◦ , known 7 ofto
26
allow maximum lift coefficient values [30]; t̂ p = t p /T (t p being the wing pitch duration)
is the total non-dimensional pitching duration during a half-stroke; and t̂sp is the non-
dimensional time at which
structure interaction wing pitching
simulation, starts.
Nakata and In[36]
Liu the current
analysedstudy, the flapping stroke
the aerodynamic perfor-
amplitude is fixed as 160 ◦ for all wing planform shapes, which is close to the upper limit
mance for the hovering flexible wings of the hawkmoth (Manduca sexta). They found that
reported for insect
wing flexibility can wing kinematics
increase [31]. The non-dimensional
lift production but also costs more acceleration and pitching
power. Overall, only a
durations,
3.4% increaset̂ and t̂ , are
a in aerodynamic
p chosen as 0.25. The wing kinematic waveforms for
efficiency was found for the flexible wing when comparedboth flapping
and
to apitching
rigid wing. motions
As a final are shown
example,in Figure
Zhao et2. al.
Note[37]that,
usedconstant flapping angular
a dynamically-scaled velocity
mechanical
and constant
model angle of attack
to experimentally waveforms
measure are known forces
the aerodynamic to be the
on most efficient
flapping wingswaveforms in
with variable
terms of aerodynamic power consumption to sustain a given amount
trailing-edge flexural stiffness at a Reynolds number of 2000. They showed that for low toof lift [30]. However,
these
mediumwaveforms
angles of areattack,
unrealistic for flapping
increasing flightdecreases
flexibility realizationthenear stroke reversals,
aerodynamic despite
force produc-
being
tion but the lift-to-drag ratio remains approximately constant. It was also noted aingood
mathematically elegant. As such, the waveforms adopted here represent their
compromise
study that the that is close enough
instantaneous forcetotraces
these reveal
optimum waveforms
no major whilein
differences maintaining the
the underlying
practicality aspect.
modes of force generation between flexible and rigid wings.
Figure 2. Employed wing kinematics waveforms for flapping and pitching.
Figure 2. Employed wing kinematics waveforms for flapping and pitching.
2.2. Numerical Simulation
The current study solves the incompressible Navier-Stokes equations for the flow
around the 3D wing: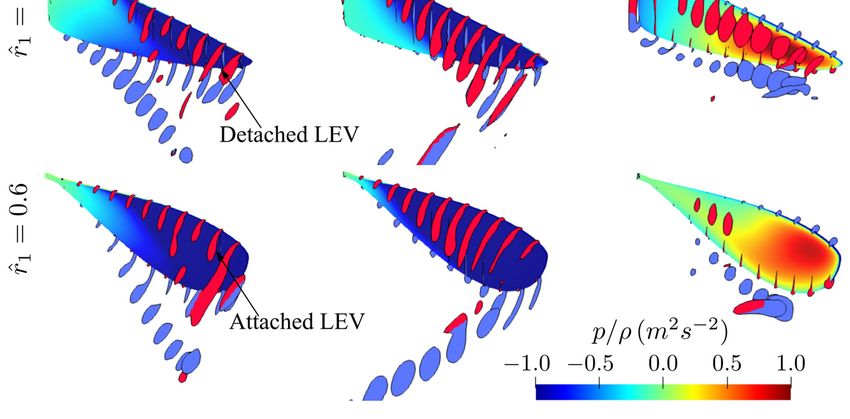
Insects 2022, 13, 459                                                                                              7 of 26

                              The average velocity of the wing at radius of gyration, r̂2 , over a flapping cycle, U2 , is
                        used to define the Reynolds number for a given mean chord value and kinematic viscosity, ν,
                        based on:
                                                                         U2 c
                                                                   Re =                                               (8)
                                                                          ν
                              We only consider a Reynolds number of 100, which is relevant to small insects similar
                        to fruit flies. It is worth noting here that the Reynolds number was found to have a
                        relatively small influence on force production for insect-like flapping wings in several other
                        studies [10,25,32,33]; however, some evidence showed that the mechanism for LEV stability
                        (e.g., core-wise flow strength) is different between low and high Reynolds numbers [34].
                              In the current study, the flapping frequency for all planform cases is kept constant,
                        and the kinematic viscosity is changed to ensure a constant Reynolds number value of
                        100 is achieved. This ensures that differences in aerodynamic and flow features observed
                        from our simulations for the different wings considered are due to planform effects.
                              Finally, it should be noted that we model insect wings as rigid surfaces; hence, the
                        effects of wing twist along the span, which is normally observed in real insects, is not
                        considered. Given that the twist distribution contributes towards controlling the load
                        distribution on a wing surface, it is not unexpected that any twist distribution resulting
                        from wing flexibility may have an influence on the LEV development and detachment.
                        Thus, this effect is an important direction to be further investigated in future studies.
                        That said, it should be noted that a wide range of previous studies have also shown
                        that rigid wings are able to capture the primary aerodynamic characteristics of hovering
                        insect wings with reasonable accuracy. For example, Du and Sun [35] used numerical
                        simulations to study the effects of camber and spanwise twist deformations for the wings
                        of a hovering hoverfly (Eristalis tenax). Their model showed that the time courses of lift,
                        drag, and aerodynamic power coefficients for a deformable wing are very similar to that
                        produced by a rigid wing, although a 10% higher lift was found for the flexible wing. Using
                        a fluid-structure interaction simulation, Nakata and Liu [36] analysed the aerodynamic
                        performance for the hovering flexible wings of the hawkmoth (Manduca sexta). They found
                        that wing flexibility can increase lift production but also costs more power. Overall, only a
                        3.4% increase in aerodynamic efficiency was found for the flexible wing when compared to
                        a rigid wing. As a final example, Zhao et al. [37] used a dynamically-scaled mechanical
                        model to experimentally measure the aerodynamic forces on flapping wings with variable
                        trailing-edge flexural stiffness at a Reynolds number of 2000. They showed that for low to
                        medium angles of attack, increasing flexibility decreases the aerodynamic force production
                        but the lift-to-drag ratio remains approximately constant. It was also noted in their study
                        that the instantaneous force traces reveal no major differences in the underlying modes of
                        force generation between flexible and rigid wings.

                        2.2. Numerical Simulation
                            The current study solves the incompressible Navier-Stokes equations for the flow
                        around the 3D wing:
                                                              ∂ui
                                                                  =0                                      (9)
                                                              ∂xi
                                                     ∂ui    ∂              1 ∂p
                                                                                 + ν ∇2 u i

                                                         +      u j ui = −                                           (10)
                                                     ∂t    ∂x j            ρ ∂xi
                        where ui and u j denote the flow velocity components in the global Cartesian coordinate
                        system; xi and x j denote the coordinate components within the domain; t denotes time; p
                        denotes pressure; and ρ denotes the fluid density.
                             The open-source package OpenFOAM was employed to solve the above equations
                        using a cell-centred finite volume method. For the incompressible flow, a segregated
                        PIMPLE algorithm, which integrates a PISO (Pressure-Implicit with Splitting of Operators)
                        inner loop and a SIMPLE (Semi-Implicit Method for Pressure Linked Equations) outer
                        corrector loop, is used to solve the pressure-velocity coupling [38,39]. A second order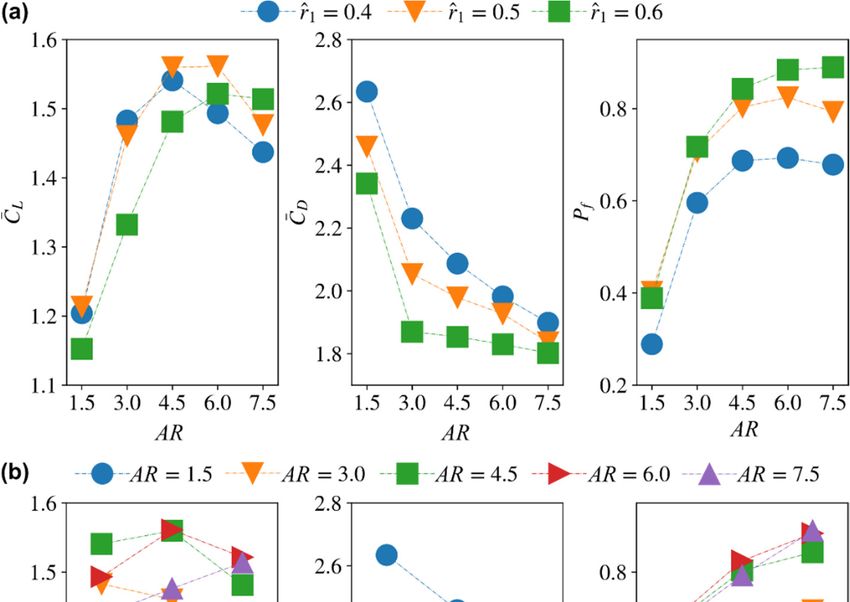
The open-source package OpenFOAM was employed to solve the above equations
using a cell-centred finite volume method. For the incompressible flow, a segregated PIM-
PLE algorithm, which integrates a PISO (Pressure-Implicit with Splitting of Operators)
inner loop and a SIMPLE (Semi-Implicit Method for Pressure Linked Equations) outer
corrector
Insects 2022, 13, 459 loop, is used to solve the pressure-velocity coupling [38,39]. A second order cen- 8 of 26
tral/backward differencing scheme is used for spatial gradient/time evolution terms. The
pressure equation is solved using a GAMG (Geometric-algebraic Multi Grid) method, and
the velocity equation is solved using
central/backward a Gauss-Seidel
differencing scheme method.
is used for spatial gradient/time evolution terms.
The pressure
The computational set-upequation
consistsis of
solved using a GAMG
a stationary outer (Geometric-algebraic
spherical domain and Multia Grid)
mov-method,
and the velocity equation is solved using a Gauss-Seidel method.
ing inner spherical domain with the wing placed at the origin. The outer domain far-field
The computational set-up consists of a stationary outer spherical domain and a moving
boundary has a uniform fixed zero values for (gauge) pressure and velocity gradient. A
inner spherical domain with the wing placed at the origin. The outer domain far-field
no-slip boundary condition
boundary has is applied
a uniformatfixed
the zero
wingvalues
surface. The inner
for (gauge) and and
pressure outer domains
velocity gradient. A
are linked with a spherical sliding interface. The inner sphere has a radius of 36
no-slip boundary condition is applied at the wing surface. The inner and outer ̅ and thedomains
outer sphere has aare radius
linked 40 ̅ afor
ofwith all thesliding
spherical wing planforms,
interface. The which
inner ensures that
sphere has the flow
a radius of 36c and
disturbances resulting from wing motions have negligible influence on the far-fieldthat the
the outer sphere has a radius of 40c for all the wing planforms, which ensures
flow disturbances resulting from wing motions have negligible influence on the far-field
boundary. The computational meshes for the different wing planforms are generated us-
boundary. The computational meshes for the different wing planforms are generated using
ing the snappyHexMesh utility within OpenFOAM. The computational domain and mesh
the snappyHexMesh utility within OpenFOAM. The computational domain and mesh
distribution near the wing surface
distribution are
near the shown
wing in Figure
surface are shown 3. in Figure 3.
Figure 3. Computational
Figuredomain and mesh
3. Computational setup.and
domain (a)mesh
Domain and
setup. boundary
(a) Domain anddefinitions; (b) mesh(b) mesh
boundary definitions;
distribution near thedistribution
wing surface; note
near the that
wing extra note
surface; refinement
that extrawas applied
refinement atapplied
was both the wing’s
at both lead- leading-
the wing’s
ing- and trailing-edges.
and trailing-edges.
Throughout the
Throughout the simulations, simulations,
the the inner
inner domain domain
rotates aboutrotates
theabout the origin
origin to produce the
to produce
required flapping and pitching motions. The inverse distance algorithm is used as a means
the required flapping and pitching motions. The inverse distance algorithm is used as a
for interpolating the fluid variables at the sliding interface. Thus, no mesh deformation or
means for interpolating the fluid
re-meshing variables
is required, whichatensures
the sliding interface.
a high-quality meshThus, no mesh
throughout the defor-
simulations.
mation or re-meshing is required, which ensures a high-quality mesh throughout
The lift, drag, and power coefficients are evaluated using the relations: the sim-
ulations.
The lift, drag, and power coefficients are evaluated 2L t̂
using the relations:
CL t̂ = (11)
ρU22 S
2 ( ̂)
( ̂) = 2D t̂
(11)
CD t̂ = (12)
ρU22 S
2 ( ̂ ) 2P t̂
( ̂) = CP t̂ = (12) (13)
ρU23 S
where L t̂ and D t̂ are the instantaneous lift and drag forces; P t̂ is the aerodynamic
2 ( ̂) →
( ̂ ) = from the inner product of aerodynamic moment,
power at time instance t̂, obtained (13) M t̂ ,
→
and angular velocity, ω t̂ :
→ →
P t̂ = M t̂ · ω t̂ (14)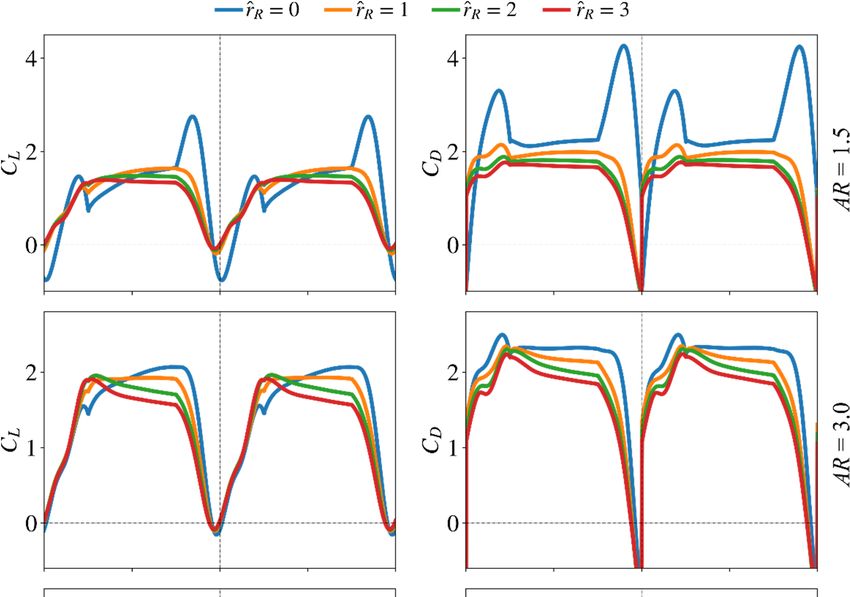
Insects 2022, 13, 459                                                                                           9 of 26

                            The aerodynamic performance is also assessed using the average lift, drag, and aero-
                        dynamic power coefficients over a flapping cycle, based on the relations:
                                                                     Z 1
                                                              CL =         CL t̂ dt̂                              (15)
                                                                      0
                                                                     Z 1
                                                             CD =          CD t̂ dt̂                              (16)
                                                                      0
                                                                     Z 1
                                                             CP =          CP t̂ dt̂                              (17)
                                                                      0
                             The mass specific power, P∗ , [40] is expressed as:
                                                                      R1
                                                                ∗      0   P t̂ dt̂
                                                              P =                                                 (18)
                                                                           Mg

                        where M is the total mass, and g is the gravitational acceleration. Assuming lift equals to
                               R1
                        weight, 0 L t̂ dt̂ = Mg, which reasonably holds for insects in hovering flight. The above
                        equation reduces to:
                                                               s                       s
                                                    C               2Mg     C              2Mg   CP
                                            P = U2 × P =
                                              ∗
                                                                           × P=                × 3/2              (19)
                                                    CL              ρC L S  CL              ρS  CL

                        In the above equation, the first term is constant for a given mass and wing area; hence,
                        the second term can be used as a metric for evaluating aerodynamic efficiency. In the
                        current study, the inverse of this second term, which we name as power factor, Pf , due to
                        the similarity with the classical power factor for fixed wing motions (CL3/2 /CD ) [25,41], is
                        defined as:
                                                                         3/2
                                                                       C
                                                                 Pf = L                                          (20)
                                                                        CP
                        The above definition of the power factor is used in the current study to measure the
                        aerodynamic efficiency for different wing planform shapes.
                             In the current study, the vortical structures are identified using the well-known Q-
                        criterion [42]. It is worth mentioning, at this stage, that the simulations in this study are
                        conducted using the Computational Shared Facility (CSF3) at the University of Manchester
                        comprising a range of CPU cores from Intel Xeon E5-2640 Sandy Bridge to Intel Xeon
                        Gold 6130 Broadwell. Each simulation case is set using 32 cores running in parallel. The
                        computational time for each case is between 48 to 72 h, depending on the wing planform
                        shape.

                        2.3. Convergence Assessment
                             For our simulations, mesh systems with approximately 2.0–5.6 million cells are em-
                        ployed, which have approximately 29,000–144,000 nodes on the wing surface, depending
                        on the wing planform case. The time step size (∆t) is set as 1 × 10⁻³ (relative to the flap-
                        ping cycle, T). These numerical settings are decided based on a convergence study that
                        compared the results obtained from the mesh with three million cells and a time step size
                        of 1 × 10⁻³ to a higher-density mesh with six million cells and a smaller time step size of
                        5 × 10⁻⁴ for a baseline wing geometry with AR = 3, r̂1 = 0.5, r̂ R = 0, representing a wing
                        geometry typically found in insects [11,25]. The comparison of the instantaneous lift and
                        drag coefficients from this convergence study is presented in Figure 4. The average force
                        coefficients are also provided in Table 2. The results show that the maximum difference in
                        C L and C D for the different mesh and time step size cases is less than 0.7%. As such, the
                        mesh size with three million cells and the time step size of 1 × 10⁻³ are deemed acceptable
                        for the baseline wing geometry demonstrated here.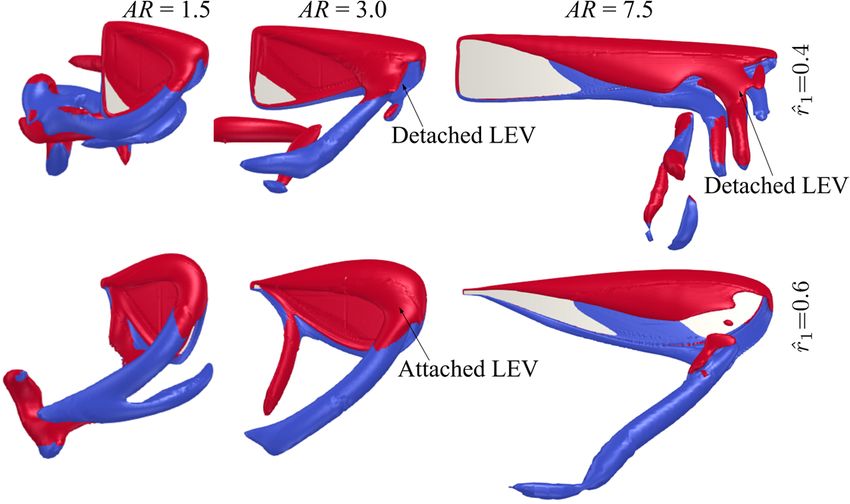
× 10−4 for a baseline wing geometry with = 3, ̂ = 0.5, ̂ = 0, representing a wing
geometry typically found in insects [11,25]. The comparison of the instantaneous lift and
drag coefficients from this convergence study is presented in Figure 4. The average force
coefficients are also provided in Table 2. The results show that the maximum difference
Insects 2022, 13, 459
in ̅ and ̅ for the different mesh and time step size cases is less than 0.7%. As such, 10 of 26
the mesh size with three million cells and the time step size of 1 × 10⁻³ are deemed accepta-
ble for the baseline wing geometry demonstrated here.
Figure 4. Mesh and time step convergence results. Negligible difference between cases is evident.
Figure 4. Mesh and time step convergence results. Negligible difference between cases is evident.
Table2.2.Average
Table Averagelift
liftand
anddrag
drag coefficients
coefficients for
for the
theconvergence
convergencestudy.
study.
Mesh Cells, Time Step ¯ ¯
Mesh Cells, Time Step CL CD
3 million cells, ∆ = 1 × 10⁻³ 1.460 2.046
36million cells,∆t∆= 1= ×
millioncells, −3−3
1 ×10¹⁰ 1.471
1.460 2.052
2.046
∆t −3−4
million cells, ∆ = 5 × 10
63million cells, = 1 × 10 1.471
1.460 2.052
2.046
−4
36million cells,∆t∆= 5= ×
millioncells, 5 ×10¹⁰−4 1.460
1.470 2.046
2.052
6 million cells, ∆t = 5 × 10⁻⁴ 1.470 2.052
The flow evolution history for the baseline case used for the convergence study is
shownTheinflowFigure 5a. The history
evolution red and for blue thecolours
baselineindicate
case counter-clockwise
used for the convergenceand clockwisestudy is
rotating vortices with respect to the axis from wing root
shown in Figure 5a. The red and blue colours indicate counter-clockwise and to wing tip. The flow structures
clockwise
at sevenvortices
rotating differentwith
spanwise
respect locations
to the axisbetween
from the wingwing rootroot and wingtip
to wing tip. Thefor a range
flow of
structures
time instances are shown in Figure 5b. In this study, the force
at seven different spanwise locations between the wing root and wingtip for a range of coefficients are shown for
the fifth
time flapping
instances arecycle
shown where the flow
in Figure 5b.hasInreached
this study, periodic
the forcestate coefficients
and initial disturbances
are shown for
have diminished, and the flow structures are shown
the fifth flapping cycle where the flow has reached periodic state and for the second halfinitial
of the disturbances
fifth flap-
ping cycle due to the symmetry between forward and backward half-strokes. Addition-
have diminished, and the flow structures are shown for the second half of the fifth flapping
ally, all average quantities, in this study, were evaluated over the fifth flapping cycle.
cycle due to the symmetry between forward and backward half-strokes. Additionally, all
To provide a general view of flow structure evolution on insect wings, the flow de-
average quantities, in this study, were evaluated over the fifth flapping cycle.
velopment for the baseline wing planform is first investigated. At the beginning of the
To provide a general view of flow structure evolution on insect wings, the flow
half-stroke, ̂ = 4.5, the leading-edge vortex (LEV) starts to form on the leading-edge of
development for the baseline wing planform is first investigated. At the beginning of the
the wing. The separated LEV and tip vortex (TV) from the previous half-stroke remain in
half-stroke, t̂ = 4.5, the leading-edge vortex (LEV) starts to form on the leading-edge of
the wake region near the wing surface. The wing enters the wake region at ̂ = 4.55; at
the wing. The separated LEV and tip vortex (TV) from the previous
the same time, the trailing-edge vortex (TEV) starts to form at the trailing-edge of the
half-stroke remain
inwing.
the wake
At ̂ =region near
4.6–4.65, thethe wing surface.
connected LEV, TEV,The and wingTVentersform the wake region
a ring-like structure,at t̂ and
= 4.55;
atthe
theTEV
same time,
starts the trailing-edge
to detach from the wing vortex (TEV)
surface, startsthe
whereas to LEV
formremains
at the trailing-edge
close to the wing of the
wing. t̂
surface. The LEV has larger size towards the wingtip, resulting in a conical shaped vortexand
At = 4.6–4.65, the connected LEV, TEV, and TV form a ring-like structure,
the TEV starts
structure attachedto detach fromleading-edge.
on the wing the wing surface,After whereas
̂ = 4.75, the thevortex-ring
LEV remains closeinto
develops to the
wing surface. The LEV has larger size towards the wingtip,
an elongated tube-like structure formed by the LEV and TV, which convects vorticity resulting in a conical shaped
vortex structure
downstream attached
into the wake.onThe the flow
wingstructure
leading-edge.
remains After t̂ = 4.75,
similar until the
endvortex-ring develops
of the half-stroke,
but the LEV gradually increases in size until ̂ = 4.95, where a new TEV starts to appear
into an elongated tube-like structure formed by the LEV and TV, which convects vorticity
downstream into the wake. The flow structure remains similar until end of the half-stroke,
but the LEV gradually increases in size until t̂ = 4.95, where a new TEV starts to appear
at the trailing-edge. At end of the half-stroke, t̂ = 5, a larger TEV is evident near the
trailing-edge and the LEV separates from the leading-edge and detaches from the wing
surface at the outboard wing region.Insects 2022, 13, x FOR PEER REVIEW 11 of 26
Insects 2022, 13, 459
at the trailing-edge. At end of the half-stroke, ̂ = 5, a larger TEV is evident near the11trail-
of 26
ing-edge and the LEV separates from the leading-edge and detaches from the wing sur-
face at the outboard wing region.
Figure
Figure5.5.Flow
Flowevolution
evolutionatatdifferent
differenttime
timeinstances
instancesfor
forthe
thebaseline
baselinecase.
case.(a)
(a)Complete
Completeflow
flowstructure
structure
on the wing surface. (b) Flow structure at different spanwise locations. Colour map
on the wing surface. (b) Flow structure at different spanwise locations. Colour map representsrepresents kin-
ematic pressure on the wing surface. For clarity of visualisations, the wing view angle
kinematic pressure on the wing surface. For clarity of visualisations, the wing view angle is keptis kept con-
stant, and and
constant, thusthus
is not
is reflective of the
not reflective of wing’s instantaneous
the wing’s angle
instantaneous of attack.
angle of attack.
2.4.Validation
2.4. Validationofofthe
theNumerical
NumericalSet-Up
Set-Up
To provide
To provide aa validation
validation demonstration
demonstration of of the
the developed
developed numerical
numerical solver,
solver, thethe lift
lift
coefficientvalues
coefficient valuesofof the
the well-known
well-knownexperimental
experimentalbenchmark
benchmarkfruit fruitfly
fly case
case ofof Dickinson
Dickinson
et al.
et al. [5]
[5] are
are compared
compared against
againstresults
resultsfor
forthe
thesame
samecase
caseevaluated
evaluatedusingusingthethecurrent
currentnu- nu-
merical set-up. Moreover, the simulation results from several CFD studies
merical set-up. Moreover, the simulation results from several CFD studies in the literature in the literature
thatalso
that alsoprovided
providedananassessment
assessmentagainst
againstthe
thesame
samefruit
fruitfly
flyexperimental
experimentalcase caseareareincluded
included
forcomparison.
for comparison.Here,Here,thethewing
wingplanform
planformshape
shapeemployed
employedfor forvalidation
validationisisaanatural
naturalfruit
fruit
fly wing
fly wing similar
similarto
to that
that employed
employedby byDickinson
Dickinsonet etal.
al.[5],
[5], and
and isis shown
shown inin Figure
Figure 6a.6a. The
The
wing has an aspect ratio of 2.44, and the wing’s cross section has a thickness
wing has an aspect ratio of 2.44, and the wing’s cross section has a thickness to mean chord to mean
chordofratio
ratio 4%. of
The4%. Thekinematics
wing wing kinematics
for thefor the advanced,
advanced, symmetric,
symmetric, and delayed
and delayed pitchingpitching
mo-
motion waveforms are all taken from the experiments of Dickinson
tion waveforms are all taken from the experiments of Dickinson et al. [5], and the simula-et al. [5], and the
simulations
tions are out
are carried carried
at a out at a Reynolds
Reynolds number number of 136.
of 136. Note thatNote that all presented
all presented results from results
the
from the different CFD studies employ wing planforms and kinematics consistent with
that of Dickinson et al. [5]; nevertheless, in some cases, e.g., as in Kweon and Choi [43], a
detailed explanation of the used planform is not explicitly provided. Figure 6b shows theFOR PEER REVIEW 12 of 26
Insects 2022, 13, 459 12 of 26
different CFD studies employ wing planforms and kinematics consistent with that of
Dickinson et al. [5]; nevertheless, in some cases, e.g., as in Kweon and Choi [43], a detailed
explanation of the used planform
comparison is instantaneous
of the not explicitlylift
provided. Figure
coefficient values6b shows
from the comparison
our current set-up against all
of the instantaneous liftstudies.
other coefficient values from
Furthermore, our current
a comparison set-up
of the against
average all other(Cstudies.
lift coefficients L ) is presented
in Table 3. of the average lift coefficients ( ̅ ) is presented in Table 3.
Furthermore, a comparison
Figure 6. (a) Fruit flyFigure
wing6.planform shape employed within the validation study. (b) Comparison
(a) Fruit fly wing planform shape employed within the validation study. (b) Comparison of
of the lift coefficientsthe
from the current simulation set-up against experimental (from Dickinson et al.
lift coefficients from the current simulation set-up against experimental (from Dickinson et al. [5])
[5]) and numerical (from Erzincanli
and numerical (from and Sahin [44],
Erzincanli Kweon
and Sahin [44],and Choi
Kweon and[43],
Choiand
[43], Sun andand
and Sun Tang
Tang[29])
[29]) results
results for advanced,forsymmetric, and delayed pitching kinematic cases.
advanced, symmetric, and delayed pitching kinematic cases.
Table
Table 3. Comparison 3. Comparison
of average of average from
lift coefficients lift coefficients from studies
studies used used for validation.
for validation.
CFD,
Exp., Dickinson et al.
Kinematic
CFD, Erzincanli Exp.,
CFD,
CFD, Kweon and
Erzincanli
CFD,
CFD, Sun and
Kweon CFD, Sun
se CFD, Current Dickinson and Choi
[5] Case and Sahin [44]
Current Choiand
[43]
Sahin Tang [29] and Tang
et al. [5] [43] [29]
0.405 0.491 0.438 - [44] 0.387
0.340 0.473 Advanced 0.405
0.360 0.491 0.3230.438 - - 0.387
Symmetric 0.340 0.473 0.360 0.323 -
0.170 0.237 Delayed 0.183
0.170 0.237 - 0.183 - - -
The results showThethatresults
the lift
showcoefficient
that the liftvalues from
coefficient ourfrom
values current simulation
our current are are
simulation in in very
very good agreementgood with that with
agreement reported by other
that reported studies.
by other Only
studies. minor
Only minordifferences existbetween
differences exist
the different
between the different CFD results,
CFD results, and and
these these
may maybebedue
duetoto slight
slight differences
differences in the method of
in the
reproducing the wing planform shape and kinematics adopted
method of reproducing the wing planform shape and kinematics adopted by each study. by each study. Nevertheless,
and more importantly, the trends and average values from our CFD simulation set-up
Nevertheless, and more importantly, the trends and average values from our CFD simu-
closely follow those from the other CFD studies. Notably, all CFD results share some
lation set-up closely follow against
differences those from the other results,
the experimental CFD studies.
which mayNotably,
be due toallpotential
CFD results
measurement
share some differences against the experimental results, which may be due to potential
inaccuracies or differences in the morphology/kinematics employed. That said, it is
measurement inaccuracies
important toornote
differences in the
that the main morphology/kinematics
difference between experimentsemployed. That results
and all numerical
said, it is important to note that the main difference between experiments and all numer-
ical results always occurs at the start of half-strokes, where a noticeable peak in lift is
mainly seen within the advanced and symmetric pitching cases. These peaks are ex-
plained by Dickinson et al. [5] to be a result of the wake capture effect. However, suchInsects 2022, 13, 459 13 of 26
Insects 2022, 13, x FOR PEER REVIEW 13 of 26
always occurs at the start of half-strokes, where a noticeable peak in lift is mainly seen
within the advanced and symmetric pitching cases. These peaks are explained by Dickinson
et al. [5] to be a result of the wake capture effect. However, such peaks have been absent
known
from CFDdebates withinand
simulations, the this
fieldhas
of aerodynamics
created one of theof insect
most flight where debates
well-known experiments
withinshow
the
field of aerodynamics
an effect which seems of to
insect flight where
be absent from experiments show an effect
numerical simulations. Forwhich
more seems to be
discussions
absent fromdebate,
about this numerical simulations.
the reader For more
is referred discussions
to [29,45]. about this
Experimental debate,
results, the reader
however, showis
referred to [29,45].
less evidence Experimental
of such results, however,
peaks for delayed show less evidence
pitching kinematics, of such
and for such peaks
case, for
a good
delayed
similaritypitching
between kinematics, andand
experiments for such
CFD case, a good
exists. similarity
As such, between
overall, experiments
the qualitative and
and CFD exists.
quantitative As such, between
agreement overall, theourqualitative
simulationsandandquantitative agreement
the experimental between
and our
numerical
simulations
benchmarkand the experimental
results and numerical
provides confidence benchmarksimulation
in the numerical results provides
set-upconfidence
employed in in
the numerical
this study. simulation set-up employed in this study.
3.3.Results
ResultsandandDiscussion
Discussion
3.1. Effect of Aspect Ratio
3.1. Effect of Aspect Ratio
In this section, the effect of aspect ratio on aerodynamic force production is inde-
In this section, the effect of aspect ratio on aerodynamic force production is inde-
pendently studied. The other morphological parameters are set constant, within this
pendently studied. The other morphological parameters are set constant, within this as-
assessment, to their nominal values: r̂1 is set to 0.5 and the wing root offset is set to
sessment, to their nominal values: ̂ is set to 0.5 and the wing root offset is set to zero, ̂
zero, r̂ R = 0. Different aspect ratio values ranging between 1.5 to 7.5, with a step of 1.5,
= 0.investigated.
are Different aspect ratio7values
Figure showsranging between 1.5 lift
the instantaneous to 7.5,
andwith
draga step of 1.5, are
coefficients investi-
from this
gated. Figure
assessment. 7 shows the instantaneous lift and drag coefficients from this assessment.
Figure 7.
Figure 7. Time
Timehistories
historiesofofthe liftlift
the and drag
and coefficients
drag for different
coefficients aspect
for different ratios.ratios.
aspect The non-dimen-
The non-
sional radial centroid location is set to 0.5 and the wing root offset to zero.
dimensional radial centroid location is set to 0.5 and the wing root offset to zero.
Thelift
The liftand
anddrag
dragcoefficient
coefficienttime
timehistories
historiesshow showlarge
largetransient
transientpeaks peaksforforthe
thelowest
lowest
aspect ratio case ( = 1.5), which differs from other aspect ratios
aspect ratio case (AR = 1.5), which differs from other aspect ratios whose transient force whose transient force
coefficient peaks
coefficient peaks near
near the
the start
start of
ofaahalf-stroke
half-strokeare areless
lessnoticeable
noticeableand andhave
haveno noobvious
obvious
peaksnear
peaks nearthe theend
end of of half-strokes.
half-strokes. However,
However, theand
the lift lift drag
and drag coefficients
coefficients at midathalf–stroke
mid half–
isstroke
lowerisforlower
the ARfor the
= 1.5 case,= 1.5 case, compared
compared with higher withaspect
higherratioaspect ratioIncases.
cases. In fact,
fact, higher
higher aspect ratios show faster increase of lift coefficient at the beginning
aspect ratios show faster increase of lift coefficient at the beginning of the translational of the transla-
tional phase.
phase. After the Aftermid the mid half-stroke,
half-stroke, for ARfor = 1.5 to= 3,1.5lift
to coefficient
3, lift coefficient continues
continues to in-
to increase
crease
until enduntil endtranslational
of the of the translational phase, whereas,
phase, whereas, for aspectfor aspect
ratios ratios
greater greater
than than
4.5, lift and4.5, lift
drag
and drag coefficients
coefficients remainconstant
remain relatively relativelyorconstant or start to decrease.
start to decrease.
Theflow
The flowstructures
structuresforforthethe different
different aspect
aspect ratio
ratio cases cases
(AR( = 1.5–7.5,
= 1.5–7.5,
exceptexcept
for AR for= 3,
= 3, which
which has beenhas been comprehensively
comprehensively shown shown in Figure
in Figure 5) near 5)the
near midthehalf-stroke
mid half-stroke = 4.8) ̂
(i.e., t̂ (i.e.,
= 4.8) is shown in Figure 8a, whereas the sectional vortical structures
is shown in Figure 8a, whereas the sectional vortical structures together with the surface together with the
surface pressure
pressure fields at time
fields at different different time along
instances instances along the half-stroke
the half-stroke (i.e., t̂ = 4.6,(i.e., ̂
4.8 and=5.0) 4.6,are
4.8
and 5.0)
shown inare shown
Figure 8b. in Figure 8b.Insects 2022, 13, 459 14 of 26
2, 13, x FOR PEER REVIEW 14 of 26
Figure 8. Flow structures at different time instances for the different aspect ratio cases. (a) Flow
Figure 8. Flow structures at different time instances for the different aspect ratio cases. (a) Flow
structure near mid-stroke ( ̂ = 4.8), (b) Sectional vortical structure and surface pressure field near
structure
the beginning, near the middle, and at the(t̂end
near mid-stroke = 4.8), (b) Sectional
of the vortical structure and surface pressure field near the
half-stroke.
beginning, near the middle, and at the end of the half-stroke.
Comparing the flow structures for the different aspect ratio cases, it can be seen that
for the lower aspect ratio cases, the LEV is more closely attached to the wing surface,
whereas the LEV becomes more distant from the wing surface as the aspect ratio increases.
For low aspect ratios, the LEV gets merged with the tip vortex and shed downstream,
whereas for high aspect ratios, the LEV starts to get detached from the wing surface nearInsects 2022, 13, 459 15 of 26
Comparing the flow structures for the different aspect ratio cases, it can be seen that for
the lower aspect ratio cases, the LEV is more closely attached to the wing surface, whereas
the LEV becomes more distant from the wing surface as the aspect ratio increases. For low
aspect ratios, the LEV gets merged with the tip vortex and shed downstream, whereas for
high aspect ratios, the LEV starts to get detached from the wing surface near the wing tip.
In this study, the LEV detachment location is approximately identified at the location where
a local TEV is initiated. This is because when the LEV detaches from the wing surface, a
TEV is formed due to flow reversal around the trailing-edge, as shown in [46,47]. Note
that this criterion has been employed for identifying LEV detachment location in other
studies, e.g., [20]. It is found that the detachment location moves slightly further away
from the wing root as aspect ratio increases but remains at approximately r/c = 3.5–5.0 for
the different aspect ratios. However, as aspect ratio increases, the LEV detachment area
near the wing tip increases; it is therefore likely that the detachment of the LEV in that
region leads to the relatively constant/reduced lift and drag coefficient after mid half-stroke
for aspect ratio greater than 4.5. Notably, the current results agree with the experimental
study of Kruyt et al. [24], which showed that the detachment of LEV or ‘stall’ location was
found at r/c = 4.0. However, in their experiment, a steady revolving wing was employed,
whereas in the current flapping wing case, the wing experiences cyclic formation of LEV
within each half-stroke.
For aspect ratios greater than 4.5, at the end of the half-stroke, i.e., t̂ = 5.0, an obvious
high-pressure region is evident on the outboard region of the wing. The high pressure is
related to the LEV-TEV pair, which can be clearly seen from Figure 8b for AR = 4.5–7.5. We
note here that this high-pressure region resulting from the LEV-TEV pair in the wake of high
aspect ratio wings may be significant for determining the wake capture force contribution
in the subsequent half-stroke.
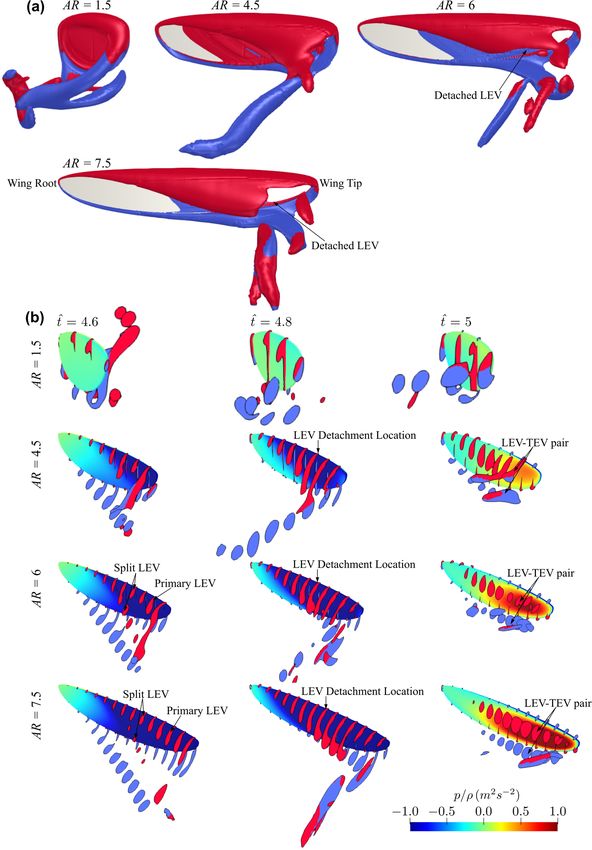
3.2. Effect of Radial Centroid Location
The effect of radial centroid location on the force production and flow structure
evolution is studied in this section. Here, the lowest aspect ratio (AR = 1.5), the highest
aspect ratio (AR = 7.5), and a representative aspect ratio for most insect wings (AR = 3)
are used to study the effect of r̂1 . The remaining two aspect ratio cases are not included in
this section to avoid excessive discussions, but their average results will be shown later
in the paper. Here, the wing root offset is also set to zero, as it is most representative for
typical real insects (note that the wing offset is usually a consequence of mechanical design
constraints of flapping wing rigs or robotic insects, but is not common in real insects).
Nonetheless, its effect will be discussed in the next section. The instantaneous values of the
lift and drag coefficients are shown in Figure 9.
For the smallest aspect ratio case (AR = 1.5), changing r̂1 shows larger influence on
the transient peaks of lift and drag coefficients near the beginning and end of a half-stroke:
the peaks of the lift and drag coefficients reduce with the increase of r̂1 , indicating reduced
contribution of wing pitching rotation to force production as r̂1 increases. For the other
aspect ratio cases (e.g., AR = 3 and 7.5), varying r̂1 mostly influence the coefficient values
near the beginning of the half-stroke. For AR = 3, increasing r̂1 is found to reduce lift and
drag coefficients. The reduction of lift and drag coefficients is most significant in the first
part of the half-stroke, between t̂ = 4.6–4.8. However, the lift coefficient values, for the
different r̂1 cases, reach similar values near the end of the half-stroke. Similarly, the drag
coefficient for the different r̂1 cases become closer towards the end of a half-stroke, but not
as close as in the lift coefficient case. For AR = 7.5, higher r̂1 leads to higher lift coefficient
values and a noticeable peak is evident for the r̂1 = 0.6 case at t̂ = 4.15 and 4.65. On the
other hand, the drag coefficient values for the r̂1 = 0.6 case are lower than the smaller r̂1
cases, except at t̂ = 4.15 and 4.65.You can also read