What is the Impact of 5G Towers on the Exposure over Children, Teenagers and Sensitive Buildings? - arXiv
←
→
Page content transcription
If your browser does not render page correctly, please read the page content below
1

                                          What is the Impact of 5G Towers on the Exposure
                                          over Children, Teenagers and Sensitive Buildings?
                                                               Luca Chiaraviglio,(1,2) Chiara Lodovisi,(1,2) Daniele Franci,(3) Enrico Grillo,(3)
                                                     Settimio Pavoncello,(3) Tommaso Aureli,(3) Nicola Blefari-Melazzi,(1,2) Mohamed-Slim Alouini,(4)
                                                                     (1) EE Department, University of Rome Tor Vergata, Rome, Italy,
                                                           email {luca.chiaraviglio@uniroma2.it, Lodovisi@ing.uniroma2.it, blefari@uniroma2.it}
                                                              (2) Consorzio Nazionale Interuniversitario per le Telecomunicazioni, Parma, Italy
                                                         (3) Agenzia Regionale per la Protezione Ambientale del Lazio (ARPA Lazio), Rome, Italy,
                                                               {daniele.franci, enrico.grillo, settimio.pavoncello, tommaso.aureli}@arpalazio.it
                                                     (4) CEMSE Division, King Abdullah University of Science and Technology, Thuwal, Saudi Arabia
arXiv:2201.06944v1 [cs.NI] 18 Jan 2022

                                                                                        email slim.alouini@kaust.edu.sa

                                            Abstract—The rolling-out of 5G antennas over the             is harmful for health [5], [6]. Nevertheless, the
                                         territory is a fundamental step to provide 5G connectivity.     assessment of EMF radiated by base stations over
                                         However, little efforts have been done so far on the            children, teenagers and sensitive places may be a
                                         exposure assessment from 5G cellular towers over young
                                                                                                         key aspect for current (and future) epidemiological
                                         people and sensitive buildings like schools and medical
                                         centers. The goal of this article is therefore to explain why   studies [7], aimed at studying possible (but still not
                                         the 5G service strongly leverages the deployment of 5G          proven at present time) correlations between the
                                         antennas over cellular towers, how a tower installation         levels of 5G exposure and the emergence of long-
                                         hosting 5G antennas affects exposure over the territory,        term health diseases (such as cancers and tumors).
                                         and at what extent children/teenagers, schools and medical      Despite the literature about EMF exposure assess-
                                         centers are impacted by the exposure from 5G towers.
                                                                                                         ment from mobile base stations (including other
                                            5G networks are being deployed in many coun-                 Radio-Frequency (RF) sources) is already rather
                                         tries of the world. Despite the potentials of this              mature (see e.g., [8]–[10] for pre-5G studies and
                                         technology have not been completely unleashed,                  [11]–[15] for 5G ones), there is currently a lack
                                         a central point of debate is how 5G influences                  of studies focusing on the exposure radiated by 5G
                                         Electro-Magnetic Field (EMF) exposure over the                  outdoor base stations over children, teenagers, and
                                         population, and whether such exposure patterns will             sensitive places.
                                         substantially increase in the forthcoming years [1].               More concretely, Morelli et al. [16] evaluate the
                                         In this context, the assessment of the exposure                 EMF levels over children and adults by considering
                                         levels generated by mobile networks over children               user terminals (and not base stations) as sources of
                                         and teenagers is gaining attention in the academic              exposure. Bonato et al. [17] investigate the personal
                                         community (see e.g., [2], [3]), as young people will            exposure from indoor access points. Personal pre-
                                         (probably) receive higher exposure levels through-              5G exposure over children is collected through
                                         out their lives compared to older people - who                  exposimeters and thoroughly analyzed by Birks et
                                         tended to live in an era where mobile networks                  al. [18]. Pre-5G exposure in sensitive places (school
                                         were not so widespread as today. In addition, the               buildings) is measured by Ramirez-Vazquez et al.
                                         exposure assessment over sensitive places, such as              [19]. Gallastegi et al. [20] perform a thorough
                                         schools and medical centers, is central for moni-               assessment of pre-5G exposure over different areas
                                         toring aspects, e.g., to (possibly) limit the amount            (including homes and schools). Eventually, pre-5G
                                         of unwanted exposure over specific groups like                  exposure in kinder-gardens is analyzed by Bhatt
                                         students and patients.                                          et al. [21]. Finally, 5G exposure measurements for
                                            Currently, there is no scientific evidence that base         different locations in South Korea are analyzed
                                         station exposure adhering to international guidelines           by Selmaoui et al. [15]. Despite we recognize
                                         (such as the International Commission on Non-                   the importance of such previous works, none of
                                         Ionizing Radiation Protection (ICNIRP) ones [4])                them is tailored to the assessment of 5G exposure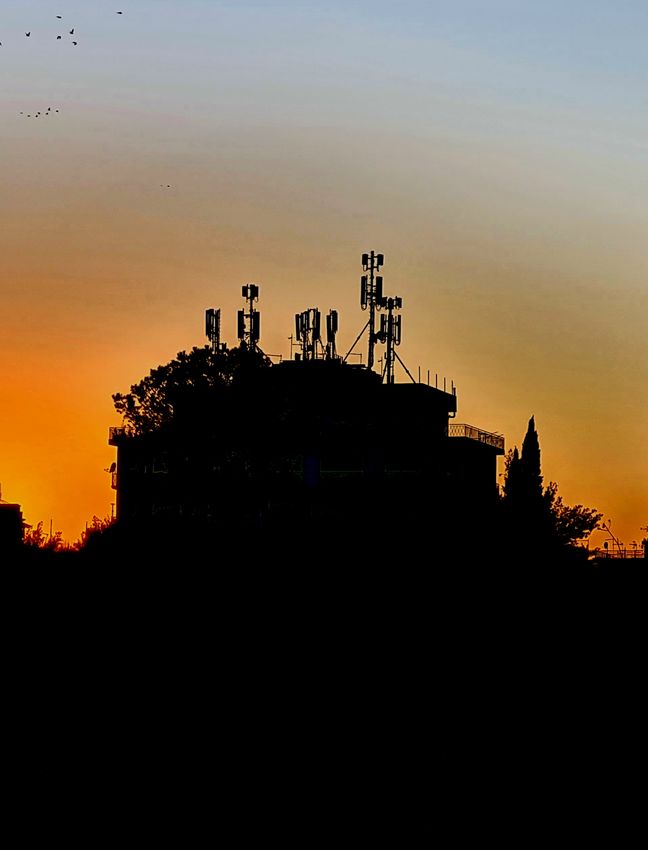
2

                                                                 in Fig. 1. We intentionally leave apart from our
                                                                 analysis the radiation from small cells - a.k.a. micro
                                                                 installations -, whose exposure levels would be
                                                                 additive with respect to the ones radiated by 5G
                                                                 towers and considered in this work. Therefore, a
                                                                 natural question is: Why do we concentrate on 5G
                                                                 towers? To answer this question, we first present a
                                                                 brief overview on how 5G is currently implemented
                                                                 in commercial networks and the role of towers on
                                                                 the 5G deployment. We then analyse the root causes
                                                                 to explain why towers hosting 5G antennas are
                                                                 relevant for the assessment of 5G exposure. Finally,
                                                                 we present the results of our exposure analysis over
                                                                 children, teenagers and sensitive places. The work
                                                                 is complemented by an Appendix providing more
                                                                 technical details - which may be useful e.g., for the
                                                                 experts working in the field.
Fig. 1. Roof-top installation in the city of Rome encompassing
different operators, sectors and antennas (including 5G ones).
                                                                  I. H OW IS 5G IMPLEMENTED IN COMMERCIAL
from outdoor base stations over children, teenagers                               NETWORKS ?
and sensitive areas - due to a different goal (e.g.,                The provisioning of the 5G service requires (ob-
personal devices rather than base stations), and/or              viously) the installation of (new) antennas over
a different focus (i.e., generic exposure assess-                the territory. Each antenna is placed on a physical
ment not tailored to children/teenagers and sensitive            medium, which can be either a stand-alone pole
buildings), and/or a lack of exposure information                for tower installations (roof-top or raw-land), or
about 5G (outdoor) base stations over the considered             alternatively a wall/lighting pole (particularly for
scenarios.                                                       small cell deployments). In many countries in the
   Our work goes one step further with respect to                world - such as Italy for example - the tower
the literature, by shedding light on the exposure                installation is currently the preferred option for
levels radiated by outdoor base stations (including              deploying 5G networks, due to different reasons.
5G ones) over young people and sensitive places.                 First, cellular operators can reuse the existing to-
We tackle this interesting problem by designing and              wers - currently hosting pre-5G equipment - to
evaluating a solid exposure assessment over realistic            install 5G antennas. In this way, the authorization
scenarios and conservative settings. Our work links              steps for the installation of 5G antennas may be
together children and teenager data taken from                   simplified and/or shortened in time. In addition,
national census, real positioning of the buildings               this choice tends to reduce the installation costs
(including the sensitive ones), real positioning of 5G           that are faced by operators compared to the design
(and pre-5G) base stations over the territory, realistic         of a new site from the scratch - since electricity
radio configurations and a conservative computation              and wired connections required by 5G antennas are
of exposure from each base station - including                   already available on the existing site. Moreover,
equipment operating on mm-Wave frequencies. In                   small cells are not pervasively installed over the
addition, we evaluate the exposure trends over the               entire territory - being such option profitable only
coming years, by integrating in our analysis the                 for those locations that provide an adequate return
impact of 5G deployment level (i.e., from an early               on investment. In particular, small base stations are
deployment up to maturity).                                      instrumental to boost network capacity in shopping
   A key point of this article is the focus on the               malls, conference centers, airports, train stations and
exposure levels radiated by 5G towers, i.e., base                stadium - where the mobile traffic is intense due to
stations installed on self poles - a.k.a. “raw-land”             the simultaneous presence of thousands of terminals
- and roof-top installations, like the one shown                 demanding wireless services in a very limited area.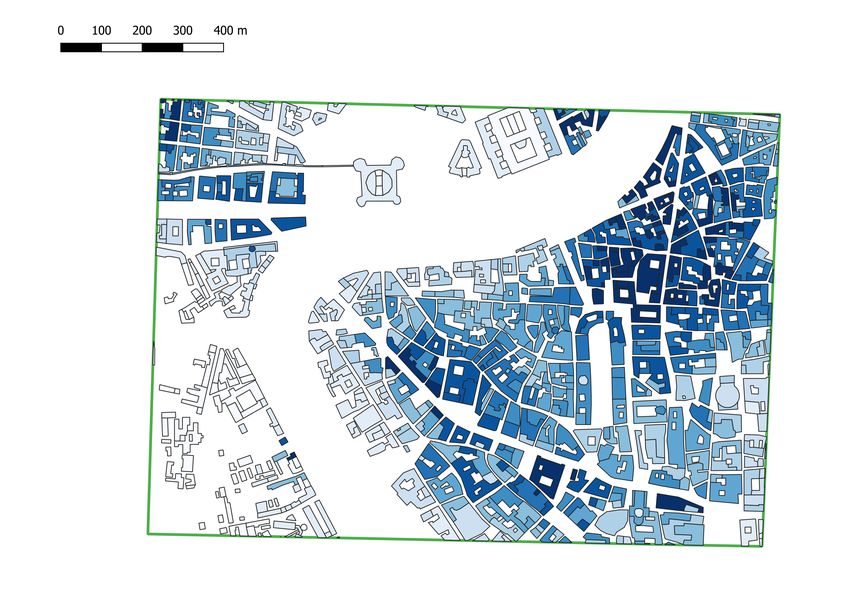
3

On the contrary, the tower installation tends to be      the tower hosts multiple physical operators - each
the most profitable option to serve wide areas in        of them managing a set of antennas on the site.
rural zones and entire portions of neighborhoods         Therefore, the composite power radiated by all
in urban deployments, with the ultimate goal of          antennas of the tower is not negligible, especially
providing ubiquitous wireless coverage over the          in its surroundings - where most of radiation tends
territory.                                               to concentrate.
   Having understood that towers are a fundamental          In this context, the assessment of the EMF ra-
way to realize 5G networks, we provide hereafter         diated by a cellular tower is a fundamental (yet
more technical details about the implementation of       challenging) step. When considering urban zones,
the 5G service in practice. A key driver to speed-up     roof-top or raw-land towers are commonly installed
the 5G network deployment is the exploitation of the     in proximity to residential buildings, as well as
already installed 4G architecture. More concretely,      sensitive ones. Clearly, the tower radiation level
5G is often realized through the Non-StandAlone          over its surroundings strongly depends on multi-
(NSA) configuration option [22], which allows run-       ple aspects, including: i) the characteristics of the
ning 5G network in conjunction (and not in parallel)     antennas installed on the tower (in terms, e.g., of
with 4G. In this way, the 4G network is used to          adopted frequency, maximum radiated power, max-
spread control signals (that are instrumental for        imum gain, radiation diagram, horizontal orienta-
example to select the base station serving a 5G user     tion, mechanical/eletrical tilting), ii) the relative 3D
terminal), as well as to run the inner functionalities   distance of the EMF evaluation point with respect
on the 4G network core. In the long term, 5G will be     to the considered tower and iii) attenuation effects
realized through the StandAlone (SA) option [22] -       introduced e.g., by walls and obstacles between the
taking full control over wireless signals and network    evaluation point and the tower.
core functionalities. To this aim, many countries           The exposure assessment is further complicated
and single operators in the world have announced         when considering 5G antennas operating in the mid-
detailed plans for adopting 5G SA networks [23].         band and mm-Wave frequencies, as such equipment
However, 4G networks will be still in operation even     implement smart antenna management features to
when the majority of connections will be realized        realize the already mentioned massive-MIMO and
through 5G - in order to guarantee legacy services.      beamforming features - generally resulting in diffe-
Therefore, the contribution of 4G antennas on the        rent exposure levels compared to pre-5G equipment
level of exposure can not be neglected - also to         (see e.g., [12]). More in depth, the output power
understand the exposure contribution of 5G with          of a 5G antenna is split among multiple elements
respect to pre-5G sources.                               of the antenna panel, which are used to synthesize
                                                         control and traffic beams over different locations
                                                         of the territory. As a consequence, assuming that
 II. W HY ARE 5G TOWERS RELEVANT FOR THE
                                                         the whole amount of power radiated by the antenna
       ASSESSMENT OF THE EXPOSURE ?
                                                         panel is directed towards a single location of the
   A tower installation typically hosts multiple an-     territory is not realistic in practice, and proper power
tenna panels. State-of-the-art solutions for deploying   scaling factors have to be applied for a meaningful
5G (and pre-5G) services include multiple-band           assessment of the EMF exposure [26].
antenna (see e.g., [24]), supporting sub-GHz 5G             Interestingly, large scaling factors are applied to
frequencies, as well as most of frequencies in use by    mid-band/mm-Wave antennas covering areas dense
pre-5G technologies (4G and even 2G). In addition,       of buildings (e.g., urban zones) compared to ones
dedicated antennas are used to deploy 5G over            serving sparse sets of houses (e.g., rural territory)
higher frequencies, such as mid-band [25] and mm-        [26], [27]. As a consequence, the exposure from a
Wave. The number of radiating sources in each            single tower may be potentially lower in a dense
antenna is not marginal, as 5G panels operating on       area compared to a sparse one. Intuitively, in fact,
mid-band and mm-Wave are composed of multi-              the beams in dense areas are more uniformly dis-
ple radiating elements to realize Massive-multiple-      tributed over the territory compared to sparse zones,
input multiple-output (MIMO) and beamforming             in which instead most of the beams are focused
functionalities. This number is then increased when      on specific locations (e.g., the few locations with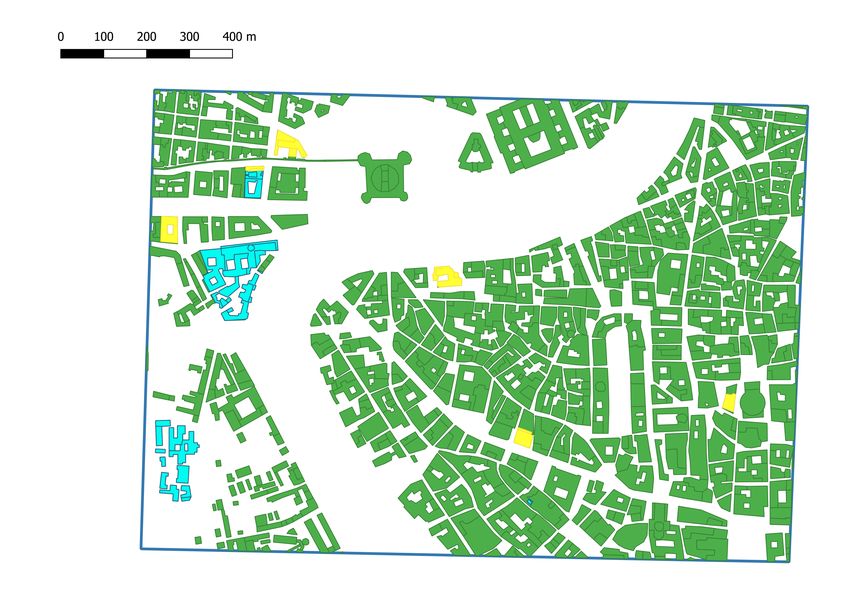
4

                                                                              M      Med. Center

                                                                              S      School Center

                                                                              L1     Raw-Land (1 Operator)

                                                                              L2     Raw-Land (2 Operators)

                                                                              L3     Raw-Land (3 Operators)
                                                                              T1     Roof-Top (1 Operator)

                                                                              T2     Roof-Top (2 Operators)

              (a) Buildings and considered area - Spinaceto.          (b) Positioning of the sensitive places and cellular towers -
                                                                      Spinaceto.

                                                                         M    Med. Center

                                                                         S    School Center
                                                                         T1   Roof-Top (1 Operator)

                                                                         T2   Roof-Top (2 Operators)

                                                                         T2   Roof-Top (3 Operators)

            (c) Buildings and considered area - Ponte-Parione.        (d) Positioning of the sensitive places and cellular towers -
                                                                      Ponte-Parione.

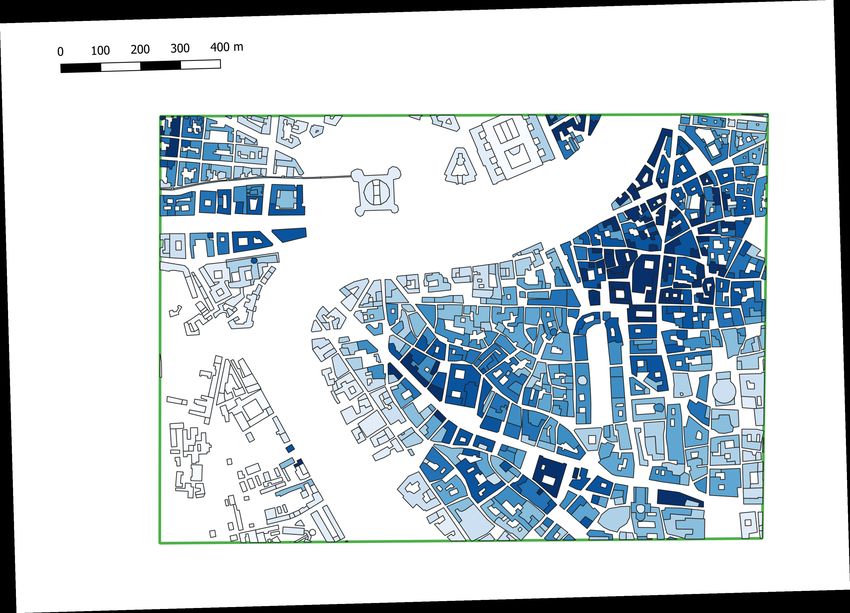
Fig. 2. Towers, buildings and sensitive locations in the considered scenarios (sub-figures best viewed in colors).

buildings), which therefore may receive an higher                       covering the same location [28].
amount of exposure with respect to the dense case.
However, the composite exposure depends also on                          III. W HICH IS THE IMPACT OF 5G TOWERS ON
the tower density, i.e., the number of towers simul-                                 THE EXPOSURE LEVELS ?
taneously covering the same area of territory. In a                       Up to this point, we have understood that ex-
dense area, the tower density is naturally higher                       posure from 5G towers strongly depends on the
compared to a sparse one (mainly due to higher                          considered scenario. In the following, therefore,
capacity requirements), thus potentially increasing                     we present a sound exposure assessment performed
the total exposure that is radiated by multiple towers                  over two representative areas in the city of Rome, by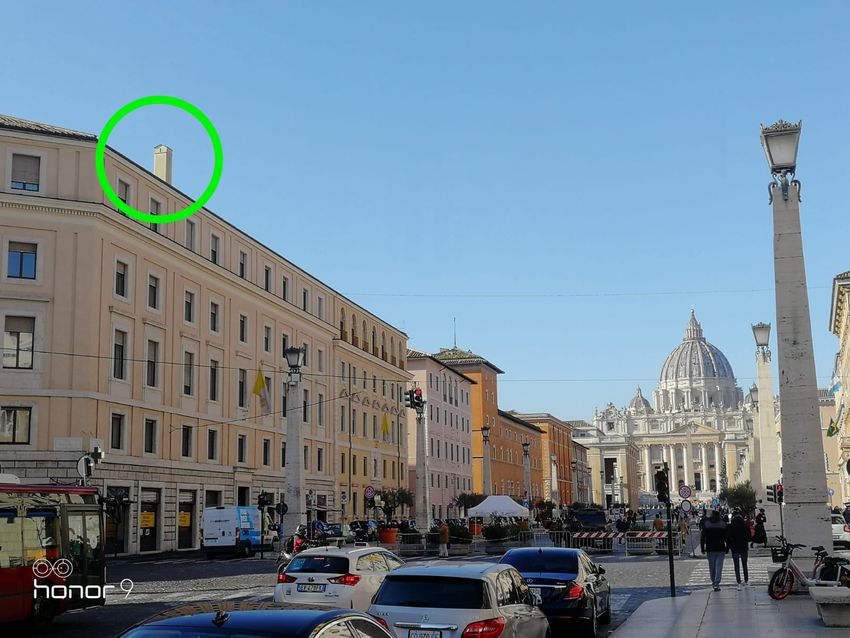
5

                           (a) Roof-top sector with two operators.             (b) Raw-land sector with three operators.

Fig. 3. Antenna panel installations for each operator (example with one sector per operator): roof-top tower (left) vs. raw-land tower (right).

considering a dense neighborhood in the historical-                      both scenarios include sensitive centers (schools and
center (called Ponte-Parione) and a sparse one                           medical centers), which are spread over the consi-
(called Spinaceto). We believe that such scenarios                       dered territory. Third, each school/medical center is
are able to capture multiple aspects that strongly                       normally composed of different buildings (adjacent
affect the exposure levels, including different 5G                       to each other), as shown by yellow and cyan colors
power scaling factors (which depend, e.g., on the                        in Fig.2(a),2(c). Fourth, the towers are rather spread
sparse vs. dense building distribution), as well as                      over Ponte-Parione territory (Fig. 2(d)), while in
different tower densities. The whole description of                      Spinaceto the towers tend to be mainly placed
the input data and the methodology is detailed in                        in proximity to the buildings (Fig. 2(b)). Fifth,
the Appendix, while here we concetrate on the main                       the roof-top installation is the preferred option for
outcomes.                                                                Spinaceto - which however hosts some raw-land
   The real positioning of buildings (including                          towers. On the contrary, Ponte-Parione does not
schools and medical centers) and cellular towers is                      include any raw-land, mainly due to the fact that
reported in Fig. 2. More in depth, we have included                      such tower type generally requires to find ground
in our analysis all the towers that are located inside                   locations without any buildings in the close sur-
the considered area, as well as all the outer ones                       roundings - a hard goal to pursue in Ponte-Parione.
that are installed within 300 m from the area border                     Sixth, many towers are located close to the sensitive
- in order to avoid a potential exposure underesti-                      buildings (Fig. 2(b),2(d)). Seventh, the majority of
mation on the borders. Several considerations hold                       installations in Spinaceto host at least two distinct
by analyzing the subfigures Fig. 2(a)-2(d). First, the                   operators on the same tower, while the option with a
building density in Fig. 2(a),2(c) is clearly higher                     single operator per tower is the most used in Ponte-
in Ponte-Parione compared to Spinaceto: this is                          Parione.
due to the fact that the former mainly includes                             Apart from the number of operators per tower,
historical buildings closely placed to each other,                       we have also collected sector information for each
while the latter is a newer neighborhood, typically                      installation (including the number of sectors and
composed of spatially-distanced buildings - includ-                      the sector orientation). We have then designed two
ing large green areas without any building. Second,                      panel installations for each sector and each type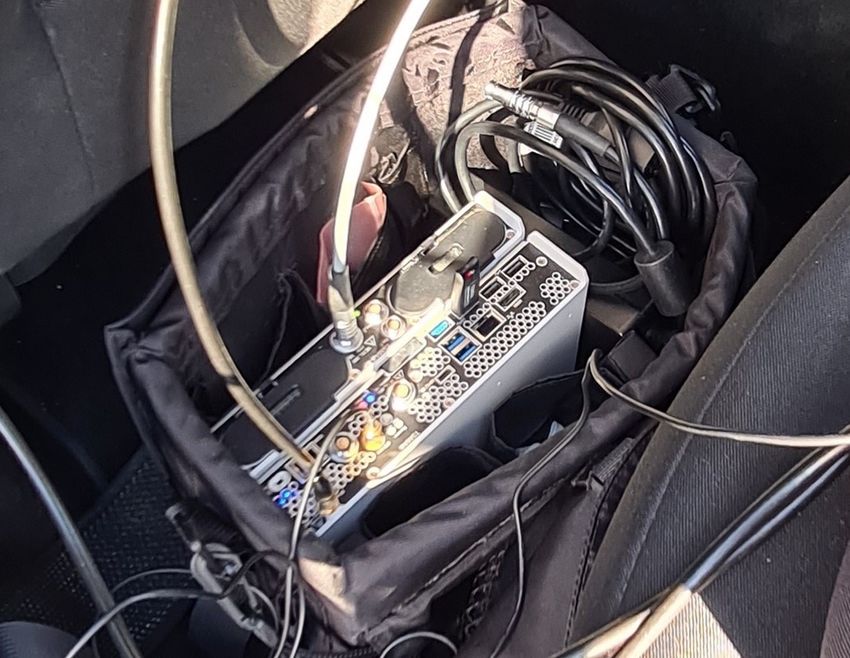
6

                                                                                   10
of tower in the scenario, as shown in Fig. 3 for                                                    All Buildings
a representative example with one sector. More                                            8
                                                                                                    Schools
                                                                                                    Med. Buildings

                                                                 Average EMF V/m
in depth, we have assumed that each sector of
each operator is composed of three distinct antenna                                       6

panels: a quadri-band panel (used for sub-GHz 5G                                          4
and 2G/4G frequencies), a mid-band panel (used for
5G frequencies operating in the 3.6-3.8 GHz range)                                        2

and a mm-Wave panel (used for 5G frequencies in
                                                                                          0
the range 26.5-27.5 GHz). By adopting a uniform

                                                                                                      ly

                                                                                                                            m

                                                                                                                                            ity
                                                                                                       r

                                                                                                                           iu
                                                                                                    Ea

                                                                                                                                         ur
panel design across all operators, we are able to

                                                                                                                      ed

                                                                                                                                         at
                                                                                                                      M

                                                                                                                                     M
make a fair analysis, namely: i) all operators offer                                                                 5G Adoption

similar 5G connectivity options over the scenarios,                                                            (a) Spinaceto
and ii) all frequencies currently allocated to 5G in
                                                                                           10       All Buildings
Italy are used. The features of each panel in terms of                                              Schools
tilting/power/gain/radiation diagram are taken from                                             8   Med. Buildings

                                                                              Average EMF V/m
real equipment and realistic configurations, which
                                                                                                6
in turn depend on the tower type (details in the
Appendix).                                                                                      4
    Eventually, Fig. 3(a) reports (in scale) the posi-
                                                                                                2
tioning of two operators for the roof-top installation,
while Fig. 3(b) highlights the positioning of three                                             0
operators (again in scale) for a raw-land installation.

                                                                                                      rly

                                                                                                                          m

                                                                                                                                      ity
                                                                                                                       iu
                                                                                                    Ea

                                                                                                                                    ur
                                                                                                                      ed

                                                                                                                                    at
In both cases, the antenna panels of different opera-

                                                                                                                     M

                                                                                                                                   M
                                                                                                                 5G Adoption
tors are vertically stacked (rather than horizontally
                                                                                                            (b) Ponte-Parione
stacked). The adoption of a vertical alignment rather
than an horizontal one (in which all panels are           Fig. 4. Average EMF values of the building exposure vs. level of
placed on the pole summit) introduces multiple            5G adoption (sub-figures best viewed in colors).
advantages, namely: i) a conservative evaluation
of exposure, since the panels tend to be placed
at a lower altitude (when multiple operators are          children and teenagers living in that building (based
hosted), and ii) a uniform tower design across all        on census information). In addition, the exposure of
installation sites, as each tower is always composed      schools and medical centers is extracted from the set
of a single pole (while with an horizontal alignment      of buildings.
other supporting poles might be needed - depending           We then move our attention on the analysis of the
on the number of operators hosted by the tower).          obtained results. Fig. 4 reports the average EMF
    We then compute the EMF levels over all the           over the buildings, by differentiating between the
buildings in the considered scenarios, by following       building type and the level of 5G adoption. Intu-
the methodology reported in the Appendix. Un-             itively, the power radiated by mid-band/mm-Wave
less otherwise specified, the EMF assessment is           5G antennas is proportional to the adoption level,
based on a set of conservative (and worst-case)           and therefore the exposure tends to (obviously)
assumptions, which include: i) EMF evaluated on           increase when passing from an early level to the
the building roof level, ii) free-space propagation       maturity one.
conditions, iii) no building attenuation, iv) pre-5G         The figure then further differentiates between
antennas and sub-GHz 5G antennas radiating at the         Spinaceto (Fig. 4(a)) and Ponte-Parione (Fig. 4(b)).
maximum power (corresponding to the maximum               Several considerations hold by comparing Fig. 4(a)-
traffic condition), v) mid-band and mm-Wave 5G            4(b). First, the exposure over schools is rather
power scaling factors depending on the building           similar to the one received by the whole set of
distribution (sparse vs. dense) and the level of 5G       buildings in both scenarios. On the contrary, medical
adoption (i.e., from early deployment to maturity).       buildings receive a lower exposure compared to
The building exposure value is then assigned to the       the other building categories. Second, the expo-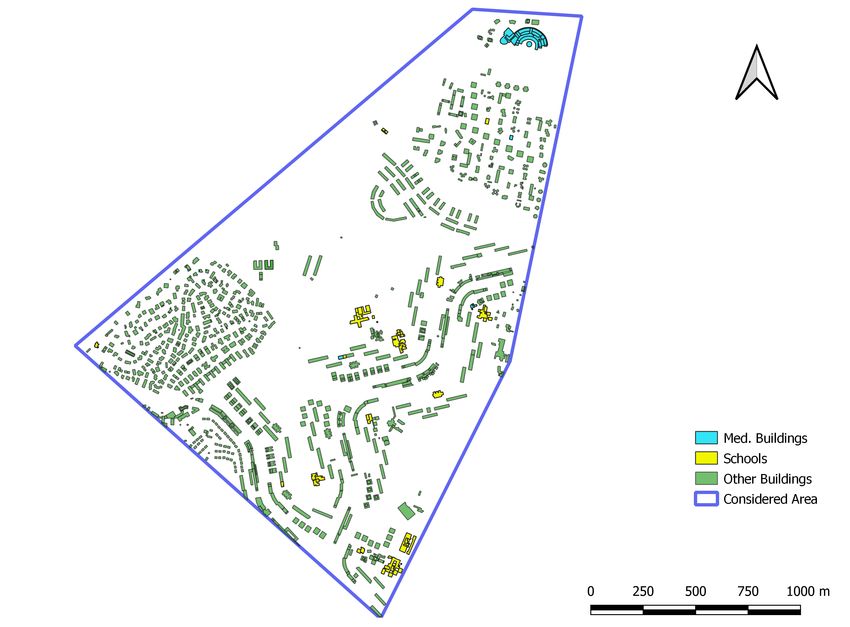
7

                          10                                           the contribution of 5G is lower than the pre-5G
                               Total
                               pre-5G                                  one for the early 5G adoption case. This outcome
        Average EMF V/m   8
                               5G
                                                                       corresponds to the current situation, in which 5G
                          6                                            represents a fraction of the exposure generated by
                          4
                                                                       pre-5G antennas (mainly 4G and 2G) [13]. Then,
                                                                       when passing from early to medium adoption level,
                          2                                            the contribution of 5G exposure tends to increase
                          0
                                                                       - as a consequence of the radiated power growth
                                                                       by mid-band and mm-Wave antennas. At last, the
                                 ly

                                                    m

                                                                 yit
                                  r

                                                   iu

                                                               ur
                               Ea

                                                 ed

                                                                       exposure from 5G becomes higher that the pre-

                                                            at
                                                M

                                                           M
                                            5G Adoption                5G one. This event occurs when a medium adop-
                                         (a) Spinaceto                 tion level is achieved in Spinaceto (Fig. 5(a)) and
                          10
                                                                       only when a maturity level is reached by Ponte-
                                       Total                           Parione (Fig. 5(b)). Intuitively, in fact, the different
                                       pre-5G
                                                                       power scaling factors applied in the two scenarios
        Average EMF V/m

                          8
                                       5G
                          6
                                                                       (resulting from the different spatial distribution of
                                                                       the beams) determine the share of 5G exposure with
                          4                                            respect to the pre-5G one.
                                                                          Up to this point, we have considered the ave-
                          2
                                                                       rage exposure level, without analyzing the exposure
                          0                                            variations of the single samples in each group
                                 rly

                                                    m

                                                                ity

                                                                       (children/teenagers, schools and medical buildings).
                                                    iu
                               Ea

                                                               ur
                                                 ed

                                                           at

                                                                       To shed light on this issue, Fig. 6 reports the EMF
                                                M

                                                           M

                                            5G Adoption
                                                                       exposure vs. the percentage of children/teenagers,
                                       (b) Ponte-Parione
                                                                       school buildings and medical buildings over the two
Fig. 5. Impact of the 5G adoption level on the average exposure        scenarios. Each curve can be analyzed in this way:
over children and teenagers (sub-figures best viewed in colors).       given a percentage value, the corresponding EMF
                                                                       value read on the curve is the maximum exposure
                                                                       that is achieved with that percentage. Clearly, when
sure tends to increase when passing from early to                      the percentage equals 100%, the EMF value read on
maturity levels of 5G adoption - in all scenarios                      the curve is the maximum EMF exposure over all
(as expected). However, the maximum exposure                           the samples. The slope of the curve captures the
increase is typically lower than 2 V/m and 3 V/m for                   EMF exposure variation over the samples: when
Spinaceto and Ponte-Parione, respectively. Fourth,                     the curve is almost vertical, the variation is low;
the buildings in Ponte-Parione receive an higher                       when the curve is more horizontal, the variation
average exposure than the ones in Spinaceto, for all                   is increased. Each curve in the subfigures then
5G adoption levels. This trend may be explained by                     highlights the following EMF metrics: i) pre-5G
the higher tower density in Ponte-Parione compared                     exposure (continuous line), ii) 5G exposure - early
to Spinaceto. Therefore, despite the 5G radiated                       adoption (dashed line), iii) 5G exposure - medium
power per tower is lower in Ponte-Parione than in                      adoption (dashed-dotted line), iv) 5G exposure -
Spinaceto, the composite exposure from all towers                      maturity adoption (dotted line).
is higher in the former compared to the latter.                           Several considerations hold by observing
   In the following step, we focus on the different                    Fig. 6(a)-Fig. 6(f). First of all, the curves capturing
exposure components, by considering the average                        the exposure over children and teenagers are
exposure that is received over children and teenagers                  smoother compared to the ones of schools and
living in the two areas. To this aim, Fig. 5 differen-                 medical buildings. This is due to the fact that
tiates between: i) pre-5G exposure, ii) 5G exposure,                   children and teenagers are rather spread over the
iii) whole exposure (5G + pre-5G). The analysis is                     buildings in the considered scenarios, while on the
then repeated for the different adoption levels of                     contrary schools and medical centers represent a
5G (from early level to maturity one). Interestingly,                  small fraction of the total buildings. As a result,
8
100% 100% 100%
Children and Teenagers %
80% 80%
School Buildings %
80%
Med. Buildings %
60% 60% 60%
40% 40% 40%
pre-5G pre-5G pre-5G
5G (Early) 5G (Early) 5G (Early)
20% 20% 5G (Medium) 20%
5G (Medium) 5G (Medium)
5G (Maturity) 5G (Maturity) 5G (Maturity)
0% 0% 0%
0 5 10 15 0 5 10 15 0 5 10 15
EMF Exposure V/m EMF Exposure V/m EMF Exposure V/m
(a) Children and teenagers - Spinaceto. (b) Schools - Spinaceto (c) Med. Buildings - Spinaceto
100% 100% 100%
Children and Teenagers %
80% 80%
School Buildings %
80%
Med Buildings %
60% 60% 60%
40% 40% 40%
pre-5G pre-5G pre-5G
5G (Early) 5G (Early) 5G (Early)
20% 20% 20%
5G (Medium) 5G (Medium) 5G (Medium)
5G (Maturity) 5G (Maturity) 5G (Maturity)
0% 0% 0%
0 5 10 15 0 5 10 15 0 5 10 15
EMF Exposure V/m EMF Exposure V/m EMF Exposure V/m
(d) Children and teenagers - Ponte- (e) Schools - Ponte-Parione (f) Med. Buildings - Ponte-Parione
Parione.
Fig. 6. Percentage of children and teenagers (left), schools (center) and med. buildings (right) vs. EMF exposure.
the number of samples is larger for the formers 10
and smaller for the latters, and thus resulting in Total
pre-5G
Average EMF V/m
smooth lines. Second, EMF exposure due to 5G 8
5G
(early adoption) is lower than pre-5G one for all 6
percentages of children/teenagers (Fig. 6(a),6(d))
and school buildings (Fig. 6(b),6(e)). In practical 4
words, a child/teenager or a school building always
receives an higher amount of exposure from 2
pre-5G antennas than 5G ones during the early
0
5G adoption level. Third, the evolution of 5G
w
t.
m
At
Lo
iu
adoption towards maturity results in larger EMF
ed
o
N
M
exposure levels by 5G compared to pre-5G ones Attenuation Level
for children/teenagers and sensitive places, in both
scenarios. Fifth, the maximum 5G exposure is Fig. 7. Impact of introducing the building attenuation on the EMF
lower than 15 V/m for children and teenagers, exposure over children and teenagers (Ponte-Parione scenario - 5G
maturity setting).
while always lower than 10 V/m for schools and
medical buildings - well below maximum EMF
exposure limits defined by ICNIRP for the general the impact of including different attenuation levels
public over the considered frequencies [4].1 Sixth, on the EMF assessment over children and teenagers.
the exposure in Ponte-Parione tends to be higher More in depth, we exploit the attenuation model de-
than Spinaceto for almost all the samples when fined in the International Telecommunication Union
considering the medium and maturity 5G adoption (ITU) recommendation P.2109-1 [29] to compute
cases, due again to the higher tower density of the the attenuation values. Clearly, computing the ex-
former with respect to the latter. act attenuation values for each child/teenager is a
In the final part of our analysis, we investigate very challenging task. In particular, the attenuation
1
We have also verified that the composite exposure of 5G and level depends on multiple building features (such
pre-5G adheres to the EMF limits (details in the Appendix). as building materials, walls thickness, windows/-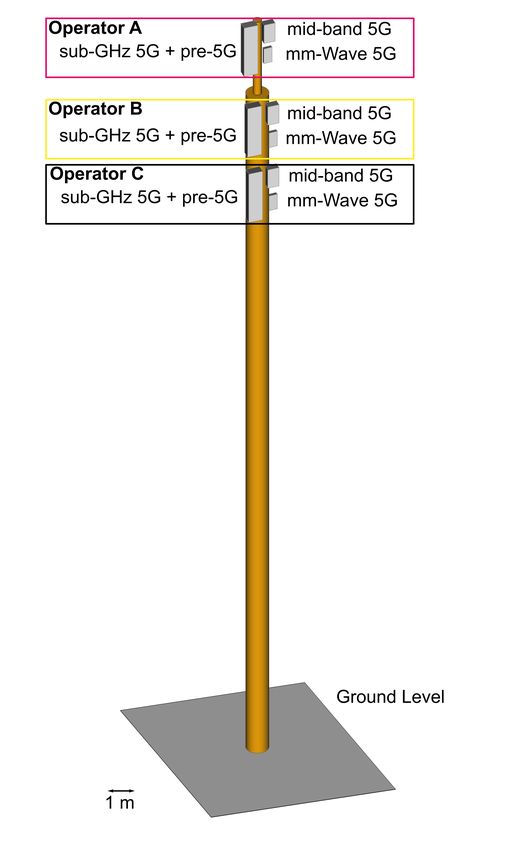
9

doors type and positioning, glass type, etc.), as           As future works, we plan to extend our assess-
well as the positioning of children/teenagers inside     ment to whole municipalities/cities, including zones
the building (e.g., proximity vs. farness with re-       covered by small cells. In addition, as propagation
spect to the windows), which are (obviously) not         has a strong effect over the exposure received by
under our control. Therefore, rather than targeting      children and teenagers, massive campaigns of EMF
the exact computation of the attenuation for each        measurements from 5G towers should be performed,
child/teenager, we consider two representative cases,    especially inside the buildings. Finally, the joint
namely: i) low attenuation level (computed with the      assessment of 5G exposure from both towers and
ITU model by setting 1% of probability) and ii)          other installations - such as intelligent reflecting
medium attenuation level (computed by averaging          surfaces and distributed antenna systems - is another
the attenuation values retrieved from the ITU model      interesting step. This activity will also include the
between 1% and 99% of probability).                      exposure trends analysis of pre-5G sources.
   Fig. 7 shows the EMF exposure over children
and teenagers in Ponte-Parione (with 5G maturity                                  R EFERENCES
setting), by also including the case without attenu-     [1] M. A. Jamshed, F. Heliot, and T. W. Brown, “A survey on
ation for comparison. As expected, the attenuation           electromagnetic risk assessment and evaluation mechanism for
level has a large impact on the received exposure            future wireless communication systems,” IEEE Journal of Elec-
                                                             tromagnetics, RF and Microwaves in Medicine and Biology,
over children and teenagers, resulting in a notable          vol. 4, no. 1, pp. 24–36, 2019.
exposure decrease for the medium setting compared        [2] J.-H. Moon, “Health effects of electromagnetic fields on chil-
to the other cases. In addition, the attenuation             dren,” Clinical and experimental pediatrics, vol. 63, no. 11,
                                                             p. 422, 2020.
strongly affects the relative share of 5G exposure       [3] L. E. Birks, L. van Wel, I. Liorni, L. Pierotti, M. Guxens,
with respect to pre-5G one. Without attenuation,             A. Huss, M. Foerster, M. Capstick, M. Eeftens, H. El Mar-
in fact, 5G exposure is higher than pre-5G one.              roun, M. Estarlich, M. Gallastegi, L. G. Safont, W. Joseph,
                                                             L. Santa-Marina, A. Thielens, M. Torrent, T. Vrijkotte, J. Wiart,
When attenuation is introduced, the share of 5G              M. Röösli, E. Cardis, R. Vermeulen, and M. Vrijheid, “Radiofre-
exposure with respect to pre-5G one is reduced, and          quency electromagnetic fields from mobile communication: De-
eventually the exposure from 5G becomes lower                scription of modeled dose in brain regions and the body in
                                                             European children and adolescents,” Environmental Research,
than the pre-5G one when a medium attenuation                vol. 193, p. 110505, 2021.
is assumed. This effect is expected, as 5G includes      [4] International Commission on Non-Ionizing Radiation Protection
mid-band and and mm-Wave frequencies, which are              (ICNIRP), “ICNIRP guidelines on limiting exposure to time-
                                                             varying electric, magnetic and electromagnetic fields (100 kHz
higher than the ones in use by pre-5G, and are               to 300 GHz).” Avaiable at: https://www.icnirp.org/cms/upload/
therefore subject to larger propagation losses.              publications/ICNIRPrfgdl2020.pdf, Jul. 2020. Last Accessed:
                                                             29th Sept. 2020.
        IV. S UMMARY AND F UTURE W ORK                   [5] J. Bushberg, C. Chou, K. Foster, R. Kavet, D. Maxson, R. Tell,
                                                             and M. Ziskin, “IEEE Committee on Man and Radiation - CO-
   We have assessed the impact of 5G towers on               MAR Technical Information Statement: Health and safety issues
the EMF exposure over children/teenagers, school             concerning exposure of the general public to electromagnetic
                                                             energy from 5G wireless communications networks,” Health
buildings and medical buildings over two realistic           Physics, vol. 119, no. 2, p. 236, 2020.
scenarios. Our results reveal that, although 5G ex-      [6] L. Chiaraviglio, A. Elzanaty, and M.-S. Alouini, “Health Risks
posure radiated by towers is initially lower than            Associated with 5G Exposure: A View from the Communications
the pre-5G one, 5G will become the dominant                  Engineering Perspective,” IEEE Open Journal of the Communi-
                                                             cations Society, vol. 2, pp. 1–45, 2021.
source of exposure from cellular towers when a           [7] K. Karipidis, R. Mate, D. Urban, R. Tinker, and A. Wood, “5G
maturity level will be reached. However, the scaling         mobile networks and health - a state-of-the-science review of
factors applied to the maximum power radiated by             the research into low-level RF fields above 6 GHz,” Journal
                                                             of Exposure Science & Environmental Epidemiology, pp. 1–21,
mid-band/mm-Wave antennas, the tower distribution            2021.
and the positioning of the buildings are important       [8] P. Gajšek, P. Ravazzani, J. Wiart, J. Grellier, T. Samaras, and
aspects heavily influencing the exposure levels over         G. Thuróczy, “Electromagnetic field exposure assessment in
                                                             Europe radiofrequency fields (10 MHz–6 GHz),” Journal of
young people and sensitive places. Eventually, the           exposure science and environmental epidemiology, vol. 25, no. 1,
actual level of exposure over children and teenagers         p. 37, 2015.
is largely impacted by the building attenuation level,   [9] S. Sagar, S. Dongus, A. Schoeni, K. Roser, M. Eeftens,
                                                             B. Struchen, M. Foerster, N. Meier, S. Adem, and M. Röösli,
which has a stronger effect over mid-band and mm-            “Radiofrequency electromagnetic field exposure in everyday
Wave 5G frequecies compared to pre-5G ones.                  microenvironments in Europe: A systematic literature review,”
10

    Journal of Exposure Science and Environmental Epidemiology,               kindergarten children,” Journal of exposure science & environ-
    vol. 28, no. 2, p. 147, 2018.                                             mental epidemiology, vol. 27, no. 5, pp. 497–504, 2017.
[10] Y. Boussad, X. Chen, A. Legout, A. Chaintreau, and W. Dab-           [22] 3GPP TR 21.915 V15.0.0 (2019-09) Release 15 Description.
    bous, Longitudinal Study of Exposure to Radio Frequencies at              Available at https://portal.3gpp.org/desktopmodules/Specificatio
    Population Scale. PhD thesis, Inria & Université Nice Sophia             ns/SpecificationDetails.aspx?specificationId=3389, last accessed
    Antipolis, CNRS, I3S, Sophia Antipolis . . . , 2021.                      on 12th Jan. 2022.
[11] D. Colombi, P. Joshi, B. Xu, F. Ghasemifard, V. Narasaraju,          [23] 5G Standalone 2021 – Summary. Available at https://gsacom.c
    and C. Törnevik, “Analysis of the actual power and EMF expo-             om/paper/5g-standalone-2021-summary/, last accessed on 18th
    sure from base stations in a commercial 5G network,” Applied              September 2020.
    Sciences, vol. 10, no. 15, p. 5280, 2020.                             [24] Commscope 12-port sector antenna RRZZVV-65B-R6H4. Avail-
[12] S. Adda, T. Aureli, S. D’elia, D. Franci, E. Grillo, M. D.               able at https://www.commscope.com/globalassets/digizuite/2
    Migliore, S. Pavoncello, F. Schettino, and R. Suman, “A theo-             63290-p360-rrzzvv-65b-r6h4-comprehensiveexternal.pdf, last
    retical and experimental investigation on the measurement of the          accessed on 4th Jan. 2022.
    electromagnetic field level radiated by 5g base stations,” IEEE       [25] Ericsson Antenna Integrated Radio (AIR) for mid-band 5G.
    Access, vol. 8, pp. 101448–101463, 2020.                                  Available at https://www.ericsson.com/en/newsroom/photo-l
[13] L. Chiaraviglio, C. Lodovisi, D. Franci, S. Pavoncello, T. Au-           ibrary/network-products, last accessed on 4th Jan. 2022.
    reli, N. Blefari-Melazzi, and M.-S. Alouini, “Massive measure-        [26] IEC TR 62669 – Edition 2.0 2019/04 - Case Studies supporting
    ments of 5g exposure in a town: Methodology and results,” IEEE            IEC 62232 – Determination of RF field strength, power density
    Open Journal of the Communications Society, vol. 2, pp. 2029–             and SAR in the vicinity of radiocommunications base stations for
    2048, 2021.                                                               the purpose of evaluating human exposure. Available at https:
[14] S. Aerts, K. Deprez, D. Colombi, M. Van den Bossche, L. Ver-             //webstore.iec.ch/publication/62014, last accessed on 12th Jan.
    loock, L. Martens, C. Tornevik, and W. Joseph, “Assessment                2022.
    of 5G NR base station RF-EMF exposure in a commercial                 [27] B. Thors, A. Furuskär, D. Colombi, and C. Törnevik, “Time-
    network in Switzerland,” in Joint Annual Meeting of the Bio-              Averaged Realistic Maximum Power Levels for the Assessment
    electromagnetics Society and the European BioElectromagnetics             of Radio Frequency Exposure for 5G Radio Base Stations Using
    Association (BioEM 2021), pp. 17–22, 2021.                                Massive MIMO,” IEEE Access, vol. 5, pp. 19711–19719, 2017.
                                                                          [28] L. Chiaraviglio, S. Turco, G. Bianchi, and N. Blefari-Melazzi,
[15] B. Selmaoui, P. Mazet, P.-B. Petit, K. Kim, D. Choi, and
                                                                              “Cellular Network Densification Increases Radio-Frequency Pol-
    R. de Seze, “Exposure of the South Korean population to the
                                                                              lution: True or False?,” IEEE Transactions on Wireless Commu-
    5th generation (5G) of mobile phone networks (3.4 to 3.8 GHz)
                                                                              nications, 2021.
    and its respective contribution among other radio frequencies in
                                                                          [29] ITU-R P.2109-1 Prediction of building entry loss. Available at
    the country,” in 2021 XXXIVth General Assembly and Scientific
                                                                              https://www.itu.int/dms pubrec/itu-r/rec/p/R-REC-P.2109-1-201
    Symposium of the International Union of Radio Science (URSI
                                                                              908-I!!PDF-E.pdf, last accessed on 4th Jan. 2022.
    GASS), pp. 1–4, IEEE, 2021.
[16] M. S. Morelli, S. Gallucci, B. Siervo, and V. Hartwig, “Nu-
    merical Analysis of Electromagnetic Field Exposure from 5G
    Mobile Communications at 28 GHZ in Adults and Children
    Users for Real-World Exposure Scenarios,” International Journal
    of Environmental Research and Public Health, vol. 18, no. 3,
    p. 1073, 2021.
[17] M. Bonato, L. Dossi, E. Chiaramello, S. Fiocchi, S. Gallucci,
    G. Tognola, P. Ravazzani, and M. Parazzini, “Human RF-
    EMF exposure assessment due to access point in incoming 5G
    indoor scenario,” IEEE Journal of Electromagnetics, RF and
    Microwaves in Medicine and Biology, 2020.
[18] L. E. Birks, B. Struchen, M. Eeftens, L. van Wel, A. Huss,
    P. Gajšek, L. Kheifets, M. Gallastegi, A. Dalmau-Bueno, M. Es-
    tarlich, M. F. Fernandez, I. K. Meder, A. Ferrero, A. Jimenez-
    Zabala, M. Torrent, T. G. Vrijkotte, E. Cardis, J. Olsen, B. Valic,
    R. Vermeulen, M. Vrijheid, M. Röösli, and M. Guxens, “Spatial
    and temporal variability of personal environmental exposure to
    radio frequency electromagnetic fields in children in Europe,”
    Environment international, vol. 117, pp. 204–214, 2018.
[19] R. Ramirez-Vazquez, I. Escobar, A. Thielens, and E. Arribas,
    “Measurements and analysis of personal exposure to radiofre-
    quency electromagnetic fields at outdoor and indoor school
    buildings: a case study at a spanish school,” IEEE Access, vol. 8,
    pp. 195692–195702, 2020.
[20] M. Gallastegi, A. Huss, L. Santa-Marina, J. J. Aurrekoetxea,
    M. Guxens, L. E. Birks, J. Ibarluzea, D. Guerra, M. Röösli,
    and A. Jiménez-Zabala, “Children’s exposure assessment of
    radiofrequency fields: Comparison between spot and personal
    measurements,” Environment international, vol. 118, pp. 60–69,
    2018.
[21] C. R. Bhatt, M. Redmayne, B. Billah, M. J. Abramson, and
    G. Benke, “Radiofrequency-electromagnetic field exposures in
11
A PPENDIX A 3000
M ETHODOLOGY AND A DDITIONAL R ESULTS 2500
Children and Teenagers
Number of Inhabitants
We provide hereafter more insights about the 2000
following aspects: i) collection of buildings and
population data, ii) collection of tower data, iii) 1500
exposure assessment procedure, iv) description of
1000
the methodology to generate Fig. 4-7. Finally, the
Appendix is complemented by a set of additional 500
results.
0
7
5-
-6
-7
-
-
-
-
-
-
-
-
-
-
-
A. Buildings and Population Data Population Age [years]
(a) Spinaceto
Obtaining reliable information about buildings
and population in the considered areas is a fun- 2000
damental step for the meaningfulness of the con-
Children and Teenagers
sidered analysis. Focusing on the buildings infor-
Number of Inhabitants
1500
mation (in terms of positioning, volume, floors,
shape), we have exploited the data available from
1000
OpenStreetMap, a freely available database allowing
exportation of the saved data (see e.g., [1]). In
particular, the raw information retrieved from Open- 500
StreetMap has been processed by QGIS software,
in order to filter the subset of buildings falling 0
within each area of interest (i.e., Spinaceto or Ponte-
7
-7
5
-
-
-
-
-
-
-
-
-
-
-
-
Parione). Population Age [years]
Focusing on the sensitive buildings, we have
selected schools and medical buildings based on (b) Ponte-Parione
online information publicly available from the mu- Fig. 8. Breakdown of the population age. The population bins
nicipality. In the following step, we have used belonging to children and teenagers category are highlighted.
QGIS to filter the set of sensitive buildings (as a
ShapeFile) from the entire set of buildings in each
scenario. Fig. 8 reports the number of inhabitants retrieved
Focusing then on population data, we have ex- from the national census over the two scenarios,
ploited the 2011 census done by ISTAT - the Italian for different age bins. Two considerations hold
national statistics institute - and freely available by analyzing the figure. First, the distribution of
from [2], in order to obtain the number of chil- inhabitants over the bins is rather similar over the
dren/teenagers and adults in each building of the two scenarios. Second, the number of inhabitants
scenario. Although such information is not appar- belonging to children and teenagers bins is not
ently up-to-date (as more than 10 years passed from marginal, i.e., always more than 1500 for Spinaceto
the last census), we believe that it is in any case and more than 700 in Ponte-Parione for each bin.
reliable and able to capture the current population However, we point out that the population data
conditions for the areas under investigation, due to collected by ISTAT is referred to census zones, i.e.,
the following reasons: i) national population has not small portions of territory - each of them composed
substantially increased in the last 10 years, ii) both of multiple buildings. On the contrary, our approach
Spinaceto and Ponte-Parione have been pervasively requires as input the population information for
inhabited much earlier than 10 years ago, iii) the each building. To solve this issue, we have initially
urbanization level (in terms of buildings and their loaded the census zones on QGIS software. In the
exploitation) has not substantially changed over the following step, we have assigned each building b
last 10 years in the considered neighborhoods. of the scenario to its corresponding census zone z.12
TABLE I TABLE II
B UILDINGS AND POPULATION COMPARISON OVER THE T OWER C HARACTERIZATION .
CONSIDERED SCENARIOS .
Feature ID Feature Description
Metric Value F1 Type Roof-top or raw-land
Metric Name F2 Positioning GPS coordinates and altitude
Spinaceto Ponte-Parione
Size of the area 3.51 km2 1.62 km2 F3 Operators Number and IDs
Number of buildings 1068 755 Number of sectors, sector orientation
F4 Sectors
Building density 304/km2 466/km2 (per operator)
Number of schools 16 6 Number of panels, panel setup
F5 Radiating sources
Number of school buildings 58 14 (per sector)
Number of medical centers 4 4
Number of medical buildings 30 34
Number of inhabitants 29987 19265
Inhabitants density 8543/km2 11892/km2 in the considered scenarios. As reported in Tab. II,
Number of children and teenagers 6298 3278
Children and teenagers density 1974/km2 2023/km2 the tower characterization includes the following
features: F1) tower type (roof-top or raw-land),
F2) tower positioning, F3) operators hosted in each
Finally, we have computed the number of children/- tower, F4) number of sectors for each operator and
teenagers NbCHD-TN and the number of adults NbAD orientation of each sector, F5) radio configuration
in each building as: for each sector (in terms e.g., of installed panels
NzCHD-TN · Vb and radio configuration of each panel).
NbCHD-TN = (1)
Vz Given the aforementioned huge and detailed
NzAD · Vb amount of information, two natural questions
AD
Nb = (2) emerge: How to collect such information over the
Vz
territory? Is such information able to capture the
where NzCHD-TN (NbAD ) is the number of children/- evolution of the network in the coming years? To
teenagers (adults) of census zone z, Vb is the volume tackle both questions in a comprehensive and mean-
of building b, and Vz is the volume of all buildings ingful way, in this work we have adopted a hybrid
falling within census zone z. The output of this step approach, in which F1)-F4) are sensed from the real
is then a building map (as a ShapeFile), enriched deployments realized in the considered scenarios,
with the population information. while F5) is derived from reasonable assumptions
Finally, Tab. I summarizes the main building about pre-5G and 5G deployments and realistic ra-
and population information collected in the two dio configurations for each installed antenna panel.
scenarios. More in depth, the area in Spinaceto is However, the skeptic of our work may object that
larger than Ponte-Parione, being also characterized we are not directly sensing F5) from the actual
by an higher number of buildings. However, the deployment over the territory, and hence our results
building density in Spinaceto is lower than the are not meaningful. Before going into the details
one in Ponte-Parione. Focusing then on the sensi- of the collected input data, let us first analyze such
tive buildings, Spinaceto hosts a larger number of concern and better motivate the meaningfulness of
schools compared to Ponte-Parione. However, the our hybrid approach.
number of medical centers is comparable over the 1) Hybrid Approach: Motivation: Since we are
two scenarios. Clearly, each school and medical cen- currently in the early days of 5G deployment, not all
ter is composed of multiple buildings. Eventually, the towers in the scenario host 5G equipment - many
the number of children/teenagers and inhabitants of them provide only pre-5G connectivity. However,
is higher in Spinaceto compared to Ponte-Parione. it is expected that 5G technology will become
However, the opposite holds when considering the predominant in the next (few) years, meaning that
population density. Finally, the total number of the panels installed on the towers will be progres-
children and teenagers is rather large, i.e., several sively updated/replaced to dismiss legacy equipment
thousands in each scenario. (e.g., 3G antennas [3]) in favor of 5G radiating
elements. This picture is further complicated in the
B. Tower Data Italian country, as the presently enforced exposure
The second step required as input to our analysis limits are more stringent that the ones proposed
is the collection of data to characterize the towers by international organizations (such as ICNIRP [4])13
and promoted by the European Commission. Ac-
cording to previous works (see e.g., [5], [6]), strict
exposure regulations negatively impact co-location
of antennas on the same tower (and even installation
of new towers on the same building), thus (possibly)
introducing strong barriers on the deployment of
5G networks. In countries adopting stricter-than-
ICNIRP regulations, in fact, urban sites tend to be (a) Placement of the network (b) Tower view during war-
scanner in the car driving
almost saturated in terms of available EMF space
- and therefore it is not possible to install new
radiating sources (without violating the exposure
limits). As a result, more towers have to be installed
over the territory compared to countries adopting
ICNIRP regulations [5]. This picture has changed in
some European countries, like Poland and Lithunia, (c) Raw sector orientation re- (d) Aerial view of the towers
which have updated their national regulations from trieved by the network scanner identified by the network scanner
stricter-than-ICNIRP to ICNIRP-based regulations. (map source: Google Maps) (image source: Google Maps)
In this context, the application of ICNIRP or Fig. 9. War-driving step performed with the network scanner.
stricter-than-ICNIRP regulations influences the in-
put data required by our work, as intuitively, the levant data from the documents sent by operators to
set of radiating elements, and their radiated power, ARPA Lazio in order to get authorization approval
strongly depends on the adopted regulation. In this for the tower.2 The collected information includes
work, we have chosen to derive a deployment that tower type (roof-top vs. raw-land), GPS positioning
satisfies the limits for general public defined by of the tower, installed operators, number of sectors
ICNIRP [4], due to the following reasons. First, and sectors orientation for each tower. In the follow-
we are able to generalize our results to the (many) ing step, we perform a cross-check of the obtained
countries adopting the ICNIRP regulations. Second, data through a war-driving based approach. A tower
we consider a conservative setting, in which the check over the territory is in fact mandatory, due to
exposure is (likely) higher that the one currently ex- the following reasons: i) the information reported in
perienced over the territory - resulting from stricter- the tower authorization documents may be outdated
than-ICNIRP regulations. (as subsequent tower updates performed after the
Obviously, an exposure regulation has an impact initial authorization may not generate new autho-
also on the planning on the network, in terms e.g., of rization requests - this include e.g., tower disposal),
tower positioning, sector orientation, radiated power ii) authorization documents are not available for all
setting, etc. In our case, we solve this issue by the towers (e.g., some towers in Ponte-Parione are
adopting a hybrid approach, in which we retrieve placed on buildings belonging to the Vatican state -
the actual tower positioning and sector orientation, and those authorization requests are not processed
while we define configurations of the radiating by ARPA Lazio).
sources that satisfy ICNIRP regulations. We believe More concretely, the tower check is done in
that this approach is representative of a worst- the following way. We install a Rohde&Schwarz
case scenario (in terms of exposure), due to the TSMA6 network scanner on a car, as shown
following reasons: i) higher tower density resulting Fig. 9(a). The network scanner is then connected to
from the stricter-than-ICNIRP planning compared to a PCTEL P286H external omnidirectional antenna
the ICNIRP one [5], ii) radiated power from each (mounted on the roof on the car). In addition, elec-
source satisfying ICNIRP limits (thus higher than tricity to the network scanner is provided through a
the stricter-than-ICNIRP case). plug on the car. The scanner is then complemented
2) Collection of tower information: We then by a tablet, wirelessy connected to the scanner, and
provide more details about how the information F1)-
F4) has been sensed from Spinaceto and Ponte- 2
No sensitive information reported in the authorization documents
Parione. More in depth, we initially extract the re- is disclosed in our work.14
TABLE III
R ADIO CONFIGURATION FOR A SINGLE SECTOR s1 OF ROOF - TOP TYPE .
Antenna ID a 1 2 3 4 5 6 7 8
Frequency Band Fa 700 MHz 800 MHz 900 MHz 1800 MHz 2100 MHz 2600 MHz 3700 MHz 26000 MHz
Technology 5G 4G 2G 4G 4G 4G 5G 5G
Antenna Panel p QuadriBand 5G-midBand 5G-mmWave
Mechanical Tilt σ(s1 ,p) 0° 2°
Electrical Tilt t 2° 4° 2° 4° 2° 0°
Output Power P(s MAX 40 W 60 W 80 W 5W
1 ,a)
Maximum Gain GMAX
(s ,a)
13.8 dBi 14.4 dBi 14.9 dBi 16.4 dBi 17.5 dBi 17.7 dBi 23.9 dBi 33.5 dBi
2
Horiz. Diagram H
D(s MSI file MSI file MSI file MSI file MSI file MSI file MSI file MSI file
1 ,a) (Fa1 , t1 ) (Fa2 , t2 ) (Fa3 , t3 ) (Fa4 , t4 ) (Fa5 , t5 ) (Fa6 , t6 ) (Fa7 , t7 ) (Fa8 , t8 )
V
Vert. Diagram D(s MSI file MSI file MSI file MSI file MSI file MSI file MSI file MSI file
1 ,a) (Fa1 , t1 ) (Fa2 , t2 ) (Fa3 , t3 ) (Fa4 , t4 ) (Fa5 , t5 ) (Fa6 , t6 ) (Fa7 , t7 ) (Fa8 , t8 )
Reduction Factor Rp 1 α5G
p
TABLE IV
R ADIO CONFIGURATION FOR A SINGLE SECTOR s2 OF RAW- LAND TYPE .
Antenna ID a 1 2 3 4 5 6 7 8
Frequency Band Fa 700 MHz 800 MHz 900 MHz 1800 MHz 2100 MHz 2600 MHz 3700 MHz 26000 MHz
Technology 5G 4G 2G 4G 4G 4G 5G 5G
Antenna Panel p QuadriBand 5G-midBand 5G-mmWave
Mechanical Tilt σ(s2 ,p) 0° 2°
Electrical Tilt 4° 6° 4° 6° 2° 0°
Output Power P(s MAX 60 W 80 W 100 W 5W
2,a)
Maximum Gain GMAX
(s ,a)
13.8 dBi 14.4 dBi 14.9 dBi 16.4 dBi 17.5 dBi 17.7 dBi 23.9 dBi 33.5 dBi
2
H
Horiz. Diagram D(s MSI file MSI file MSI file MSI file MSI file MSI file MSI file MSI file
2 ,a) (Fa1 , t1 ) (Fa2 , t2 ) (Fa3 , t3 ) (Fa4 , t4 ) (Fa5 , t5 ) (Fa6 , t6 ) (Fa7 , t7 ) (Fa8 , t8 )
Vert. Diagram V
D(s MSI file MSI file MSI file MSI file MSI file MSI file MSI file MSI file
2 ,a) (Fa1 , t1 ) (Fa2 , t2 ) (Fa3 , t3 ) (Fa4 , t4 ) (Fa5 , t5 ) (Fa6 , t6 ) (Fa7 , t7 ) (Fa8 , t8 )
Reduction Factor Rp 1 α5G
p
TABLE V Eventually, Fig. 9(d) reports the towers that were
S TATISTICAL REDUCTION FACTORS FOR THE DIFFERENT LEVELS
completely characterized through the war-driving
OF 5G ADOPTION .
approach (i.e., those ones with missing authorization
5G Adoption Level α5G
p values data). For all the other towers (i.e., the ones with
Name Index l Ponte-Parione Spinaceto
Early 1 0.03 0.05
available authorization), the war-driving approach
Medium 2 0.13 0.21 allowed identifying the active ones and discarding
Maturity 3 0.18 0.31
the disposed ones. In addition, sector information
was compared against the one reported in the au-
thorization documents, finding in general a good
running the Rohde&Schwarz ROMES4 commercial
matching between both sources.
software for data acquisition and analysis. We then
extensively cover the streets in the considered sce- 3) Radio Configuration: The last phase of the
narios, focusing in particular on the zones where we tower characterization is the configuration of the
identified the towers (Fig. 9(b)). Based on the tri- radiating sources for each sector. This step includes
angularization of the acquired signals, the software the setting of several parameters, ranging from the
is able to position the identified towers on a map, selection of the adopted panels to the configuration
showing also the sector orientation (Fig. 9(c)). This of the radio features for each panel. Without loss of
last information is instrumental for towers without generality, in this work we adopt an uniform radio
available authorization data, particularly those ones configuration for all the sectors and all the operators,
for which sector orientation is hidden to sight (like as shown in Tab. III and Tab. IV for the roof-top
the fake chimney in Fig. 9(b)). Clearly, the raw and raw-land cases. More in depth, we adopt real
information presented by the software (Fig. 9(c)) parameters and realistic settings, by assuming the
has to be manually filtered, in order to remove deployment of three distinct antenna panels for each
duplicates and/or not precise tower positioning. sector (and each operator), namely: a quadri-band15
TABLE VI
E XAMPLE OF A TOWER HOSTING TWO OPERATORS AND THREE SECTORS PER OPERATOR .
Electrical center height of panel p (above sea level)
Operator Number of sectors Sectors Orientation ρCLOCK
s Quadriband 5G-MidBand 5G-mmWave
A 3 {80°, 200°, 280°} 78.3 m 78.8 m 77.4 m
B 3 {70°, 220°, 330°} 76 m 76.5 m 75.1 m
TABLE VII diagram depends on the following features: i) the
T OWER METRICS OVER THE CONSIDERED SCENARIOS . panel model (highlighted with different colors in
Metric Value the tables), ii) the operating frequency, and iii)
Metric Name
Ponte-Parione Spinaceto the electrical tilting value. Finally, the last row
Number of operators 4
Number of towers 45 13 of Tab. III-IV reports the reduction factor that is
Number of roof-top towers 45 10 applied to the maximum power. In this work, we
Number of raw-land towers 0 3
Number of pre-5G sources 934 354 assume that the quadri-band panel always radiates
Number of 5G sources 560 212
at the maximum power (corresponding to the values
of output power reported in the tables). On the other
hand, the output power of mid-band and mm-Wave
antenna panel, a mid-band panel and mm-Wave one. panels p is scaled by the factor αp5G , which is set
The positioning (in scale) of the aforementioned in accordance to the realistic values provided by
panels in roof-top and raw-land cases is shown in relevant standards [7].
Fig. 3. More in depth, αp5G captures the statistical reduc-
Clearly, the main application for mm-Wave pa- tion factors that are introduced by the smart antenna
nels is to boost capacity (especially in small cell management features of 5G over mid-band and mm-
deployments). However, we believe that including a Wave. More concretely, Tab. V reports the reduction
mm-Wave panel on a tower is meaningful in our factors over the two scenarios and the different level
scenario, due to the following reasons: i) autho- of 5G adoptions. The numerical values are taken
rization requests to install mm-Wave antennas over from [7], by assuming that Spinaceto is represen-
towers have been already received (thus demonstra- tative for a sparse area while Ponte-Parione for a
ting that the operators are keen to invest on towers dense one. In addition, the early/medium/maturity
for the installation of mm-Wave panels), ii) towers levels of 5G adoption correspond to 5%/50%/95%
are normally located close to densely populated utilization level of [7], respectively. By observing
areas, including main streets - where 5G over mm- the values in Tab. V, two considerations emerge.
Wave may be instrumental to provide high-level and First, strong reduction factors are applied even in
innovative services. the maturity case. Second, the reduction factors are
We then provide more details about the para- lower (i.e., stronger) in Spinaceto than in Ponte-
meters reported in Tab. III-Tab. IV. Naturally, the Parione, due to the lower and less uniform building
quadri-band panel includes sub-GHz band of 5G, density that characterizes the former with respect to
as well as the bands for 2G and 4G. In addition, the latter.
the values for the mechanical/electrical tilting and For the sake of clarity, Tab. VI reports the sector
the output power are taken from typical settings information for a roof-top tower in Spinaceto. In this
adopted by operators. Eventually, the output power case, the tower hosts two operators, each of them
of the mm-Wave panel is set to the maximum one managing three sectors. For each sector, the radio
allowed by the equipment under consideration. The configuration in Tab. III is implemented. Tab. VI
antenna gains reported in the tables are retrieved details also the altitude of the electrical center for
from the datasheets of the panels. Moreover, the teach panel type. The altitude of the each panel is
radiation diagrams for each source are taken from retrieved in this way: i) the roof-altitude is retrieved
the real ones made available by the antenna vendors. from OpenStreetMap database, ii) based on the
Such information is included in files with MSI number of operators and number of sectors, a roof-
format (i.e., a list of gain values for each angle top installation is defined (based on e.g., Fig. 3), iii)
in horizontal and vertical planes). Each radiation the altitude in i) is summed to the height of the eachYou can also read


