Wells Fargo 2018 Healthcare Conference-Boston - September 6, 2018 - Centene Corporation
←
→
Page content transcription
If your browser does not render page correctly, please read the page content below
Wells Fargo 2018
Healthcare Conference

     -- Boston --

                    September 6, 2018
Forward-Looking Statements
The company and its representatives may from time to time make written and oral forward-looking statements within the meaning of the Private Securities Litigation Reform Act
("PSLRA") of 1995, including statements in this and other presentations, press releases, filings with the Securities and Exchange Commission ("SEC"), reports to stockholders and in
meetings with investors and analysts. In particular, the information provided in this presentation may contain certain forward-looking statements with respect to the financial
condition, results of operations and business of Centene and certain plans and objectives of Centene with respect thereto, including but not limited to the expected benefits of the
acquisition of Health Net, Inc. (Health Net) (Health Net Acquisition) and the acquisition of New York State Catholic Health Plan, Inc., d/b/a Fidelis Care New York (Fidelis Care) (Fidelis
Care Acquisition). These forward-looking statements can be identified by the fact that they do not relate only to historical or current facts. Without limiting the foregoing, forward-
looking statements often use words such as "believe", "anticipate", "plan", "expect", "estimate", "intend", "seek", "target", "goal", "may", "will", "would", "could", "should", "can",
"continue" and other similar words and expressions (and the negative thereof). We intend such forward-looking statements to be covered by the safe-harbor provisions for forward-
looking statements contained in PSLRA. A number of factors, variables or events could cause actual plans and results to differ materially from those expressed or implied in forward-
looking statements. Such factors include, but are not limited to, Centene's ability to accurately predict and effectively manage health benefits and other operating expenses and
reserves; competition; membership and revenue declines or unexpected trends; changes in healthcare practices, new technologies and advances in medicine; increased healthcare
costs; changes in economic, political or market conditions; changes in federal or state laws or regulations, including changes with respect to income tax reform or government
healthcare programs as well as changes with respect to the Patient Protection and Affordable Care Act and the Health Care and Education Affordability Reconciliation Act and any
regulations enacted thereunder that may result from changing political conditions; rate cuts or other payment reductions or delays by governmental payors and other risks and
uncertainties affecting Centene's government businesses; Centene's ability to adequately price products on federally facilitated and state-based Health Insurance Marketplaces; tax
matters; disasters or major epidemics; the outcome of legal and regulatory proceedings; changes in expected contract start dates; provider, state, federal and other contract changes
and timing of regulatory approval of contracts; the expiration, suspension or termination of Centene's contracts with federal or state governments (including but not limited to
Medicaid, Medicare, TRICARE or other customers); the difficulty of predicting the timing or outcome of pending or future litigation or government investigations; challenges to
Centene's contract awards; cyber-attacks or other privacy or data security incidents; the possibility that the expected synergies and value creation from acquired businesses, including,
without limitation, the Health Net Acquisition and the Fidelis Care Acquisition, will not be realized, or will not be realized within the expected time period; the exertion of management's
time and Centene's resources, and other expenses incurred and business changes required in connection with complying with the undertakings in connection with any regulatory,
governmental or third party consents or approvals for the Health Net Acquisition or the Fidelis Care Acquisition; disruption caused by significant completed and pending acquisitions,
including the Health Net Acquisition and the Fidelis Care Acquisition, making it more difficult to maintain business and operational relationships; the risk that unexpected costs will be
incurred in connection with the completion and/or integration of acquisition transactions, including among others, the Health Net Acquisition and the Fidelis Care Acquisition; changes
in expected closing dates, estimated purchase price and accretion for acquisitions; the risk that acquired businesses, including Health Net and Fidelis Care, will not be integrated
successfully; the risk that, following the Fidelis Care Acquisition, Centene may not be able to effectively manage its expanded operations; restrictions and limitations in connection with
Centene's indebtedness; Centene's ability to achieve improvement in the Centers for Medicare and Medicaid Services (CMS) Star ratings and maintain or achieve improvement in other
quality scores in each case that can impact revenue and future growth; availability of debt and equity financing, on terms that are favorable to Centene; inflation; foreign currency
fluctuations; and risks and uncertainties discussed in the reports that Centene has filed with the SEC. These forward-looking statements reflect Centene's current views with respect to
future events and are based on numerous assumptions and assessments made by Centene in light of its experience and perception of historical trends, current conditions, business
strategies, operating environments, future developments and other factors it believes appropriate. By their nature, forward-looking statements involve known and unknown risks and
uncertainties and are subject to change because they relate to events and depend on circumstances that will occur in the future. The factors described in the context of such forward-
looking statements in this presentation could cause Centene's plans with respect to the Health Net Acquisition, the Fidelis Care Acquisition, actual results, performance or
achievements, industry results and developments to differ materially from those expressed in or implied by such forward-looking statements. Although it is currently believed that the
expectations reflected in such forward-looking statements are reasonable, no assurance can be given that such expectations will prove to have been correct and persons reading this
presentation are therefore cautioned not to place undue reliance on these forward-looking statements which speak only as of the date of this presentation. Centene does not assume
any obligation to update the information contained in this presentation (whether as a result of new information, future events or otherwise), except as required by applicable law. This
list of important factors is not intended to be exhaustive. We discuss certain of these matters more fully, as well as certain other risk factors that may affect Centene's business
operations, financial condition and results of operations, in Centene's filings with the SEC, including the annual report on Form 10-K, quarterly reports on Form 10-Q and current reports
on Form 8-K.
                                                                                                                                                                                     2
Earnings Guidance Policy

  Our Company’s policy is, “that the Company undertakes no obligation to update its earnings
  guidance, other than as part of its quarterly or yearly earnings disclosure, and that silence on
  guidance by the Company or Company officials should not be interpreted that guidance has or
  has not changed. In any event, no updated guidance would ever be given that is not previously
  or simultaneously disclosed in an SEC filing or other broad non-exclusionary means.”

  “Further, it is Company policy to generally not hold discussions with investors commencing two
  weeks prior to earnings release.”

  This presentation also includes non-GAAP financial measures. You can find Centene's
  presentations on the most directly comparable GAAP financial measures calculated in accordance
  with GAAP and reconciliations in Appendix A. Centene is providing certain non-GAAP financial
  measures in this presentation as Centene believes that these figures are helpful in allowing
  investors to more accurately assess the ongoing nature of Centene's operations and measure
  Centene's performance more consistently across periods. Centene uses the presented non-GAAP
  financial measures internally to allow management to focus on period-to-period changes in
  Centene's core business operations. Therefore, Centene believes that this information is
  meaningful in addition to the information contained in the GAAP presentation of financial
  information. The presentation of this additional non-GAAP financial information is not intended
  to be considered in isolation or as a substitute for the financial information prepared and
  presented in accordance with GAAP.
                                                                                                3
Who We Are

                     WHO WE ARE                                                    WHAT WE DO

                        St. Louis                                                           31 states
                        based company founded in                                              with government sponsored
                        Milwaukee in 1984                                                      healthcare programs and
                                                                                                    implementations

     41,200 employees                                             Medicaid      Marketplace      Medicare       Correctional

     #61                    #210                  #27
      on the
                            on the
                                             Fortune’s Fastest               2 international markets
                         Fortune             Growing Companies
 Fortune 500 list
                      Global 500 list              (2017)

                                                                 12.8 million members
                                                                             includes 2.9 million TRICARE eligible
$15.0 billion $59.2-60.0B
                                                                                           Product / Market
  in cash and investments            expected revenue for 2018        ~330                    Solutions
                                                                                                                               4
Source: Fortune
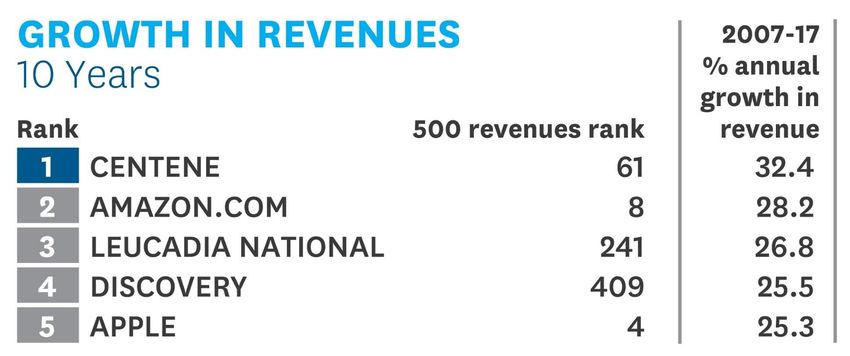
52017 Performance
Revenues Total Revenues of $48.4 billion + 19%
HBR Health Benefits Ratio of 87.3% + 80 bps
Diluted EPS Diluted EPS of $4.69 + 38%
Adjusted Diluted
Adjusted Diluted EPS of $5.03 + 14%
EPS1
Membership Added 765K members between years + 7%
1 Represents a non-GAAP measure. See Appendix A for reconciliation of non-GAAP measures.
6Q2 2018 Performance
Revenues Total Revenues of $14.2 billion + 19%
HBR Health Benefits Ratio of 85.7% (60) bps
Diluted EPS Diluted EPS of $1.50 +4%
Adjusted Diluted
Adjusted Diluted EPS of $1.80 +13%
EPS1
Membership Added 585K members between years + 5%
1 Represents a non-GAAP measure. See Appendix A for reconciliation of non-GAAP measures.
72018 Guidance
Low High
Total revenues (in billions) $59.2 $60.0
GAAP diluted EPS $4.25 $4.57
Adjusted Diluted EPS1 $6.80 $7.16
HBR% 85.9% 86.4%
Selling, general & administrative (SG&A) expense ratio 10.2% 10.7%
Adjusted SG&A expense ratio2 9.4% 9.9%
Effective tax rate 34.0% 36.0%
Diluted shares (in millions) 198.7 199.7
1 Represents a non-GAAP measure. See Appendix A for reconciliation of non-GAAP measures.
2 Represents a non-GAAP measure. Adjusted SG&A% excludes acquisition related expenses of $422 million to $428 million.
85 Year Compound Annual Growth Rates
2013-2018(F), excluding stock price
$ 41%
Total Revenues1
Delivering Shareholder
Value
EPS 37% CNC 38%
Adj. Diluted EPS2 Stock Price3
1 Based upon 2018 guidance midpoint.
2 Represents a non-GAAP measure using the guidance midpoint. See Appendix A for reconciliation of non-GAAP measures. The 5 year GAAP diluted
EPS CAGR is 25% using the guidance midpoint.
9
3 5 year stock price CAGR as of August 27, 2018.2013 vs. 2018
($ IN BILLIONS)
$59.2 -
$60.0
2.4% -
2.6%
1.6%
$10.9
2013 2018 Guidance 2013 2018 Guidance
REVENUE ADJ. NET INCOME MARGIN*
* Excludes estimated merger costs and amortization of acquired intangible assets. 2018 also excludes California minimum MLR changes;
See Appendix A for reconciliation of non-GAAP measures. 10Adjusted Diluted Earnings Per Share*
(FROM CONTINUING OPERATIONS)
Guidance Range
$6.80 – $7.16
CNC 5 Year CAGR
+37%**
$5.03
$4.43
$3.14
$2.31
2014 2015 2016 2017 2018 (F)
*Represents non-GAAP measure. See Appendix A for reconciliation of non-GAAP measures.
**Based on 2018 guidance range mid-point.
11Stock Price CAGR vs. Peers
5 YEAR CAGR, AUGUST 2013-2018
38%
29%
12%
S&P 500 Peer CNC
Composite Group1
Note: CAGR from August 27, 2013 – August 27, 2018. Source: Yahoo!Finance
1 Peer group includes Aetna, Anthem, Cigna, Humana, Molina, United and WellCare.
12Total Revenue Growth
($ IN MILLIONS)
Guidance Range
$59,200 - $60,000
$48,382
41% 5 Year CAGR* $40,607
$22,760
$16,560
$10,863
$8,110
$4,103 $4,448 $5,211
2009 2010 2011 2012 2013 2014 2015 2016 2017 2018(F)
% Increase 22% 8% 17% 56% 34% 52% 37% 78% 19% 23%*
over PY
* Based on 2018 guidance range mid-point. 13Diversifying Revenues
2015: $22.8 Billion 2018(F): $59.6 Billion1
2%
20%
4%
9%
10%
84% 65%
6%
Medicaid Commercial Medicare Other
1 Midpoint of guidance range. 14Funds Flow
Structured to Facilitate Free Cash Flow
Unregulated Net Cash Flow
Available to Service Debt Centene
States’
Corporation Actuarially Sound
Premiums
Unregulated Entities
Centene
Envolve Benefit Envolve Envolve Pharmacy
Options PeopleCare Solutions
Management Regulated Health Plans
Company
• Market-based, state-approved contractual relationship
• Generates sufficient cash flows to cover fixed charges
15Centene: 2008
HEALTHCARE COVERAGE SOLUTIONS
Government Solutions AZ FL GA IN OH SC TX WI
Low-Income Medicaid ● ● ● ● ● ● ● ●
CHIP ● ● ● ● ● ● ●
ABD (non duals) ● ● ● ● ● ●
ABD (dual-eligible) or Dual Demonstrations ● ● ● ● ● 8
Long-Term Services and Supports ● ● States
Foster Care ●
Medicare Special Needs Plan ● ● ● ●
70
Specialty Health Solutions
Solutions
Pharmacy Benefits ● ● ● ● ● ●
Behavioral & Specialty Therapies ● ● ● ● ● ● ● ●
Life & Health Management ● ● ● ● ● ● ● ●
Managed Vision ● ● ● ● ● ● ● ●
Telehealth ● ● ● ● ● ● ● ●
16Product Solutions
Populations & Products AZ AR CA CT4 FL GA4 IL IN IA1 KS LA MD2,4 MA MI MN MS MO NE NH4 NM3 NY NV OH OR PA4 SC TN TX VT WA WI
TANF ● ● ● ● ● ● ● ● ● ● ● ● ● ● ● ● ● ● ● ● ● ● ●
Medicaid Expansion ● ● ● ● ● ● ● ● ● ● ● ● ● ● ●
CHIP ● ● ● ● ● ● ● ● ● ● ● ● ● ● ● ● ● ● ● ● ● ●
ABD (non-duals) ● ● ● ● ● ● ● ● ● ● ● ● ● ● ● ● ● ● ● ●
ABD (Medicaid only dual-eligibles ) ● ● ● ● ● ● ● ● ● ● ● ● ● ●
Medicaid-Medicare Plans ● ● ● ● ● ● ●
Intellectually/Developmentally Disabled ● ● ● ● ●
Long-Term Services and Supports ● ● ● ● ● ● ● ● ● ●
2 330
Foster Care ● ● ● ● ● ● ● ● ● ● ● ● ● ●
31
Medicare Advantage ● ● ● ● ● ● ● ● ● ● ● ● ● ● ● ● ● ● ●
Medicare Special Needs Plan
Health Insurance Marketplaces
Commercial Insurance (Lrg & Sm Grp)
●
●
●
●
●
●
●
●
●
●
● ● ● ● ● ● ~ ●
● ●
● ●
●
●
●
●
● ● ●
● ●
●
●
4
Correctional Healthcare ● ● ● ● ● ● ● ● ● ● ● ● ●
INTERNATIONAL PRODUCT
Specialty Health Solutions
STATES● AZ AR CA CT FL GA IL IN IA KS LA MD MA MI MN MS MO NE NH NM NY NV OH OR PA SC TN TX VT WA WI
Pharmacy Benefits
Behavioral & Specialty Therapies ●
●
●
●
●
●
●
●
●
M ARKETS
● ● ● ● ●
● ● ● ● ●
● ●
● ●
●
● ●
●
●
S●● OLUTIONS
● ● ●
● ● ●
● ●
●
●
●
●
● ●
Life & Health Management ● ● ● ● ● ● ● ● ● ● ● ● ● ● ● ● ● ● ● ● ● ● ● ● ● ●
Primary Care Solutions for Complex Pop. ● ● ● ● ● ● ● ● ●
Managed Vision ● ● ● ● ● ● ● ● ● ● ● ● ● ● ● ● ● ● ● ● ● ● ● ●
Dental Benefits ● ● ● ● ● ● ● ● ● ● ● ● ● ● ● ●
Telehealth (Nurse Triage/Education Line) ● ● ● ● ● ● ● ● ● ● ● ● ● ● ● ● ● ● ● ● ● ● ●
1 Iowa operations expected to commence July 1, 2019, subject to closing conditions and regulatory approval.
2 Managed Service Organization (MSO) contract.
3 Centennial Care Medicaid managed care operations expected to commence January 1, 2019, subject to closing conditions and regulatory approval.
4 Correctional Healthcare operations in CT, GA, MD, NH & PA reflect acquisition of MHM Services, Inc., which closed in the first quarter of 2018.
17Medicaid Leadership
BRINGING EXPERIENCE TO NEW MARKETS
1984 1995 1999 2004 2006 2006 2007 2009 2010
2011 2011 2012 2012 2012 2013 2013 2013 2015
2015 2017 2017 2017 2018 2018 20191 20192
1 Operations anticipated to commence January 1, 2019
2 Operations expected to commence July 1, 2019 18Envolve
RECENT SUCCESSES
Health Plan management services
Addressing market needs in NY and MD
and driving external
revenue growth via an Commercial Behavioral Health (ASO) and
integrated platform that EAP for 20,000 Operating Engineers
Union members
leverages the strength of
Centene’s specialty
solutions On.Demand diabetes
management for 43,000 county
employees and dependents
19National View
Centene State
Centene HIM Membership
2018 New HIM State
Peak Membership New States KS, MO, NV, NY (Fidelis Care)
Expansion States FL, GA, IN, OH, TX, WA
2015 167,000 AZ (2 counties)
Sole Carrier MS (Statewide)
2016 2018 683,000
GA & IN (some rural counties)
2017 1,200,000 States Where We are MO (25), IN (3), OH (3), NV
Covering Bare Counties (14), WA (2)
2018 1,650,000 Statewide Presence AR, MS, NH, NV
*2015 excludes Health Net, all years
exclude Fidelis Lowest Silver in 349 of 413 Counties
20Marketplace Demographics
Gender
and Age 46% 45%
2018*
45%
2016 2017
(avg. age 42) (avg. age 42) (avg. age 43)
Female 84%
54% 92%
55% 55%
Male
16%
Metal Tier
Silver 85%
2016 90%
2017 87%
2018*
92%
Bronze 12% 8% 11%
Gold & Platinum 84%
3% 16% 2% 16% 2%
* Based on signups as of 12/12/17
212018 Medicare Profile
Products
• Membership: over 420k (Projected Year-End 2018)
MA /
• $5B Revenue MAPD
• Multi-product
MMP
• Multi-state
D-SNP
C-SNP
I-SNP
Med.
Supp.
2017 Centene Medicare Market EGWP
2018 New Centene Medicare Advantage Additions
22Year-Over-Year Growth
Medicare Product Breakout
11%
MA/MAPD
15%
DSNP
2017
57% MMP
17%
Med. Sup.
9%
12%
2018 (P)
On pace to exceed 90k YoY
21% 58% enrollment growth target
23Accelerating Our Strategy
Expanding our national leadership in
government sponsored healthcare
2018
14.5 million
members
(pro forma as
of June 30,
2018) New York Presence, National Leadership
Shareholder
Return of over
2016 1,200%
11.4 million since 2010 (1)
members California, Medicare and Federal Presence
2010 • Expanding addressable market opportunities
1.5 million • Organic growth – new markets and new products
members • Seeking new acquisition opportunities
(1) From December 31, 2009 through August 27, 2018.
24Diversified Government Services Platform
+
6% 10% 5%
9% 9%
9%
18%
20%
65%
68%
81%
LTM 6/30/2018 LTM 6/30/2018 LTM 6/30/2018
Revenue: Revenue: Combined Revenue:
$52 billion $10 billion $62 billion
Medicaid/Complex Care Commercial/Exchanges
Medicare/Duals Specialty/Government
25Recently Acquired Provider Assets
• Serves 250,000 individuals • Leading at-risk provider in FL
• 300 facilities • Covers over 80,000
government sponsored
beneficiaries
• Expands correctional
footprint to 5 states
• Specialty care and support
services
26Technology and Analytics Capabilities
• A full-service PBM will complement to
Centene’s internal PBM
• Disruptive platform that allows to drive
change across the care continuum
• Expect to realize savings by significantly
reducing both administrative and drug-
impacted medical costs
27$677B Medicaid
Addressable
Markets $783B Medicare
$100B Health Insurance Marketplace
$1.86 $9B Correctional Healthcare
trillion* $109B Federal Services
$182B International
*Data based on CBO projections and Company estimates for FY19 28Targeted Medicaid
Pipeline Medicare
$270 Health Insurance Marketplace
Correctional Healthcare
billion Federal Services
International
29Recent Contract Wins
NEW MEXICO ARIZONA FLORIDA ARIZONA IOWA
Centennial Care AHCCCS Statewide Comprehensive Statewide contract
2.0 Program Complete Care Medicaid healthcare services for the IA Health
Managed Care Link Program
Contract
30Recent Contract Wins
WASHINGTON NEW KANSAS HEALTH NET FLORIDA
HAMPSHIRE FEDERAL SERVICES
Managed care Medical and Managed care Next generation Comprehensive
services to Apple dental staff to services to Military & Family healthcare
Health's the NH KanCare Life Counseling services
Integrated Department of beneficiaries (MFLC) Program
Managed Care Corrections statewide
(IMC) Medicaid
beneficiaries
31Medicaid Pipeline Realization
($ IN BILLIONS)
2012-2018
Total Total
Pipeline $174B 74 Contracts
Targeted Targeted
Pipeline $137B 52 Contracts
Realized or Contract
Anticipated Revenue* $27B 42 Wins
81% Win Rate
*Anticipated revenue includes contract wins that have not yet gone live
32Visibility on 2019 Total Revenue
$69+B
$59.6B* • HIF and CA pass
throughs
• Full Year of Fidelis
• Marketplace &
Medicare Market
Expansions
• Pennsylvania LTC
SE Region
• New Markets: NM & IA
• Reprocurement wins:
AZ, FL & IL
2018P 2019P
*2018 mid-point of guidance range
33A Growth Company
Long term expectations of
double digit growth in revenue and profit
Less than 50%
$1.9 Trillion Managed care penetration in
Addressable Market government sponsored healthcare
(Medicaid and Medicare expenditures)
34In Summary…
WE ARE A GROWTH COMPANY
Robust Demonstrated Ability to Convert
Pipeline Opportunities to CNC Revenue
Revenue Total Revenue in Excess of $69B with
Visibility Significant Opportunities in Process
Diversified Opportunities Across Markets,
Growth
Strategy Products, Specialty Services and M&A
35Appendix A
Reconciliation of Non-GAAP Measures
($ IN MILLIONS, EXCEPT EARNINGS PER SHARE DATA)
  Included in this presentation are certain non-GAAP financial measures that management believes provide information that is useful to investors in understanding period-over-
  period operating results and enhance the ability of investors to analyze Centene’s business trends and performance. These non-GAAP financial measures should not be
  considered in isolation, or as a substitute for the corresponding GAAP financial measures and may not be comparable to similar measures used by other companies. A
  reconciliation of these non-GAAP financial measures with the most directly comparable financial measure calculated in accordance with GAAP follows:

 Reconciliation of GAAP Earnings from Continuing Operations to Adjusted Diluted EPS:
                                                                                       2013            2014             2015             2016            2017          Q2 2017            Q2 2018
 GAAP Ea rni ngs from continui ng opera tions                                       $     161       $     268        $     356        $     559       $     828        $     254          $     300
 Amortiza tion of a cqui red i ntangi bl e a s s ets                                         6              16               24             147             156                39                 45
 Acqui s i tion rel a ted expens es                                                       -               -                  27             234               20                1                  1
 Ca l i forni a mi ni mum medi ca l l os s ra tio cha nges                                -               -                -               (195)            -                -                    30
 Cos t s ha ri ng reductions                                                              -               -                -                -                 22             -                  -
 Income tax reform                                                                        -               -                -                -              (125)             -                  -
 Cha ri tabl e contri bution                                                              -               -                -                  50              40             -                  -
 Debt extingui s hment                                                                    -               -                -                  11            -                -                  -
 Penn Trea ty a s s es s ment expens e                                                    -               -                -                -                 56             -                  -
 Income tax effects of a djus tments                                                        (2)             (6)            (20)             (79)           (108)             (14)               (16)
    Adjus ted Ea rni ngs from Continui ng Opera tions                               $     165       $     278        $     387        $     727       $     889        $     280          $     360
 Di l uted s ha res outs tandi ng (i n thous a nds )                                  112,494         120,360          123,066          163,975         176,702          176,420            199,451
    GAAP Di l uted EPS                                                              $    1.43       $    2.23        $    2.89        $    3.41       $    4.69        $    1.44          $    1.50
    Adjus ted Di l uted EPS (1)                                                     $    1.47       $    2.31        $    3.14        $    4.43       $    5.03        $    1.59          $    1.80

 Reconciliation of GAAP diluted EPS to Adjusted Diluted EPS:                           Annual Guidance
                                                                                      December 31, 2018
 GAAP di l uted EPS                                                                       $4.25 - $4.57
 Amortiza tion of i ntangi bl e a s s ets (2)                                             $0.81 - $0.83
 Acqui s i tion rel a ted expens es (3)                                                   $1.62 - $1.64
                                                                 (4)
 Ca l i forni a mi ni mum medi ca l l os s ra tio cha nges                                   $0.12
   Adjus ted Di l uted EPS                                                                $6.80 - $7.16

 (1)   Adjusted Diluted EPS is defined as GAAP diluted net earnings from continuing operations before amortization of acquired intangible assets, acquisition related expenses, other one time adjustments,
       and the tax impact of such adjustments, calculated on a per share basis. We believe these adjustments are not indicative of future performance.
 (2)   The amortization of acquired intangible assets per diluted share presented are net of an income tax benefit estimated to be $0.24 to $0.25 for the year ended December 31, 2018.
 (3)   Acquisition related expenses per diluted share are net of an income tax benefit estimated to be $0.50 to $0.51 for the year ended December 31, 2018.
 (4)   The impact of retroactive changes to the California minimum MLR is net of an income tax benefit estimated to be $0.03 to $0.04 for the year ended December 31, 2018.
Reconciliation of Non-GAAP Measures
($ IN MILLIONS, EXCEPT EARNINGS PER SHARE DATA)
Included in this presentation is Adjusted EBITDA and Adjusted SG&A. Management believes that these non-GAAP financial measures provide information that is useful to
investors in understanding period-over-period operating results and enhance the ability of investors to analyze Centene’s business trends and performance. These non-GAAP
financial measures should not be considered in isolation, or as a substitute for the corresponding GAAP financial measures and may not be comparable to similar measures used
by other companies.
The Company also references 2018(F) Adjusted Net Income Margin, 2018(F) Adjusted EBITDA, and 2018(F) Adjusted SG&A. The Company cannot provide a reconciliation of these
items without unreasonable efforts. As such, they have been excluded from the reconciliation below.
A reconciliation of Adjusted EBITDA and Adjusted SG&A, non-GAAP financial measures, with the most directly comparable financial measures calculated in accordance with
GAAP follows:
Reconciliation of GAAP Earnings from Continuing Operations to Adjusted EBITDA:
2015 2016 2017
GAAP Ea rni ngs from continui ng opera tions $ 356 $ 559 $ 828
Interes t expens e 43 217 255
Income taxes 339 599 326
Depreci a tion a nd a mortiza tion 112 281 362
Non-ca s h s tock compens a tion expens e from cont. opera tions 71 148 135
(1)
Adjus ted EBITDA $ 921 $ 1,804 $ 1,906
Reconciliation of GAAP Selling, General & Administrative expenses (SG&A) to Adjusted SG&A:
2015 2016 2017
GAAP s el l i ng, genera l a nd a dmi ni s tra tive expens es $ 1,802 $ 3,676 $ 4,446
Acqui s i tion rel a ted expens es 27 234 20
Penn Trea ty a s s es s ment expens e - - 56
Cha ri tabl e contri bution - 50 40
Adjus ted s el l i ng, genera l a nd a dmi ni s tra tive expens es $ 1,775 $ 3,392 $ 4,330
(1) Adjusted EBITDA is defined as net earnings attributable to Centene Corporation excluding income tax expense, interest expense, depreciation, amortization (excluding senior note premium amortization) and
non-cash compensation expense.Wells Fargo 2018
Healthcare Conference
-- Boston --
September 6, 2018You can also read