Weekly Influenza and COVID-19 Surveillance graphs - GOV.UK
←
→
Page content transcription
If your browser does not render page correctly, please read the page content below

Weekly Influenza and COVID-19
                        Surveillance graphs
   UKHSA publishes a weekly national influenza and COVID-19 surveillance report
   which summaries the information from the surveillance systems which are used
   to monitor influenza, COVID-19 and other seasonal respiratory viruses in
   England.

   Additional figures based on these surveillance systems are included in this slide
   set.

   The figures presented in this slide set are based on data from week 7 (between
   14 February and 20 February 2022).

                                                                                    1
24 February 2022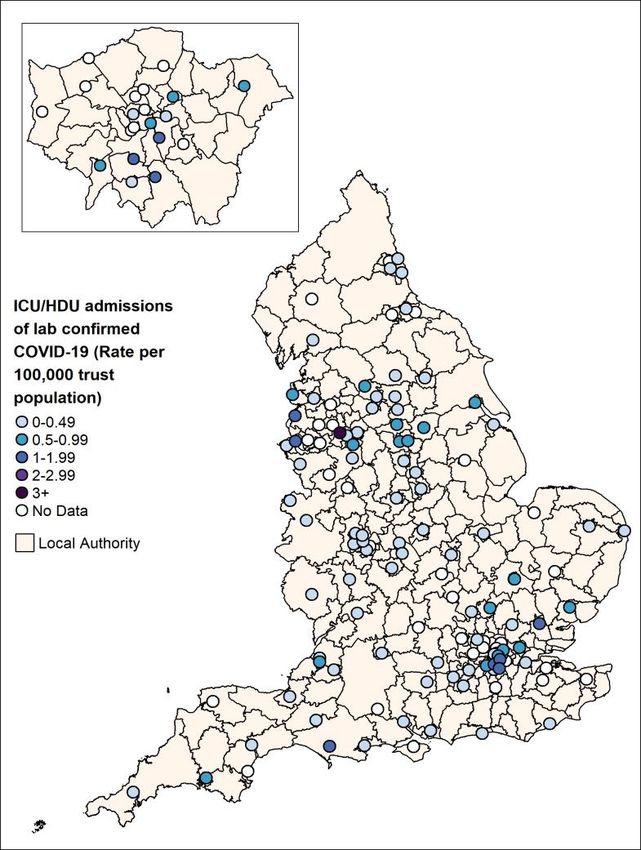
Contents

   1)    COVID-19 Pandemic Overview
   2)    Confirmed COVID-19 episodes in England
   3)    Respiratory Datamart system (England)
   4)    Second generation surveillance system (SGSS)
   5)    Community surveillance
   6)    Surveillance in ‘educational-age’ cohorts
   7)    Secondary Care surveillance
   8)    Mortality surveillance
   9)    Possible reinfections in England
   10)   Co/secondary infections with COVID-19

                                                        2
24 February 2022
COVID-19 Pandemic Overview

                                           3
24 February 2022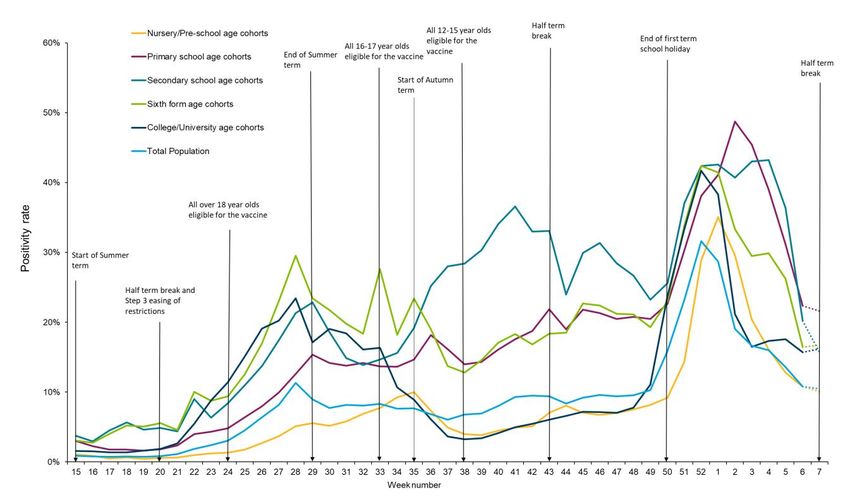
Confirmed COVID-19 episodes tested under Pillar 1 and Pillar 2, by sample week,
                               since week 5 2020

                    1200000
                                 Pillar 1 cases

                    1000000      Pillar 2 cases
   Nuber of cases

                    800000

                    600000

                    400000

                    200000

                          0
                              5 8 11 14 17 20 23 26 29 32 35 38 41 44 47 50 53 3 6 9 12 15 18 21 24 27 30 33 36 39 42 45 48 51 2 5

                                                                        Sample Week

                                                                                                                                     4
24 February 2022
Weekly overall hospital and ICU/HDU admission rates per 100,000 of new COVID-
                                              19 cases reported through SARI Watch, England since week 12 2020

                                  40.00
                                                                                                                         COVID-19 hospital admission rate

                                  35.00                                                                                  COVID-19 ICU/HDU admission rate

                                  30.00
   Admission rate (per 100,000)

                                  25.00

                                  20.00

                                  15.00

                                  10.00

                                   5.00

                                   0.00
                                          121416182022242628303234363840424446485052 1 3 5 7 9 111315171921232527293133353739414345474951 1 3 5 7
                                                                                        Week number

                                                                                                                                                    5
24 February 2022
Number of deaths since week 10 2020 by week of death and time since
                                  laboratory confirmation of COVID-19, England

                        10000                                                                                        28 day definition
                                                                                                                     60 day definition
                        9000

                        8000

                        7000
     Number of deaths

                        6000

                        5000

                        4000

                        3000

                        2000

                        1000

                           0
                                10121416182022242628303234363840424446485052 1 3 5 7 9 111315171921232527293133353739414345474951 1 3 5 7
                                                                              Week of death

                                                                                                                                         6
24 February 2022
Confirmed COVID-19 episodes in
                    England

                                          7
24 February 2022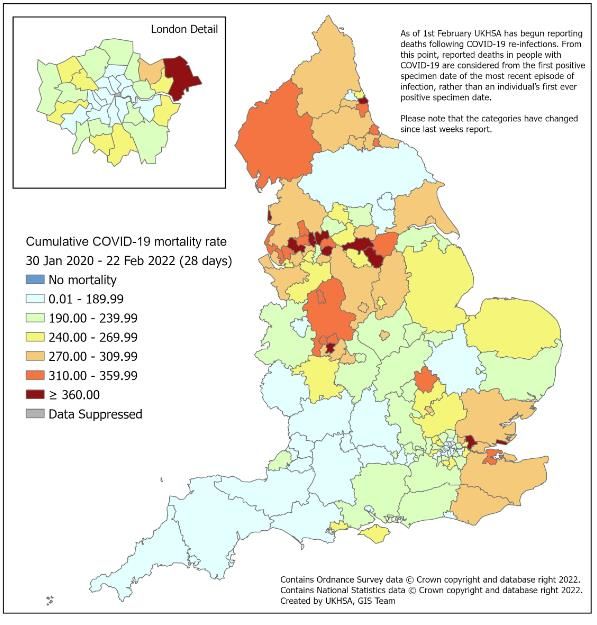
Confirmed COVID-19 episodes in England

    Data Information

    • From the week 32 report onwards, case rates have been updated to use the latest ONS population estimates for mid-2020. Previously
      case rates were calculated using the mid-2019 population estimates
    • Rates by ethnicity and IMD quantile will continue to be presented using the mid-2019 estimates, until the mid-2020 estimates become
      available.

    From 31 January 2022, UKHSA moved all COVID-19 case reporting in England to use a new episode-based definition which includes
    possible reinfections. Each infection episode is counted separately if there are at least 91 days between positive test results (PCR or LFD).
    Each infection episode begins with the earliest positive specimen date. Further information can be found on the UK COVID-19 dashboard.

                                                                                                                                          8
24 February 2022
Weekly COVID-19 episodes per 100,000 population by age group and region,
                   weeks 50 to 7

                                                                                              9
24 February 2022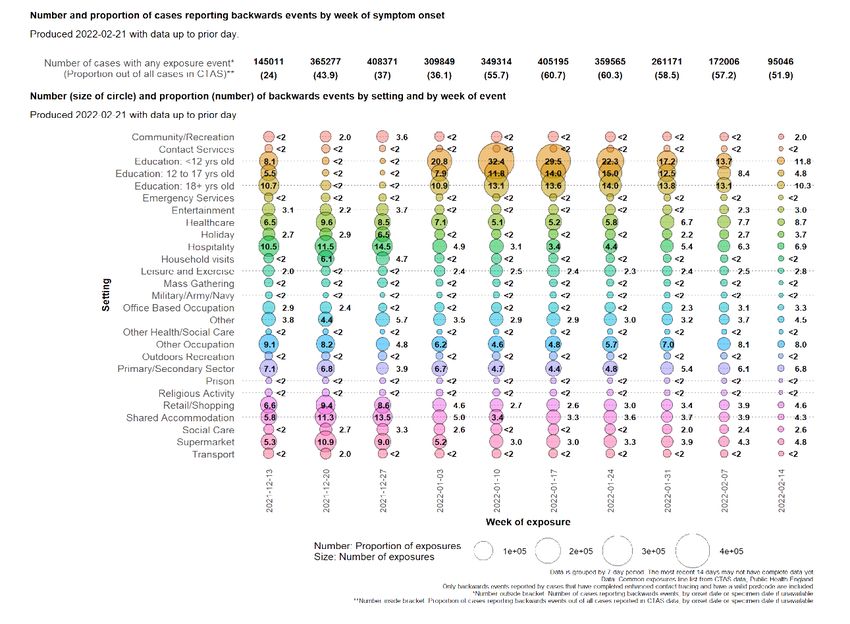
Weekly COVID-19 episodes per 100,000 population by ethnicity and region,
                   weeks 50 to 7

                                             *these incidence rates have been calculated using the mid-2019 ONS
                                             population estimates
                                                                                                                  10
24 February 2022
Weekly COVID-19 rate per 100,000 population by IMD quintile (1 being the
most deprived and 5 being the least deprived)
2,800.0
IMD Q1
IMD Q2
Case rate per 100,000 population
2,400.0
IMD Q3
2,000.0 IMD Q4
IMD Q5
1,600.0
1,200.0
800.0
400.0
0.0
424446485052 1 3 5 7 9 111315171921232527293133353739414345474951 1 3 5 7
Week Number
*these incidence rates have been calculated using the mid-2019 ONS
population estimates
11
24 February 2022Cumulative rate of COVID-19 episodes per 100,000 population tested under Pillar
1 and 2, by upper-tier local authority, England (box shows enlarged map of
London area)
12
24 February 2022Weekly PCR positivity of COVID-19 case by reason for test, weeks 43 2021 to
7 2022
60
50
40
Positivity (%)
30
20
10
0
43 45 47 49 51 53 2 4 6 8 10 12 14 16 18 20 22 24 26 28 30 32 34 36 38 40 42 44 46 48 50 52 2 4 6
Week number
Local council testing Symptomatic Citizen Symptomatic essential worker Study
13
24 February 2022Respiratory Datamart system (England)
14
24 February 2022Respiratory DataMart – Influenza subtypes
15
24 February 2022Respiratory DataMart – Respiratory syncytial virus (RSV)
16
24 February 2022Respiratory DataMart – Respiratory syncytial virus
(RSV) weekly positivity by UKHSA region
25.0
North of England
Proportion positive (%)
South of England
20.0
London
15.0 Midlands and East of England
10.0
5.0
0.0
41 45 49 53 4 8 12 16 20 24 28 32 36 40 44 48 52 4
Week number
17
24 February 2022Respiratory DataMart – other respiratory viruses
18
24 February 2022Second generation surveillance system
(SGSS)
19
24 February 2022SGSS reported Influenza A cases by region (all ages)
The presented figures are based on laboratory reports through SGSS. Testing and reporting procedures
vary by virus, UKHSA Centre and over time, including short-term trends in testing. Therefore
24 February 2022comparisons should be done with caution. 20
Previously, this data was presented by report date however is now presented by specimen date.SGSS reported Influenza B cases by region (all ages)
The presented figures are based on laboratory reports through SGSS. Testing and reporting procedures
vary by virus, UKHSA Centre and over time, including short-term trends in testing. Therefore
24 February 2022 comparisons should be done with caution. 21
Previously, this data was presented by report date however is now presented by specimen date.SGSS reported RSV cases by region (all ages)
The presented figures are based on laboratory reports through SGSS. Testing and reporting procedures vary by virus,
UKHSA Centre and over time, including short-term trends in testing. Therefore comparisons should be done with caution.
Previously, this data was presented by report date however is now presented by specimen date. 22
24 February 2022SGSS reported Adenovirus cases by region (all ages)
The presented figures are based on laboratory reports through SGSS. Testing and reporting procedures vary by virus,
UKHSA Centre and over time, including short-term trends in testing. Therefore comparisons should be done with caution.
23
24 February 2022SGSS reported Parainfluenza cases by region (all ages)
The presented figures are based on laboratory reports through SGSS. Testing and reporting procedures vary by virus,
UKHSA Centre and over time, including short-term trends in testing. Therefore comparisons should be done with caution.
24
24 February 2022SGSS reported Rhinovirus cases by region (all ages)
The presented figures are based on laboratory reports through SGSS. Testing and reporting procedures vary by virus,
UKHSA Centre and over time, including short-term trends in testing. Therefore comparisons should be done with caution.
25
24 February 2022SGSS reported hMPV cases by region (all ages)
The presented figures are based on laboratory reports through SGSS. Testing and reporting procedures vary by virus,
UKHSA Centre and over time, including short-term trends in testing. Therefore comparisons should be done with caution.
26
24 February 2022Community surveillance
27
24 February 2022COVID-19 clusters or outbreaks in educational settings
Data Information
• we report on new acute respiratory infection (ARI) incidents reported to Health Protection Teams (HPTs) and entered on
HPZone in the previous reporting week in educational settings by locality
• individual case notes are reviewed by an epidemiologist and an assessment made about whether the criteria for a confirmed
COVID-19 cluster or outbreak are met. See definitions below
• the incidents captured on HPZone represent a subset of all ongoing clusters and outbreaks in England. A variety of
arrangements are in place with local authorities and other stakeholders supporting HPTs, however data may not routinely be
documented on HPZone. As a result, the number of outbreaks reported for some of the regions are underestimates
• For the 2021-2022 academic year the thresholds for reporting an outbreak in an educational setting to HPTs and HPZone have
been revised, therefore comparisons with the 2020 to 2021 season should be interpreted with caution. Please see the next slide
for the updated thresholds.
Caveats
• National Schools and Universities helplines remain in place to support educational settings to manage cases and outbreaks that
may not require HPT input
• From Monday 19 July 2021, schools, colleges and nurseries no longer carry out routine contact tracing. Close contacts are now
identified and contacted by NHS Test and Trace.
28
24 February 2022COVID-19 clusters or outbreaks in educational settings
Thresholds for reporting
For the 2021-2022 academic year the thresholds for reporting an outbreak in an educational setting to HPZone have been revised,
therefore when comparing with the 2020-2021 season, please interpret with caution.
Clusters and outbreaks are now reported to HPZone if either of the two following criteria are met:
• 5 cases or 10% (whichever is reached first) test-confirmed cases of COVID-19 (either PCR testing or LFD Ag testing with follow-
up PCR) within 10 days, among students or staff clustered in a consistent group or cohort. Dates should be calculated based on
illness onset, or test date if asymptomatic
Or
• Evidence of severe illness e.g. students or staff members admitted to hospital or a death as a result of a COVID–19 infection
(PCR or LFD Ag with follow up PCR) as the setting may require advice on risk assessment and communication.
Definitions
Cluster: two or more test-confirmed cases of COVID-19 among individuals associated with a specific non-residential setting with
illness onset dates within a 14-day period (in the absence of detailed information about the type of contact between the cases).
Outbreak: two or more test-confirmed cases of COVID-19 among individuals associated with a specific non-residential setting with
illness onset dates within 14 days, and one of:
• identified direct exposure between at least 2 of the test-confirmed cases in that setting (for example under one metre face to
face, or spending more than 15 minutes within 2 metres) during the infectious period of one of the cases
• When there is no sustained local community transmission - absence of an alternative source of infection outside the setting for
the initially identified cases
29
24 February 2022Number of COVID-19 confirmed clusters or outbreaks by type of educational
setting, England
480
460
440
420
400
380
360
340 Nursery
Number of COVID-19 incidents
320
300 Primary School
280
260
Secondary School
240
220
Combined
200
180
Special Educational Needs (SEN) schools
160
140
College/University
120
100
80
60
40
20
0
35 36 37 38 39 40 41 42 43 44 45 46 47 48 49 50 51 52 1 2 3 4 5 6 7
Report Week
30
24 February 2022Number of COVID-19 confirmed clusters or outbreaks by type of educational
setting, England
End of academic year total
Week 36 2020- 34 2021
Cumulative number of confirmed COVID-19 clusters or outbreaks by type of educational setting for the 2020/21 academic year Week 36 2020- 34 2021
Centres Special Educational
Nursery Primary School Secondary School Combined College University Total
Needs (SEN) schools
Total 846 2125 2122 40 666 268 6067
Week 7 2022
Main table
* Number of clusters or outbreaks for the most recent week in brackets
31
24 February 2022Weekly number of COVID-19 case in NHS Test and Trace contact tracing data,
who reported attending educational settings
Data sources/definitions
1. The NHS Test & Trace contact tracing form asks individuals about their work or education settings. This report includes those who
selected: 'Attending childcare, school, education setting’ and selected an education setting of: 'Primary school’, 'Secondary school' or
'college' (counted together), 'University’.
2. Age was used to confirm that cases were likely to be students, using the following age ranges as inclusive cut-offs: Primary school: 4 to
12 years old Secondary school college: 11 to 19 years old University: 16 years and above
3. Student cases may not be recorded if 'work and education' was selected rather than 'Attending childcare, school, education setting’
Approximately 1% of primary, secondary, and college cases may be underreported because of this, and 4% of university cases.
4. Weeks are defined using ISO-8601, meaning Week 1 starts Monday January 4th and ends Sunday January 10th, 2021.
5. Percentages in charts = percent of all cases (people who tested positive and were referred for contact tracing) for that week, this
includes cases which may not have completed the forms and entered work or education settings.
6. The data starts 23 October 2020, when education settings started to be recorded in the present format, and ends with the most recent
complete week.
7. Cases are assigned to dates by the date they were transferred to the NHS Test and Trace contact tracing system.
8. If a case reports being in education, this does not specify that they attended the setting in person during the time that they were
exposed/infectious (for example they may have been remote learning). In addition, cases that did attend in person may have been
exposed in other settings, such as their household or while doing other activities. This data can not be used to directly infer that these
cases acquired their infection, or that they exposed others, in an the education setting.
32
24 February 2022Number of people testing positive that reported attending primary school and
proportion among all people testing positive (weeks 43 2020 to 7 2022)
(Data source: NHS Test and Trace)
33
24 February 2022 Return to contents pageNumber of people testing positive that reported attending secondary school and
proportion among all people testing positive (weeks 43 2020 to 7 2022)
(Data source: NHS Test and Trace)
34
24 February 2022Number of people testing positive that reported attending university and
proportion among all people testing positive (weeks 43 2020 to 7 2022)
(Data source: NHS Test and Trace)
35
24 February 2022Exposure events reported by COVID-19 cases resident in England in the 7-2
days before symptom onset, by setting type and date of event
36
24 February 202237 24 February 2022
Surveillance in ‘educational-age’
                           cohorts

                                                   38
24 February 2022
Methodology and limitations
• Data source: SGSS Pillar 1 (NHS and UKHSA testing) and Pillar 2 (community testing) – England
• Educational-age cohorts have been calculated using dates of birth that correspond to a particular year group.
School year groups run from 1 September to 31 of August of the following calendar year.
• We include all cases regardless of whether or not they attended an educational setting or whether or not the
educational setting was open during the reporting period
• Data for the most recent week are provisional and likely to be an underestimate
• The 2021-2022 school season commenced 1 September 2021. For information regarding the 2020-2021 school
season please refer to the Weekly National Flu and COVID-19 reports published between 22 October 2020 to 2
September 2021.
• The following cohorts became eligible for COVID-19 vaccination on the dates indicated below :
– All over 18 year olds, from week 24 2021
– All 16 to 17 year olds, from week 33 2021
– All 12 to 15 year olds, from week 38 2021
• More information on vaccine coverage can be found here: https://www.gov.uk/government/publications/covid-19-vaccine-
surveillance-report
• From week 39 the data for the “Secondary age cohort” (Years 7-13) has been split into the “Secondary age cohort” and the
“Sixth form age cohort” (Years 7-11 and Years 12-13 respectively)
• From 31 January 2022, UKHSA moved all COVID-19 case reporting in England to use a new episode-based definition
which includes possible reinfections. Each infection episode is counted separately if there is at least 91 days between
positive test results (PCR or LFD). Each infection episode begins with the earliest positive specimen date. Further
information can be found here. This change has been reflected in slides 3 to 16.
39
24 February 2022Methodology and limitations - Birth cohort – Year group
Birth cohort Year group
• The table aside represents the birth cohorts for each
01/09/1999 to 31/08/2000 Uni Year 4
year group 01/09/2000 to 31/08/2001 Uni Year 3
01/09/2001 to 31/08/2002 Uni Year 2
01/09/2002 to 31/08/2003 Uni Year 1
01/09/2003 to 31/08/2004 Year 13
01/09/2004 to 31/08/2005 Year 12
01/09/2005 to 31/08/2006 Year 11
01/09/2006 to 31/08/2007 Year 10
01/09/2007 to 31/08/2008 Year 9
01/09/2008 to 31/08/2009 Year 8
01/09/2009 to 31/08/2010 Year 7
01/09/2010 to 31/08/2011 Year 6
01/09/2011 to 31/08/2012 Year 5
01/09/2012 to 31/08/2013 Year 4
01/09/2013 to 31/08/2014 Year 3
01/09/2014 to 31/08/2015 Year 2
01/09/2015 to 31/08/2016 Year 1
01/09/2016 to 31/08/2017 Reception
01/09/2017 to 31/08/2018 Pre-school
01/09/2018 to 31/08/2019 Nursery
40
24 February 2022Weekly number of COVID-19 episodes, from Week 30 2020 in:
- nursery/preschool age cohorts
- primary school age cohorts
- secondary school age cohorts
- college/University age cohorts
24 February 2022 41Weekly incidence of COVID-19 cases, by episode, per 100,000 population from Week 30 2020, in:
- nursery/preschool age cohorts
- primary school age cohorts (Reception to Year 6)
- secondary school age cohorts (Year 7 to Year 11)
- sixth form (Year 12 to Year 13)
- college/University age cohorts
24 February 2022 42Weekly incidence of COVID-19 cases, by episode, per 100,000 population from Week 23 2021, in
secondary age cohorts (Year 7 to 11) and sixth form age cohorts (Year 12 to Year 13) with dose 1 vaccine
uptake in 12 to 15 year olds and in 16 to 17 year olds
Incidence definition: School age cohorts are calculated based on academic year birth cohorts. Those born between 01/09/2004 – 31/08/2005 are included in the year 12
school group and those born between 01/09/2003 – 31/08/2004 are included in the year 13 school group. Case rate denominators are sourced from ONS 2020 mid-year
estimates.
Vaccine coverage definition: From Week 42 the ages are calculated based on age as of 31 August 2021. The under 50 age group includes all those aged under 50 including
those born after the 31 August 2021 (denominator). Those whose date of birth is after the 31 August 2021, have an age of zero and are included in the denominator. Only
vaccinations recorded as given to persons aged greater or equal to 1 have been included (numerator). Both numerators and denominators are sourced from the NIMS and
exclude deaths. All data presented are for vaccinations within the living population on the date of extraction and therefore removes both formal and informal registered
deaths in the numerator and denominator for the purposes of calculating vaccine uptake.
24 February 2022 43Weekly incidence of COVID-19 cases, by episode, per 100,000 population in
educational age cohorts presented by Year group, from nursery to Year 6,
weeks 49 2021 to 07 2022
24 February 2022 44Weekly incidence of COVID-19 cases, by episode, per 100,000 population in
educational age groups presented by secondary school year groups (Year 7 to
Year 13), weeks 49 2021 to 07 2022
24 February 2022 45Weekly incidence of COVID-19 cases, by episode, per 100,000 population in
educational age cohorts corresponding to university/college year groups,
weeks 49 2021 to 07 2022
24 February 2022 46Weekly incidence of COVID-19 cases, by episode, per 100,000 population by
educational age cohorts and UKHSA region, weeks 49 2021 to 07 2022
Case rate, by episode, per 100,000
24 February 2022 47Weekly number of new COVID-19 episodes in educational age cohorts
presented by Year group, from nursery to Year 6, weeks 49 2021 to 07 2022
24 February 2022 48Weekly number of new COVID-19
episodes in educational age cohorts
presented by Year group, from nursery to
Year 6 (from Week 15 2021)
Above figure: Historic data - Weekly number of COVID-19 cases, from Week 13 2020 to
Week 34 2021
24 February 2022 49Weekly number of new COVID-19 episodes in educational age groups
presented by secondary school year groups (Year 7 to Year 13), weeks 49
2021 to 07 2022
24 February 2022 50Weekly number of new COVID-19
episodes in educational age groups
presented by secondary school year
groups (Year 7 to Year 13) (from
Week 15 2021)
Above figure: Historic data - Weekly number of COVID-19 cases, from Week 13 2020 to
Week 34 2021
24 February 2022 51Weekly number of new COVID-19 episodes in educational age cohorts
corresponding to university/college year groups, weeks 49 2021 to 07 2022
24 February 2022 52Weekly number of new COVID-19 episodes
in educational age cohorts corresponding to
university/college year groups (from Week
15 2021)
Above figure: Historic data - Weekly number of COVID-19 cases, from Week 13 2020 to
Week 34 2021
24 February 2022 53Weekly number of new COVID-19 episodes by educational age cohorts and Number of new COVID-19 episodes UKHSA region, weeks 49 2021 to 07 2022 24 February 2022 54
Weekly PCR positivity rates of COVID-19 cases in educational age cohorts
             presented by Year group, from nursery to Year 6, weeks 49 2021 to 07 2022

24 February 2022                                                                         55
Weekly PCR positivity rates of COVID-19 cases in educational age cohorts
presented by secondary school year groups (Year 7 to Year 13), weeks 49 2021
to 07 2022
24 February 2022 56Weekly PCR positivity rates of COVID-19 cases in educational age cohorts
corresponding to university/college year groups, weeks 49 2021 to 07 2022
24 February 2022 57Weekly SARS-CoV-2 PCR positivity rates,
Week 15 2021 to week 07 2022:
- nursery/preschool age cohorts
- primary school age cohorts
- secondary school age cohorts
- college/University age cohorts
Above figure: Historic data - Positivity rate from Week 13 2020 to
Week 34 2021
• Positivity data presented in this report has been calculated only using PCR from week 19 2020
• Previous reports have also included lateral flow device tests
• Changes to testing policies over time may impact on positivity rates. From 11 January 2022 the requirement for confirmatory PCR testing
in individuals who test positive using a lateral flow device was temporarily removed
24 February 2022 58Weekly rate of individuals tested for SARS-CoV-2 by
PCR per 100,000 population, from Week 15 2021:
- nursery/preschool age cohorts
- primary school age cohorts
- secondary school age cohorts
- college/University age cohorts
Above figure: Historic data - Weekly rate of individuals tested from
Week 13 2020 to Week 34 2021
• Positivity data presented in this report has been calculated only using PCR from week 13 2020
• Previous reports have also included lateral flow device tests
• Changes to testing policies over time may impact on positivity rates. From 11 January 2022 the requirement for confirmatory PCR
24 February 2022 testing in individuals who test positive using a lateral flow device was temporarily removed 59Secondary Care surveillance
60
24 February 2022 Return to main menuWeekly admission rates for hospital and ICU/HDU laboratory confirmed
COVID-19 cases reported through SARI Watch, week 7
Source: PHE SARI-Watch (Severe Acute Respiratory Infection-Watch, formerly CHESS).
*Only NHS Acute trusts that have reported ≥1 day in the past week; excludes Specialist trusts. Acute NHS trusts (including Specialist trusts) reporting into SARI-Watch
COVID-19 hospitalisation surveillance are typically around 100 per week. This was 105 for the hospitalisation (all levels of care) indicator in week 14 to 20 February
2022 inclusive and 98 trusts for the ICU/HDU indicator. For the maps, as Specialist trusts are excluded, the number of trusts providing data on COVID-19
hospitalisations in week ending 20 February 2022 was 97 and 90 for ICU/HDU admissions for COVID-19
61
24 February 2022Age/sex pyramid of hospitalisations (all levels of care) for COVID-19, data
from sentinel acute NHS trusts, England
(a) Peak of 2nd wave (week 53 2020 to (b) Most recent 4 weeks (week 4 2022
week 3 2021) n= 6,359 to 7 2022) n=2036 Male Female
80+ 80+ y
70-79 70-79y
60-69y 60-69y
50-59y
Age group
50-59y
40-49y
40-49y
30-39y
30-39y 20-29y
20-29y 10-19y
10-19y 5-9y
5-9y FemaleAge/sex pyramid for admissions to ICU/HDU for COVID-19, mandatory case
level data, acute NHS trusts, England
(a) Peak of 2nd wave (week 53 2020 to (b) Most recent 4 weeks (week 4 2022
week 3 2021) n= 3,349 to 7 2022) n=231
Male Female
80+
80+ y
70-79
70-79y
60-69y
60-69y
50-59y 50-59y
40-49y 40-49y
30-39y 30-39y
20-29y
20-29y
10-19y
10-19y
5-9y
5-9y Female MaleLaboratory confirmed admissions for COVID-19, to acute NHS trusts, by level
of care and ethnicity
(a) Peak of 2nd wave (week 53 2020 to (b) Most recent 4 weeks (week 4 2022
week 3 2021) to 7 2022)
88.81 89.25
White White
72.06 82.23
7.43 7.25
Asian Asian
17.09 8.63
1.67
2.08 Black
Black 6.60
7.91
1.18
0.86 Lower level of care (n=5932) Mixed ethnic group
1.52
Mixed ethnic group Lower level of care (n=1861)
1.44 0.64
ICU/HDU (n=3060) Other ethnic group ICU/HDU (n=197)
0.83 1.02
Other ethnic group
1.50 0 20 40 60 80 100
0 20 40 60 80 100 proportion of admitted cases (%)
proportion of admitted cases (%)
Reporting trusts Reporting trusts
Lower level of care=5932 Lower level of care=1861
ICU/HDU=3060 ICU/HDU=197
This figure is based on individual patient level data which are provided to SARI Watch from a subset of NHS Acute Trusts, therefore the data should be
interpreted with caution as the distribution of age, sex and ethnic group may not be representative of all hospitalised patients.
Caveat: From week 24 the ethnicity analysis is based on a new method for assigning ethnicity, developed by UKHSA. The previous method used the most
recent ethnicity recorded through linkage to Hospital Episode Statistics. However, this method led to unfeasibly high rates in the ‘Other’ ethnic group
when applied to COVID-19 cases, hospitalisation or mortality. The new method uses the most frequent ethnicity recorded through linkage to Hospital
Episode Statistics, unless the most frequent was ‘Other’ when the second most frequent was chosen.
64
24 February 2022Weekly COVID-19 hospitalisation rate per 100,000 trust catchment population by
age group and region, weeks 50 to 7
65
24 February 2022Hospital admission rate (excluding ICU/HDU) by ethnicity per 100,000 trust
catchment population
70.00
Per 100,000 Ethnicity-specific Trust Catchment Population
60.00
50.00
40.00
30.00
20.00
10.00
0.00
12 14 16 18 20 22 24 26 28 30 32 34 36 38 40 42 44 46 48 50 52 1 3 5 7 9 11 13 15 17 19 21 23 25 27 29 31 33 35 37 39 41 43 45 47 49 51 1 3 5 7
Week Number
White Asian Black Mixed Other
Caveat: From week 24 the ethnicity analysis is based on a new method for assigning ethnicity, developed by UKHSA. The previous method used the most recent
ethnicity recorded through linkage to Hospital Episode Statistics. However, this method led to unfeasibly high rates in the ‘Other’ ethnic group when applied to COVID-
19 cases, hospitalisation or mortality. The new method uses the most frequent ethnicity recorded through linkage to Hospital Episode Statistics, unless the most
frequent was ‘Other’ when the second most frequent was chosen.
66
24 February 2022Rate of admission to ICU/HDU by ethnicity, per 100,000 trust catchment
population
16.00
Per 100,000 Ethnicity-specific Trust Catchment Population
14.00
12.00
10.00
8.00
6.00
4.00
2.00
0.00
12 14 16 18 20 22 24 26 28 30 32 34 36 38 40 42 44 46 48 50 52 1 3 5 7 9 11 13 15 17 19 21 23 25 27 29 31 33 35 37 39 41 43 45 47 49 51 1 3 5 7
Week Number
White Asian Black Mixed Other
Caveat: From week 24 the ethnicity analysis is based on a new method for assigning ethnicity, developed by UKHSA. The previous method used the most recent
ethnicity recorded through linkage to Hospital Episode Statistics. However, this method led to unfeasibly high rates in the ‘Other’ ethnic group when applied to COVID-
19 cases, hospitalisation or mortality. The new method uses the most frequent ethnicity recorded through linkage to Hospital Episode Statistics, unless the most
frequent was ‘Other’ when the second most frequent was chosen.
67
24 February 2022COVID-19 as primary reason for admission among hospitalised patients
positive for SARS-CoV-2 by age group and time period
COVID-19 as primary reason for admission among hospitalised patients
positive for SARS-CoV-2 by age group and time period
100
% of admisisons per age group
90
80
70
60
50
40
30
20
10
0
6-11mos
6-11mos
30-29
80+
80+Mortality surveillance
69
24 February 2022Cumulative mortality rate of COVID-19 cases per 100,000 population tested
under Pillar 1 and 2 since the beginning of the pandemic by (a) 28 day definition
and (b) 60 day definition
(a) (b)
70
24 February 2022Age-adjusted mortality rate** (per 100,000 population) in confirmed cases of
COVID-19 by IMD quintile, by week using the 60 day definition
900
800
700
Rate (100,000 population)
600
500
400
300
200
100
0
40 42 44 46 48 50 52 01 03 05 07 09 11 13 15 17 19 21 23 25 27 29 31 33 35 37 39 41 43 45 47 49 51 01 03 05 07
Week of Death
1 2 3 4 5
**Rates are time-adjusted: a weekly population denominator has been used to calculate the mortality rate
71
24 February 2022Possible reinfections in England
(updated monthly – last update 17 February)
72
24 February 2022Possible reinfections in England
The following figures present population data based on the first time that individuals tested positive for SARS-CoV-2
through PCR and/ or lateral flow device testing in England together with those who have tested positive for SARS-CoV-
2 through PCR and/ or lateral flow testing with an interval of at least 90 days between two consecutive positive tests.
This excludes positive LFD test results removed from the main SGSS dataset because the LFD test positive result was
followed by a negative PCR result within 3 days and LFD test results where we have had feedback that a positive result
was entered in error. The interval of 90 days is in line with the definition currently adopted within Siren, by CDC in
their definition of a person to prioritise for investigation of suspected SARS-CoV-2 reinfection and the draft definition
being considered by the World Health Organisation for a suspected reinfection.
These figures present population level data that complements studies that can undertake more detailed investigation
at an individual level as exemplified by SIREN the large multicentre prospective cohort study that has followed around
45,000 participants employed by NHS hospitals. In line with other studies, this suggested that those with serological
evidence of a previous SARS_CoV-2 infection had an 84% lower risk of infection than those without evidence of prior
infection over a median 7-month period.
For a possible reinfection to be categorised as confirmed they require sequencing of a specimen at each episode and
for the second specimen to be genetically distinct from that sequenced from the first episode. Availability of such dual
sequencing is currently very low for several reasons; sequencing was not widely undertaken early in the pandemic;
LFD test results do not allow sequencing and some PCR samples have a low viral load where sequencing cannot be
undertaken. To meet the definition of a probable reinfection requires sequencing at the second episode that identifies
a variant that was not circulating at the time of the first episode.
Further data on reinfections is published in the weekly Influenza and COVID-19 surveillance report.
73
24 February 2022Possible reinfections and first infections in England to week 2022-05
It is important to consider reinfections in the context of first infections and there is a 90-day delay before people with a first
infection can become eligible for reinfection. The graph below shows: numbers of possible reinfections and numbers of
first infections (secondary Y-axis) by week of onset (based on sample date throughout) through the weeks of the pandemic.
The data collected for week 05 are not complete and results are provisional.
74
24 February 2022The age and sex distribution of possible reinfections by overall rate per 1000 first infections
(up to week 05, provisional) by sex and age group in England
75
24 February 2022Co/secondary infections with COVID-19
76
24 February 2022Co/secondary infections with COVID-19
• Caveat - undertesting for other pathogens may result in an underestimate of co/secondary
infection cases.
• Co/secondary infections refers to when a patient has an infection with more than one pathogen at
the same time (co-infection), or acquires another infection after contracting the first infection
(secondary infection). Please see Appendix 1 – Co and secondary infection with COVID-19
definitions.
• Numbers of co/secondary infection remain low across UKHSA surveillance systems.
• For patients with severe respiratory failure requiring Extra Corporeal Membrane Oxygenation
(ECMO), analysis of data from five adult ECMO centres in England indicates that
among patients with severe respiratory failure due to COVID-19, almost a third of these have
co/secondary infections.
• Published data analysis from pandemic wave 1 (W-1) indicates increased mortality associated with
COVID-19 and influenza, key bacterial and fungal infections and invasive pneumococcal disease
(IPD) in comparison to patients without co/secondary infection.
• Data analysis from W-1 indicates that Aspergillus and candidemia cases have increased risk of
mortality in comparison to patients without co/secondary infection.
77
24 February 2022Co/secondary infections among patients with severe respiratory
failure requiring Extra Corporeal Membrane Oxygenation (ECMO)
Analysis is based on cumulative data from five adult ECMO centres in England. The data
covers ECMO activity from week 40 2019 (30 Sep 2019) to week 39 2021 (ending 3
Oct 2021) to cover two complete seasons. Data covering wave 1 of the pandemic was from
week 40 2019 to week 39 2020. Data covering waves 2 and 3 of the pandemic was from week
40 2020 to week 39 2021. COVID-19 cases were reported from week 05 2020 (commencing
27 Jan 2020).
• In the 2020/21 season (as defined above), 30% (112/373) of ECMO patients admitted for
severe respiratory failure due to laboratory confirmed COVID-19 had co/secondary
infections. In the 2019/20 season (as defined above) this figure was 33% (79/236).
• In both seasons the majority of co/secondary infections among respiratory failure COVID-
19 cases comprised Gram-negative bacilli from the order Enterobacterales: 46% (36/79)
in 2019/20, decreasing significantly to 29% (33/112) in 2020/21.
78
24 February 2022Surveillance of respiratory viral infections, in
COVID-19 patients in England,
January 2020 to January 2022
79
24 February 2022) Change to metric
• From 31 January 2022, UKHSA has changed the COVID-19 case
definition to include multiple infection episodes
• Reported co-/secondary infections in England now use the new
definition, revising all cases back to the beginning of the pandemic
• Please note data is provisional and is subject to change due to
ongoing quality assurance checks
80
24 February 2022Number of COVID-19 patient-episodes with other respiratory viral
infections, reported to SGSS and Respiratory Datamart, in COVID-19
patients diagnosed in England since January 2020†, by virus and timing of
diagnosis
Key findings:
• 0.02% of COVID-19
patient-episodes
had infection with
another
respiratory virus
detected within 28
days of their
COVID-19
diagnosis
• Infections with
other respiratory
viruses were most
commonly
†SARS-CoV-2 specimen dates from 30 Jan 2020 to 2 Jan 2022 (n=12,030,993)
*detection of respiratory virus +/- 1 days either side of first COVID-19 specimen in patient-episode
categorised as co-
**secondary respiratory virus detection 2-28 days after first COVID-19 specimen in patient-episode infections (47.5%)
***secondary COVID-19 detection 2-28 days after primary respiratory virus detection
‡ Human metapneumovirus ‡‡ Respiratory syncytial virus
Please note patients can have multiple viruses identified, numbers here do not reflect the number of patients.
24 February 2022 81Number of COVID-19 patient-episodes with other respiratory viral infections, reported
to SGSS and Respiratory Datamart, in COVID-19 patients diagnosed in England in wave
1†, by virus and timing of diagnosis
Key findings, Wave 1:
• 0.15% of COVID-19
patient-episodes
had infection with
another respiratory
virus detected
within 28 days of
their COVID-19
diagnosis
• Infections with
other respiratory
viruses were most
commonly
categorised as co-
infections (52.8%)
†SARS-CoV-2 specimen dates from 30 Jan 2020 to 28 Jun 2020 (n=243,898)
*detection of respiratory virus +/- 1 days either side of first COVID-19 specimen in patient-episode
**secondary respiratory virus detection 2-28 days after first COVID-19 specimen in patient-episode
***secondary COVID-19 detection 2-28 days after primary respiratory virus detection
‡ Human metapneumovirus ‡‡ Respiratory syncytial virus
Please note patients can have multiple viruses identified, numbers here do not reflect the number of patients.
82
24 February 2022Number of COVID-19 patient-episodes with other respiratory viral infections, reported to
SGSS and Respiratory Datamart, in COVID-19 patients diagnosed in England in wave 2†, by
virus and timing of diagnosis
Key findings, Wave 2:
• 0.01% of COVID-19
patient-episode had
infection with
another respiratory
virus detected
within 28 days of
their COVID-19
diagnosis
• Infections with
other respiratory
viruses were most
commonly
categorised as co-
infections (41.4%)
†SARS-CoV-2 specimen dates from 29 Jun 2020 to 26 Apr 2021 (n=3,695,593)
*detection of respiratory virus +/- 1 days either side of first COVID-19 specimen in patient-episode
**secondary respiratory virus detection 2-28 days after first COVID-19 specimen in patient-episode
***secondary COVID-19 detection 2-28 days after primary respiratory virus detection
‡ Human metapneumovirus ‡‡ Respiratory syncytial virus
Please note patients can have multiple viruses identified, numbers here do not reflect the number of
patients.
24 February 2022 83Number of COVID-19 patient-episodes with other respiratory viral infections, reported to SGSS
and Respiratory Datamart, in COVID-19 patients diagnosed in England in wave 3†, by virus and
timing of diagnosis
Key findings, Wave 3:
• 0.02% of COVID-19
patient-episode had
infection with
another respiratory
virus detected within
28 days of their
COVID-19 diagnosis
• Infections with other
respiratory viruses
were most commonly
categorised as co-
infections (47.5%)
†SARS-CoV-2 specimen dates from 27 Apr 2021 to 2 Jan 2022 (n=8,091,502)
*detection of respiratory virus +/- 1 days either side of first COVID-19 specimen in patient-episode
**secondary respiratory virus detection 2-28 days after first COVID-19 specimen in patient-episode
***secondary COVID-19 detection 2-28 days after primary respiratory virus detection
‡ Human metapneumovirus ‡‡ Respiratory syncytial virus
Please note patients can have multiple viruses identified, numbers here do not reflect the number of patients.
24 February 2022 84Number of other respiratory viral infections, reported to SGSS and Respiratory Datamart, in
COVID-19 patients diagnosed in England since January 2020†, by virus and timing of
diagnosis
700 Key findings:
• Most frequent viruses
co/secondary infection
600
No. respiratory viral
identified from co-/secondary
500
infection isolates were RSV and
400 rhinovirus
300
200 †SARS-CoV-2 specimen dates from 30 Jan 2020 to 2 Jan
2022
100 *detection of respiratory virus +/- 1 days either side of first
COVID-19 specimen in patient-episode
0 **secondary respiratory virus detection 2-28 days after
first COVID-19 specimen in patient-episode
***secondary COVID-19 detection 2-28 days after primary
respiratory virus detection
‡ Human metapneumovirus ‡‡ Respiratory syncytial virus
Please note patients can have multiple viruses identified,
numbers here do not reflect the number of patients.
Secondary COVID-19 infection after other respiratory infection***
Secondary infection after COVID-19 infection**
Co-infection*
24 February 2022 85Number of other respiratory viral infections, reported to SGSS and Respiratory
Datamart, in COVID-19 patients diagnosed in England in wave 1†, by virus and
timing of diagnosis
140
co/secondary infection
120
No. respiratory viral
100
80 Key findings:
60 • Most frequent viruses identified
40
from co-/secondary infection
isolates were seasonal
20
coronavirus and Influenza A
0
†SARS-CoV-2 specimen dates from 30 Jan 2020 to 28 Jun
2020
*detection of respiratory virus +/- 1 days either side of first
COVID-19 specimen in patient-episode
**secondary respiratory virus detection 2-28 days after first
COVID-19 specimen in patient-episode
Secondary COVID-19 infection after other respiratory infection*** ***secondary COVID-19 detection 2-28 days after primary
Secondary infection after COVID-19 infection** respiratory virus detection
‡ Human metapneumovirus ‡‡ Respiratory syncytial virus
Co-infection* Please note patients can have multiple viruses identified,
numbers here do not reflect the number of patients.
24 February 2022 86Number of other respiratory viral infections, reported to SGSS and Respiratory Datamart,
in COVID-19 patients diagnosed in England in wave 2†, by virus and timing of diagnosis
180
Key findings:
160
co/secondary infection
• Most frequent viruses
No. respiratory viral
140
120
identified from co-
100
/secondary infection
80
isolates were seasonal
60
coronavirus and
40
enterovirus
20
†SARS-CoV-2 specimen dates from 29 Jun 2020 to 26
0 Apr 2021
*detection of respiratory virus +/- 1 days either side of
first COVID-19 specimen in patient-episode
**secondary respiratory virus detection 2-28 days after
first COVID-19 specimen in patient-episode
***secondary COVID-19 detection 2-28 days after
primary respiratory virus detection
‡ Human metapneumovirus ‡‡ Respiratory syncytial virus
Please note patients can have multiple viruses identified,
Secondary COVID-19 infection after other respiratory infection*** numbers here do not reflect the number of patients.
Secondary infection after COVID-19 infection**
Co-infection*
24 February 2022 87Number of other respiratory viral infections, reported to SGSS and Respiratory Datamart,
in COVID-19 patients diagnosed in England in wave 3†, by virus and timing of diagnosis
Key findings:
700
• Most frequent viruses
co/secondary infection
600
No. respiratory viral
identified from co-
500
/secondary infection
400
isolates were RSV and
300 rhinovirus
200
†SARS-CoV-2 specimen dates from 27 Apr 2021
100
to 2 Jan 2022
*detection of respiratory virus +/- 1 days either
0
side of first COVID-19 specimen in patient-
episode
**secondary respiratory virus detection 2-28
days after first COVID-19 specimen in patient-
episode
***secondary COVID-19 detection 2-28 days
after primary respiratory virus detection
Secondary COVID-19 infection after other respiratory infection*** ‡ Human metapneumovirus ‡‡ Respiratory
syncytial virus
Secondary infection after COVID-19 infection**
Please note patients can have multiple viruses
Co-infection* identified, numbers here do not reflect the
number of patients.
24 February 2022 88COVID-19 Co/secondary infection with fungi
and vaccine preventable bacteria
*COVID-19-associated pulmonary aspergillosis
Please note fungal data refers to secondary infections only. Mycology data contains results from Mycology reference laboratory
data, Candidaemia is representative of deep infection. One case of osteomyelitis, one case of ventriculitis and one case of
endocarditis was documented in wave two. Bordetella pertussis co-infection is defined as +/- 28 d Culture/PCR (based on pertussis
sample date), +/- 28 Serology/Oral fluid (anti-pertussis toxin Ig) (based on pertussis symptom onset date, excluding cases without
onset date). Haemophilus influenzae, Neisseria meningitidis and Streptococcus pneumoniae co-infection is defined as +/- 2d.
Legionella, Mycoplasma and gastrointestinal infection data not included.
24 February 2022 89Appendix 1: Co and secondary infection definitions with COVID-19
The day pertains to the date of the sample collection that yielded a positive result. These definitions do not apply to
persistent COVID-19 patients. Patients with persistent COVID-19 require independent clinical assessment.
Continued overleaf
24 February 2022 90Appendix 1 continued: Co and secondary infection definitions with
COVID-19
The day pertains to the date of the sample collection that yielded a positive result. These definitions do not apply to persistent COVID-19 patients. Patients
with persistent COVID-19 require independent clinical assessment.
See next slides for notes
24 February 2022 91Appendix 1 continued: Co and secondary infection definitions with
COVID-19
Notes
† From SARS-CoV-2 first detection date. Not including multiple episodes of SARS-CoV-2 per
patient.
* Additional data check required. (Resistance is not detailed, data for MERS is not currently
available).
^ Definition post- SARS-CoV-2 secondary infection (SARS-CoV-2 is primary infection).This has
been extended from prior 14d secondary infection definition for influenza used by PHE to
account for disparities in testing throughout the 28d period after SARS-CoV-2 detection.
‡ Streptococcus species includes the following groups and species:
24 February 2022 92You can also read