Webinar series: Accelerating energy efficient cooling - The Global Cooling Prize - NET

Page created by Gilbert Goodman
 
CONTINUE READING
Webinar series: Accelerating energy efficient cooling - The Global Cooling Prize - NET
Webinar series: Accelerating energy efficient
cooling – The Global Cooling Prize
   IEA SEAD Webinar, 30 January 2020

IEA 2019. All rights reserved.
Webinar series: Accelerating energy efficient cooling - The Global Cooling Prize - NET
Overview

   • Introduction
        • Vida Rozite, Energy Efficiency Division, IEA

   • The Global Cooling Prize

                        Iain Campbell
                        Senior Fellow,
                        Rocky Mountain Institute

   • Questions and discussion
Webinar series: Accelerating energy efficient cooling - The Global Cooling Prize - NET
How to ask questions

               Attendee Interface
                        Question box

                  Questions in English
Webinar series: Accelerating energy efficient cooling - The Global Cooling Prize - NET
SEAD: Governments working together to save energy
                                 Governments working together to save energy, turning knowledge into
                                 action, and advancing global markets to encompass energy efficient
                                 products

                                                                                       Operating Agent

      collaborating
 19   members

      + partners
                      SEAD is an Initiative under the Clean Energy Ministerial
Webinar series: Accelerating energy efficient cooling - The Global Cooling Prize - NET
Covering a wide range of equipment and appliances…..

          Cooling           Equipment

                                                   Electronics

        Refrigeration        Lighting
Webinar series: Accelerating energy efficient cooling - The Global Cooling Prize - NET
Proposed activities in the near future

                                Knowledge exchange portal

                                     International collaboration events

                                      Webinar series (cooling, digitalization…)

                                     Master classes

                                Tools for policy makers

   More information: vida.rozite@iea.org
Webinar series: Accelerating energy efficient cooling - The Global Cooling Prize - NET
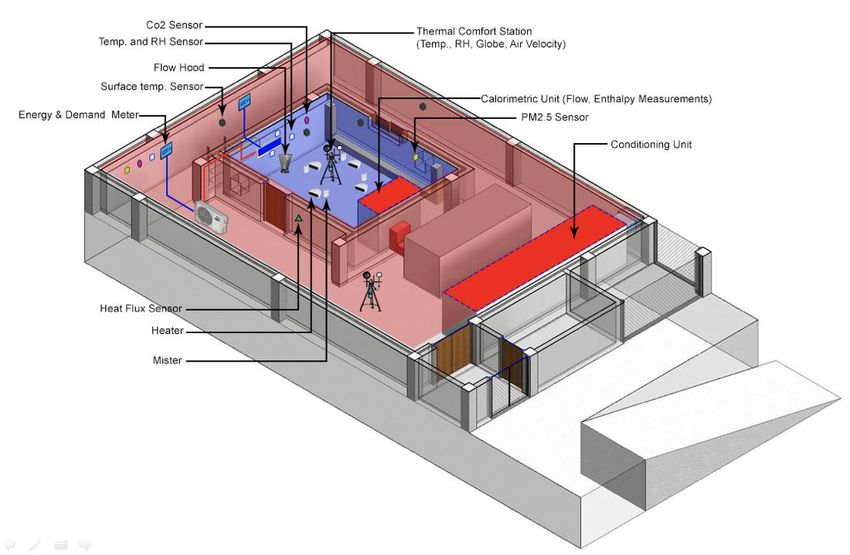
IEA – SEAD Webinar series
  The Global Cooling Prize

              January 30th, 2020
Webinar series: Accelerating energy efficient cooling - The Global Cooling Prize - NET
Agenda
• The Cooling Dilemma

• About the Prize and our journey so far

• An overview of the innovative cooling solutions from the finalists

• Testing and Next steps regarding the Prize

• Scaling and Lessons Learned …. so far

• Questions
Webinar series: Accelerating energy efficient cooling - The Global Cooling Prize - NET
The Cooling Dilemma…..

Increasingly seen as a social need
 but at an environmental cost we
                    cannot afford
Webinar series: Accelerating energy efficient cooling - The Global Cooling Prize - NET
Cooling in the rear-view mirror has not captured much attention ..
looking to the road ahead cooling needs to be on everyone’s agenda
    Person cooling degree                                                                                                               AC ownership in
        days (million)                                                                                                                    households

    4,500,000                                                                                                                                          100%
    4,000,000                                                                                                                                          90%

    3,500,000                                                                                                                                          80%
                                                                                                                                                       70%
    3,000,000
                                                                                                                                                       60%
    2,500,000
                                                                                                                                                       50%
    2,000,000
                                                                                                                                                       40%
    1,500,000
                                                                                                                                                       30%
    1,000,000                                                                                                                                          20%
      500,000                                                                                                                                          10%
           -                                                                                                                                           0%
                  Japan       United       Korea       China     European     Mexico       Brazil    Indonesia     India      Nigeria      Egypt
                              States                              Union

                                  Person cooling degree days - 2016                         AC Household Ownership 2018

                          Source: IEA Report: The Future of Cooling: Opportunities for Energy-efficient Air Conditioning (2018); United Nations, Department of
                          Economic and Social Affairs, Population Division (2017); https://www.degreedays.net/                                                   10
In addition to today’s unmet needs major future demand
                         accelerators are at work

POPULATION                                                                                                                  INCOME GROWTH
GROWTH                                                                                                                      GDP growth for non-
Population is growing                                                                                                       OECD countries will
by over 80 million                                                                                                          exceed 4.5% through
people/year, with 97%                                                                                                       2025, making comfort
of growth in developing                                                                                                     economical for millions
countries                                                                                                                   of new consumers
                                                             Cooling Demand
                                                              will increase by
                                                                almost 4x
                                                                  by 2050
URBANIZATION                                                                                                                A WARMING PLANET
99% of population                                                                                                           Global average
growth is occurring in                                                                                                      temperatures expected
urban environments,                                                                                                         to rise over 2.0oC by
worsening heat island                                                                                                       2100, making summers
effects                                                                                                                     longer and hotter

                          Source: United Nations Sustainable Development Goals (2017), United Nations World Urbanization Prospects (2014),
                          Population Reference Bureau World Population Data Sheet (2012), ExxonMobil Outlook for Energy (2018)
For many people comfort cooling is transitioning from a perceived
     luxury to a vital enabler of health, productivity & prosperity
Present day heat exposure risk                                                                        Projected exposure to deadly heat

 Worldwide, by 2030, extreme heat could lead to a $2 trillion loss in labor
 productivity. India’s economy alone stands to lose $450 billion

“Air conditioning was a most important invention for us, perhaps one of the signal inventions of history. It changed the nature of
civilization by making development possible in the tropics. Without air conditioning you can work only in the cool early-morning hours or at dusk. The
first thing I did upon becoming prime minister was to install air conditioners in buildings where the civil service worked. ” Prime Minister Lee, Singapore 2009

                            Source: Tord Kjellstrom, PhD, Mmeng. Impact of Climate Conditions on Occupational Health and Related Economic Losses. Asia-Pacific Journal of
                            Public Health. January 2015. Climate Change and Labour: Impacts of Heat in the Workplace. International Labor Organization (ILO). April 2016
Entry level cooling is provided by the ubiquitous residential / room air
conditioner (RAC) the number in operation could grow nearly fourfold by 2050
   Expected global stock of room air conditioners, 2016-2050
   RAC units, millions
     Expected global stock of room air conditioners, 2016-2050
     RAC units, millions
     4,500                                                                                                                         PRESENT
     4,000                                                                                                                         Approx. 1.2 billion RAC units in the
     3,500
                                                                                                                                   world; sales growing at 10-15%
                                                                                                                                   per year in developing economies.
     3,000
     2,500
     2,000                                                                                                                         2050
     1,500                                                                                                                         Approx. 4.5 billion RAC units in
     1,000                                                                                                                         operation worldwide. Demand
                                                                                                                                   driven by non-OECD countries.
      500
        -

                                                                                                                                   2100
             China           India                Middle East            United States         Indonesia                           50-fold increase in worldwide RAC
             Japan & Korea   European Union       Mexico                 Brazil                Rest of the world                   energy demand from year 2000.

                               Source: International Energy Agency (IEA) (2018), The Future of Cooling. LBNL Report: Benefits of Leapfrogging to Superefficiency and Low Global
                               Warming Potential Refrigerants in Room Air Conditioning (2015), IPCC, “Fifth Assessment Report”, 2014
Residential AC’s will account for 2/3rds of cooling electricity
    demand and over 10% of global electricity use by 2050
Energy consumption associated with comfort cooling, 1990-2050

     TWh                           Share in buildings          Commercial ACs           Residential ACs                       Share of final energy
 8,000                                                                                                                                         16%

             Equivalent to the
 6,000            electricity                                                                                                                  12%
            consumption of the
            U.S., Germany, and
 4,000      Japan… combined                                                                                                                    8%

 2,000                                                                                                                                         4%

     0                                                                                                                                         0%
     1990     1995    200        2005       2010        2015       2020       2025        2030       2035        2040       2045       2050

                     Source: IEA Report: The Future of Cooling: Opportunities for Energy-efficient Air Conditioning (2018); RMI: Solving the
                     Global Cooling Challenge – How to Counter the Climate Threat from Room Air Conditioners
Air conditioning demand will place significant burdens on grids
       where it drives peak loads and consumers pockets
New Delhi’s grid electricity demand profile, hourly                                 Cooling costs as % of median household income
MW                                                 Winter         Summer
4,000                                                                                  Pakistan                                                                    15%
3,500                                      ~1.6
                                           GW
3,000                                     (40%)                                            India                                                  11%
                  ~2.2
2,500             GW
                 (60%)
2,000                                                                                Indonesia                                   7%
1,500
1,000                                    ACs account for 40-                              Brazil                     4%
                                         60% of peak load in
 500                                     many cities
     0
                                                                                          China             2%
         0   2      4    6   8   10 12 14 16 18 20 22 24
                                    Hours

                             Source: LBNL Report: Benefits of Leapfrogging to Superefficiency and Low Global Warming Potential Refrigerants in Room Air Conditioning
                             (2015), Global Industry Analyst Market Research, Enerdata, UCSUSA , Eco Climate Network Article, NRDC (2015), IECS and Christian Aid Report
                             (2017); IPCC, “Fifth Assessment Report”, 2014
Even projecting trends in buildings codes, equipment efficiency and grid
emissions intensities – annual cooling emissions will almost triple by 2050

                    Global annual emissions from RAC operation           RS - Reference Scenario, or the business-as-
                                                                         usual RAC growth scenario, where the
6.0   Gigatons of                                                        current adopted or committed policies and
      CO2e/year                                                          government commitments will move
                                                                         forward as per established timelines.
5.0

4.0

3.0

2.0

1.0

0.0
        2016        2020   2025    2030    2035    2040    2045   2050
While existing cooling emissions
 & efficiency efforts are critical,
          they are not sufficient
Successful implementation of the Kigali Amendment will significantly
   reduce cooling related emissions – but we need to do more

6.0                        Global annual emissions from RAC operation
      Gigatons of
      CO2e/year                                                                  RS - Reference Scenario, or the business-as-
5.0                                                                              usual RAC growth scenario, where the
                                                                                 current adopted or committed policies and
4.0                                                                              government commitments will move
                                                                                 forward as per established timelines.

3.0
                                                                                 RS-K - Same as the Reference Scenario but
                                                                                 adding in the successful implementation of
2.0
                                                                                 the Kigali phasedown plan.

1.0

0.0
        2016        2020       2025     2030     2035     2040     2045   2050
We are building better buildings, and being smarter in how we operate
               them which helps reduce cooling loads

… but the energy consumption of the equipment serving these
cooling loads remains a massive and critical component
The efficiency opportunity remains largely unaddressed by the
     RAC industry due to lack of market and policy signals

Industry progress toward theoretical max efficiency                            Consolidated industry
                                                 Retail        R&D
                                                                               • RAC segment is subject to a massive market failure -
                                                                                 the focus on lowest upfront cost...and industry
     LED                                                                         responds to market signals
                          67%                             22%
 Lighting
                                                                               • Fewer than 500 AC companies worldwide

 Solar PV       28%            25%                                             Market Analysis
                                                                               • Mass market innovation has largely focused on first cost
                                                                                  and meeting near term market requirements - not
                                                                                  transformational efficiency
     RAC    14%
                                                                               • Emerging & innovative technologies are unable to
                                                                                  achieve scale

                         Source: Greentech Media, “Sunpower Again Holds Record for World’s Most Efficient Rooftop Solar Panel”, 2017; PHYS, “White LEDs with
                         Super-High Luminous Efficacy Could Satisfy All General Lighting Needs”, 2010; Fujitsu, 2017; CLASP, “AC Challenge Program for India”, 2017;
                         LBNL, “Addressing Air Conditioner Energy Efficiency Lost in Translation to Strengthen Policy”, 2018
Do we allow inertia to define us or
    do we do what humankind has
  done through the ages and look
for innovation to move us forward

  A prize has the potential to spur
  climate-friendly innovation and
 address the market failure in the
                   cooling industry
The Global Cooling Prize Criteria has been developed to ensure that the
 next generation room air conditioners will deliver effective cooling at a
                 dramatically lower environmental cost
                                                                                            Primary criteria used to             Supplementary criteria used to
                                                                                            determine final award                shortlist finalists

CLIMATE                                                                            AFFORDABILITY
One-fifth of the life-time climate impact (electricity and                         At manufacturing scale of 100,000 units, costs no more than twice
refrigerant) of the baseline AC unit                                               the cost of the baseline AC unit to consumers

POWER                                                                              EMISSIONS
Consumes less than 700W from the grid at rated cooling                             Zero onsite emissions from any captive power or
capacity or during test period                                                     heat source

SCALABILITY                                                                        OPERATION
Usable in existing homes, no “designed in” solution; less than                     Designed to have 1.5 TR cooling capacity at standard
2x volumetric size of the baseline unit                                            outdoor conditions and Maintains below 27oC DBT
                                                                                   and 60% RH indoors for the duration of test period

WATER (if any is used)                                  REFRIGERANTS (if any is used)                                  MATERIALS
Consumes an yearly average of 14                        Zero ODP, lower toxicity, and compliance                       Minimal usage of high embodied
liters/day with daily maximum limit                     with safety standards                                          carbon or rare earth materials
of 28 liters
The Prize is a high-profile competition with a $3M purse supported by a
    global coalition to spur innovation and catalyze future demand
The potential impact of a super-
efficient, climate-friendly cooling
      solution would be profound

... for people, the AC industry, the
      power sector, and the planet
Globally scaling of the 5X solution will reduce RAC associated global
    annual emissions in year 2050 to a level that is manageable
                           Global annual emissions from RAC operation
                                                                                                                                  RS - Reference Scenario, or the business-as-
6.0   Gigatons of                                                                                                                 usual RAC growth scenario, where the
      CO2e/year                                                                                                                   current adopted or committed policies and
                                                                                                                                  government commitments will move
5.0                                                                                                                               forward as per established timelines.

4.0                                                                                                                               RS-K - Same as the Reference Scenario but
                                                                                                                                  adding in the successful implementation of
                                                                                                                                  the Kigali phasedown plan.
3.0

2.0                                                                                                                               5X Scenario - Assumes the adoption of
                                                                                                                                  technology solution that will have at least
                                                                                                                 65%
1.0                                                                                                                               five-times (5X) less climate impact than
                                                                                                                                  today’s standard RAC units

0.0
        2016        2020         2025           2030          2035           2040           2045          2050

                      Key assumptions:
                        - RMI analysis assumes an adoption curve for the 5X solution as follows: market adoption starts in 2022 with a 5% share; by year 2030 it
                             gains an 80% share of the annual sales, and by year 2040 it achieves an almost 100% share of the annual sales.
                        - We assume that building envelope improvements (thermal insulation driven by building codes) have the potential to achieve a 7.5%
                             reduction in cooling demand in 2050 in developed countries. For developing countries, we assume that a 15% reduction in cooling demand
                             can be achieved in 2050 as a significant portion of the building stock is still to be built
Globally, this may be one of the single biggest demand side
                       actions we can take to mitigate climate change

        75+ GT                                                                                            o
                                                                                                       0.5 C
                     CO2eq emissions avoided                                                   Global warming mitigation by 2100
                         through 2050

                        Avoid over 2,000 GW of new generation capacity globally
EQUIVALENT IMPACTS

                        Avoid up to 5,400 TWh of electricity generation, equivalent to electricity consumption of US,
                        Japan, and Germany today

                        Make all 28 countries in the European Union carbon neutral tomorrow

                                Source: CLASP, “AC Challenge Program for India”, 2017; LBNL, ”Benefits of Leapfrogging to Super efficiency and Low Global
                                Warming Potential Refrigerants in Room Air Conditioning”, 2015; “Statistics”, IEA (2018)
Where we are, the Finalists
Our Journey and where we are
Outreach and Media

Over 70,000 users on the prize website from 195 countries . The Prize was featured in over 1280
global publications in news outlets in over 95 countries and recorded over 2 billion
impressions . The Prize has over 14000 followers on social media with 1.8 million+ impressions.

Global Application Submissions

 2,100+                      445
 TEAMS REGISTERED for the   completed the
 competition from 95        INTENT TO APPLY FORM
 countries

 13
                            from
                                   3  1
                                   COUNTRIES
 completed the

 9
 DETIALED TECHNICAL
 APPLICATION
                                   around the world

                                                                                                  28
8 Finalist teams were selected by the Technical Review Committee

                                             Key highlight is the
                                             diversity offered by the
                                             selected finalists
                                             •   Diversity of technology
                                             •   Diversity of geography
                                             •   Diversity of entity
                                                 profile

                                                                           29
Selected 8 breakthrough cooling solutions combine multiple
                 innovations to meet the prize criteria
                                                                              Smart controls that
Climate friendly                                     Recover and reuse                                 Integrated solar PV
                        Independent sensible                                    optimizes hybrid
refrigerants or                                     condensate to reduce                               panel on condenser
                          and latent cooling                                 operation mode based
  alternatives                                       water consumption                                         unit
                                                                              on sensed condition

R152a                                                  Direct evaporative       Optimize multiple        Reduce the grid
                           Desiccant materials
                                                       cooling at               evaporator or            electricity
(GWP
Prize Timeline and Key Milestones

                     Detailed Technical Application                                        Testing & Evaluation of
 Prize Launch                                         Finalist Award Ceremony
                               Deadline                                                          Prototypes

                                          August – October                     November 2019 –
                June 30, 2019                                                     April 2020                       November 2020
                                               2019

November 2018              August 31, 2019                   November 15,                        May – September
                                                                2019                                  2020

                Intent to Apply              Applications                   Prototype Development                   Final Award
                   Deadline                   Evaluated                                                              Ceremony
Testing and selecting a
             winner(s)
Finalists are required to ship two prototypes to India by April
                     15, 2020 for testing

    Finalists eligible to   Finalists undertake         Finalists ship two
    receive an award of     prototype development and   working prototypes to
    US $200,000 each        production between          India by April 15,
                            November 2019 and           2020 for testing.
                            April 2020
Prototypes received from finalists will undergo Testing by three
              different methods that complement each other

                                                          Relevance to
                                                                                                      Expected
Test Method     Key Objective           Control           Energy Use     Repeatability   Monitoring
                                                                                                       Noise
                                                           Estimate

                                  Temp / RH conditions,
                                     Internal Loads
Lab-simulated    Controlled
                                       (dynamic),            High            High        Extensive    Minimal
     test       Environment
                                     External Loads
                                       (dynamic)
                Replicate real-
                world scenario       Internal Loads
  Field Test                                               Moderate          Low         Moderate       High
                 with all the          (dynamic)
                  variables

                Alignment with
                                  Temp / RH conditions                                     As per
   ISEER           reference                                  Low            High                     Minimal
                                         (static)                                         Standard
                  Standards
Lab simulated year-round
        performance test
One prototype from each finalist will be tested at CEPT University’s
                     state-of-the-art facility

                               • Designed to assess energy use, demand, and water
                                 use for a wide variety of air conditioning system
                                 technologies - traditional and low energy cooling
                                 systems

                               • Design comprises of External and Internal rooms
                                 (Room within a room) to simulate energy use in
                                 buildings

                               • External Chamber maintains a wide range of daily
                                 outdoor condition profiles (5 to 45 °C, 20 to 80%
                                 Relative Humidity)

                               • Internal Chamber maintains accurate indoor
                                 conditions (15 to 35 °C, 10 to 90% Relative Humidity)
Testing the prototypes for 10 continuous days under varying
      outdoor conditions to estimate the full-year performance
   Selected 10 typical daily profiles represent all climate zones of India under which a cooling
    technology is expected to operate.
                                                                                                 Extreme
            Warm and        Warm and           Hot and         Hot and          Extreme
                                                                                                hot and dry
             Dry day        Humid day          Dry day        Humid day        humid day
                                                                                                    day

                                Warm and Dry days

                        Dry bulb temperature             Relative humidity
10 selected days for the lab test cont…
Warm and humid days                          Hot and humid days

  Hot and dry days               Extreme humid day       Extreme hot and dry day

          Dry bulb temperature       Relative humidity
Protocol to be followed for lab test
•   Prototypes to be installed and tested for up to                        Temp and RH
    12 days in the simulated lab environment.                                 sensor
                                                                                                       Thermal comfort sensor
                                                              Surface temp

•   Prototypes to be operated for 10 days in
                                                             sensor and flow
                                                                  hood                                                Calorimetric unit
    continuous operation mode i.e. all 24 hours,                                                                         PM 2.5 sensor
                                                       Energy demand
    excluding time for stabilization and transition.       meter
                                                                                                                                 Conditioning unit

•   External (envelope heat gains and infiltration)
    and internal gains (lighting and occupants) will
    be simulated in the chamber.
                                                                Heat flux sensor
•   Performance parameters of the prototypes to                   Heater
    be recorded at every 15-minute interval.
                                                                           Mister
     o   Grid electricity consumption, Power
         demand, Water usage etc.
     o   Indoor conditions of the internal chamber -          Internet

         below 27°C DBT and 60% RH at all times.

                                                                                           Building Energy
                                                                                         Management system

                                                           Disclaimer – The layout and exact location of any equipment or any instrument may be different
                                                           in the actual lab set-up.
Weighting factors are assigned to each of the 10 test days to
      evaluate the year-round performance of the prototypes
•     Weighting factors represent the fraction of days in a year in New Delhi, India that are similar to each of the
      selected day for testing

                         Sequence of   Weighting                      Example calculation - Using weighting factor to determine annual performance
       Day Type
                            days        factor*

Warm and Dry                Day 1         8%                                                    Measured cooling
                                                                                                                                              Annualized energy
Warm and Dry                Day 2        12%                               Operating hours          electricity         Weighting
                                                           Test day                                                                             consumption
                                                                             [hours/day]          consumption            factor*
Warm and Humid              Day 3         5%                                                                                                     [kWh/year]
                                                                                                   [kWh/day]
Warm and Humid              Day 4        18%            Day 10 -
                                                        Extreme Hot                24                    25                 2%
                                                                                                                                                   182.5
Hot and Dry                 Day 5         1%                                                                                                   [25* (2%*365)]
                                                        and Dry
Hot and Dry                 Day 6        10%
Hot and Humid               Day 7         4%
Hot and Humid               Day 8         6%
                                                     Sum of the weighting factors: 72% after eliminating the days when the prototype is not
Warm and Extreme Humid      Day 9         6%         expected to operate in New Delhi, India

Extreme Hot and Dry         Day 10        2%
Scaling Interventions
within the scope of the
   Global Cooling Prize
Catalyzing Scaling Interventions

• Demonstration of what is possible
• Publication of findings from prize criteria and testing protocols in comparison to equipment
  standards and rating systems in this sector – extracting learnings to inform future policy.
• Establishment of investor ‘marketplace’ to connect those able to commercialize and invest
  with innovators interested in garnering support
• Stimulate bulk procurement and AMC programs from those end users naturally motivated by
  lower lifecycle cost
• Stimulate the development of incentive and pay as you save programs to help overcome first
  cost barriers to sustainable cooling equipment
Lessons Learned …..so far
Lessons …. so far
• The power of amplification – A global coalition

• Specific to the prize process
      o Prize as a change model – where market failure exists
      o Establish pure outcome-based criteria, do not embed technology bias.
      o These are hard to solve problems, narrowing the focus to a single end use helps secure
            engagement and reduces subjectivity
        o   If trying to solve a global problem running a national prize is sub-optimal, global problems
            deserve global prizes
        o   Be sure to engage Industry and Industry associations

• The answers are out there, we just need to engage and ask the right questions – todays
   standards and rating systems may not be asking the right questions ?
Thank You
Visit - www.globalcoolingprize.org
Email - info@globalcoolingprize.org
How to ask questions

                   Attendee Interface
                             Question box

                       Questions in English
You can also read