Visual Biofeedback Tool for Quantitative Pressure Monitoring in Lower-Limb Prosthetic Sockets
←
→
Page content transcription
If your browser does not render page correctly, please read the page content below

Preprints (www.preprints.org) | NOT PEER-REVIEWED | Posted: 6 October 2021

     Article

     Visual Biofeedback Tool for Quantitative Pressure Monitoring
     in Lower-Limb Prosthetic Sockets
     Shruti Turner 1,2*, Shivali Jain3, Akhil Patel3, Matthew O. Hopkins1,2 and Alison H. McGregor 1,2

                                       1 Centre for Blast Injury Studies, Imperial College London
                                       2 Sackler Musculoskeletal Laboratory, Department of Surgery and Cancer, Imperial College London
                                       3 Faculty of Medicine, Imperial College London

                                       * Correspondence: Dr Shruti Turner s.turner17@imperial.ac.uk;

                                       Abstract: Obtaining a good socket fit is an iterative process dependent on the skill and experience
                                       of the prosthetist creating it, and requiring individualisation based on the size and shape. There is
                                       no standard measurement system used to aid prosthetic socket creation, despite the severe impacts
                                       on physical health and quality of life if one is ill-fitting. Pressure sensors embedded in a prosthetic
                                       socket were used to collect data at the socket-residuum interface. To choose an interpolation
                                       method, a 2D grid was used, with previously collected walking test pressure data, to simplify the
                                       sensor array with a border for extrapolation. Four multivariable interpolation methods were evalu-
                                       ated to create a colour map of the pressure data. Radial Basis Function interpolation was chosen as
                                       it produced a clear image with a graduated interpolation between data points and was used to create
                                       a colour map across the surface of a 3D prosthetic socket model. For the model to be accessible to
                                       clinical audiences, a desktop application was created using PyQt to view the model. The created
                                       application allowed for connection to the sensors via Bluetooth, with the pressure data updating the
                                       colour map on the 3D model in real-time. The created application shows the potential for a clinical
                                       product, however further development informed by feedback from rehabilitation clinicians and
                                       prosthesis users is required

                                       Keywords: prosthetics; prosthetic socket; prosthetic socket fitting; biofeedback; rehabilitation; am-
                                       putation

                                       1. Introduction
                                             The prosthetic socket is the point of load transfer between the body and the prosthe-
                                       sis and is a complex interface [1,2]. Obtaining a good socket fit is an iterative process de-
                                       pendent on the skill and experience of the prosthetist creating it, requiring individual ad-
                                       aptation based on the size and shape of each user’s residual limb [3,4]. The socket is not
                                       an ideal environment for the residual limb due to the load distribution over anatomy and
                                       tissues that have not evolved for this purpose. The bony prominences and skin on the
                                       residual limb are subjected to a hot, moist environment with greater loading conditions
                                       compared to pre-amputation [5]. Therefore, the residual limb is highly susceptible to com-
                                       plications – including skin tissue breakdown – that can lead to deep tissue injury and the
                                       formation of pressure ulcers [6-9]. A critical factor in the development of pressure sores is
                                       the presence of shear in the soft tissues, often present due to movement of the residual
                                       limb.10 Pressure sores negatively affect the quality of life of 62% of prosthesis users, fre-
                                       quently prohibiting prosthetic use [6,8,11,12].
                                             There is no standard measurement system used to aid prosthetic socket creation, de-
                                       spite the severe impacts on physical health and quality of life if one is ill-fitting. The
                                       knowledge to solve patient-reported problems or adapt the socket for different needs is
                                       gained only with years of experience [3,4]. The process of fitting a socket is made more
                                       difficult for those who have lost sensation in their residual limbs due to nerve damage,
                                       burns or skin grafting. These individuals cannot provide feedback to prosthetists if the
                                       socket is uncomfortable due to ill-fit or high pressure.

               © 2021 by the author(s). Distributed under a Creative Commons CC BY license.
Preprints (www.preprints.org) | NOT PEER-REVIEWED | Posted: 6 October 2021

                                       Published literature shows that effective biofeedback methods have been used with
                                 people with lower-limb amputations alongside conventional techniques for monitoring
                                 and assessing loading, motion symmetry and improving gait [13,14]. Biofeedback in these
                                 settings is most commonly presented visually, with auditory and haptic methods (deliv-
                                 ering feedback via a method of touch e.g. using sub-threshold electrical stimulation on the
                                 skin to signal change in environment) also popular techniques [13]. Although biofeedback
                                 is effective in both clinical and non-clinical settings, it is particularly beneficial during the
                                 early stages of rehabilitation [13]. Using biofeedback technologies is generally received
                                 well by trial participants and increases motivation to complete sustained rehabilitation
                                 [15,16], though there have been usability issues reported within the elderly population
                                 [13].
                                       Methods to measure the environment inside the prosthetic socket have been devel-
                                 oped and tested for several decades. Due to their associated medical implications, pres-
                                 sure and shear are of particular interest [17–21]. Few commercial technologies exist and
                                 they have limitations similar to devices used in research studies, generally including
                                 high costs [22–24] Research studies either use commercial technologies [17,18] or focus on
                                 the development of new sensors [19–21]. It is more common for commercial products to
                                 also focus on the user interface for display and interpretation of the collected data. How-
                                 ever, the user interfaces only work with their associated sensors, can be platform and de-
                                 vice specific, and often require an internet connection. The research technologies fre-
                                 quently require specialist technical knowledge and licensed software (e.g. MatLab) [19–
                                 21], making them less suitable for a clinical environment.
                                       The research team has created an embedded network of up to 144 pressure sensors,
                                 arranged in 12 strips of 12 sensors, connected to a control board with an inertial measure-
                                 ment unit (tri-axis accelerometer, gyroscope and magnetometer) to detect and measure
                                 movement [25]. The hardware transmits the data via Bluetooth to a computer or mobile
                                 device for analysis and post-processing. The data is saved to a file, in comma separated
                                 variable (CSV) format, at a sampling frequency of 200Hz.
                                       The aim of this study was to create a proof-of-concept real-time biofeedback tool to
                                 display the pressure measurements from the sensors created by Hopkins et al. for clini-
                                 cians [25]. The quantitative information is intended to guide the prosthetists with their
                                 fitting by providing additional information that previously they would not have had, to
                                 support them as they fit sockets.

                                 2. Results
                                       Multiple multivariate interpolation methods for unstructured data were run on the
                                 2D model of the socket [Figure 1]. Radial Basis Function displayed the smoothest gradu-
                                 ations between data points and was chosen as the optimal interpolation method. Nearest
                                 Neighbour (NN) produced a pixelated image that would not be clinically useful and was
                                 excluded from further testing. Radial Basis Function (RBF), Clough Toucher (CT) and Lin-
                                 ear (N Dimension) (LND) all produced images with smooth gradations between data
                                 points, however Clough Tocher and Linear (N Dimension) were unable to extrapolate past
                                 the boundaries of the sensor data. Extrapolation is necessary to allow clinicians to visual-
                                 ise the pressure distribution across the whole socket; not only the area enclosed by sensors
                                 as they will not necessarily be located at the socket boundaries. The pressure values are
                                 represented using a smooth colour gradient from the lowest in green, through blue, and
                                 the highest in red. The colour gradient can be changed if desired.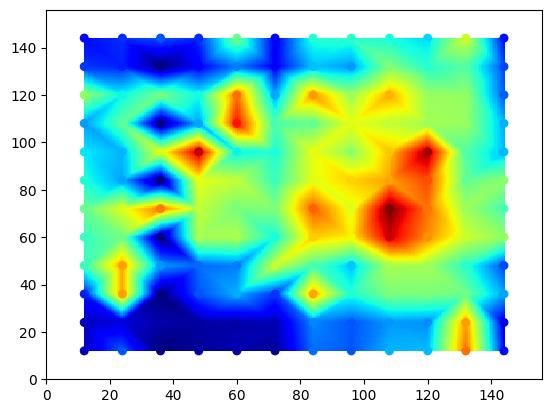
Preprints (www.preprints.org) | NOT PEER-REVIEWED | Posted: 6 October 2021

                                     a)                                                              b)

                                     c)                                                              d)
          Figure 1. 2D output of pressure sensor data with a) Radial Basis Function b) Clough Tocher c) Nearest Neighbour d) Linear
          Interpolation from a single time point.

                                          Whilst the pressure distribution changes at the different time points, the methods of
                                     each interpolation did not. All methods created images with similar characteristics, show-
                                     ing the timepoint in the gait cycle did not impact the appropriateness of the interpolation
                                     methods.
                                          A static image of the 3D model with a colour map using RBF interpolation was cre-
                                     ated [Figure 2] to show an estimated pressure distribution across the entire prosthetic
                                     socket.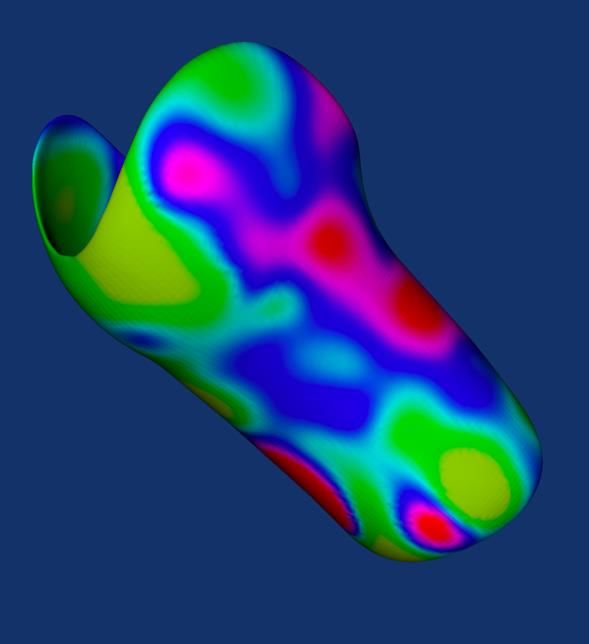
Preprints (www.preprints.org) | NOT PEER-REVIEWED | Posted: 6 October 2021

          Figure 2. Radial Basis Function Interpolation applied to a 3D computational model of a prosthetic socket using data.

                                           The desktop application was created with a simple user-flow [Figure 3] to demon-
                                     strate the possibility of using 3D visualisation in real-time as a visual biofeedback tool for
                                     clinicians. A Graphical User Interface was created with two screens and two buttons to
                                     navigate between the screens. Navigating to the second screen initiates the connection to
                                     the Bluetooth sensors via a dialog box with an “OK” action button, which triggers the host
                                     device to scan for the sensors. The main window is disabled whilst the application is scan-
                                     ning for the sensors, and another dialogue box is shown to confirm that the sensors are
                                     connected to the host device.

                                                  Figure 3. User Flow of Biofeedback Tool.

                                          Once sensors are connected and the test session started using a “Start/Stop” button
                                     in the main window, a stream of data is received by the application and the pressure val-
                                     ues are extracted to feed the function that creates the pressure map on the 3D model. The
                                     window can be resized, and the model can be reorientated by clicking and dragging.
                                     Clicking the ‘Start/Stop” button breaks the Bluetooth connection with the sensors.
Preprints (www.preprints.org) | NOT PEER-REVIEWED | Posted: 6 October 2021
3. Discussion
A proof-of-concept real-time biofeedback tool to display the pressure measurements
from the sensors created by Hopkins et al. [25] for clinicians was created. An RBF interpo-
lation method was used to create a colour map of pressure across the surface of a 3D pros-
thetic socket model using measured values from 144 sensors embedded in a real socket.
For the sensor hardware to be useful in a clinical environment, the information rele-
vant to clinicians and people with amputation(s) must be displayed in an easy-to-under-
stand manner, requiring little interpretation or training and no additional technical
knowledge. Clinicians are busy and have a short timeframe in which to see and treat pa-
tients; the technology must not be a burden for them to use to ensure adoption into clinical
practice.
Data visualisation was kept in the simplest form, relaying pressure information: no
analysis or post-processing was done on the data. Further analysis adds complexity and
time, which is not always available or possible in the clinical environment when treating
patients. After initial consultation with the target users regarding the clinical application,
further functionality for data analysis, such as reporting numerical metrics and compari-
sons can be implemented.
Choices for programming language were limited due to the complexity of the math-
ematics required in a short space of time to create a colour map that updates in real-time.
Python is a versatile language, particularly useful for complex mathematics, however,
desktop applications are not typically written in Python due to the way the code is dis-
tributed and run. It is possible to re-write the application and model in C++ using the VTK
and PyQT frameworks, which may yield an application which is more efficient to run,
particularly with added functionality in later versions. For the proof-of-concept, however,
Python is sufficient to demonstrate the possibility of creating such a biofeedback tool.
The interpolation methods evaluated were purely the built-in methods to the func-
tions used and chosen purely based on subjective observation. From the four interpolation
methods assessed, only one was suitable as it provided smooth colour gradients between
values and extrapolated data. It would be prudent to evaluate further methods of inter-
polation which may be less computationally expensive.
Commercial technologies are available that provide live visual biofeedback of pres-
sure within the socket. Novel.de has created Pliance sensors that can measure the pressure
and load distribution of any object on a 2D grid, similar to the initial testing of interpola-
tion methods in the current study [22] The sensors, however, do not cover the entire sur-
face of the socket, only a target area. The sensor network must be wired to a Windows
computer via a control unit for data transfer to enable visualisation.
F-Socket, created by Tekscan [24], is well used in research studies [26–32]. The sensors
are connected via USB to a computer with a range of 100m [24]. The associated software
provides information about the peak pressures in the socket, centre of force and force-
time graphs [24]. The software displays the data in both 2D and 3D data and allows for
side-by-side comparisons of different test sessions, either giving information about the
socket as a whole or focussing on regions of interest [24]. Both graphical data and movie
files can be imported and exported into the software [24].
The AdaptTech Insight system [23] is the most similar to the tool created in this pa-
per, however, it only shows a circular interpolation around each sensor rather than a col-
our map across the entire socket. Generally only 4 strips of 8 sensors are used for testing
[33], therefore little of the socket area is covered. The AdaptTech software is only available
for iOS devices (typically iPad), which receives the data and displays it in real time as well
as saving it for future access (acting as a patient record system) and requires wireless in-
ternet connection for use.
The existing commercial technologies are associated with high costs and have limi-
tations for their usage, e.g. requiring internet connection or a device with a specific oper-
ating system. The application created in this study can be used on any laptop or desktop
computer with a Bluetooth connection. The platform-agnostic and internet-independentPreprints (www.preprints.org) | NOT PEER-REVIEWED | Posted: 6 October 2021
nature of the application allows this tool to be accessible to a broader audience, especially
in low-cost and remote settings as additional costs to meet the application requirements
are not incurred. If Bluetooth connectivity is not built in, a dongle can be used instead.
In addition, an advantage of this new tool is that it can be used with different pressure
sensor technologies, with only minor changes to the code. The proof-of-concept tool has
been created to complement the sensors created by Hopkins et al. [25], however, it can be
adapted to allow easy connection to different hardware. The Python script required to
receive Bluetooth data from the hardware needs to be individual for different sensors.
Whilst data communication is not standard due to the differences in the way developers
choose to structure the data transmitted, the Bluetooth protocols remain the same. To fa-
cilitate easy change, only one script in the code needs to be changed.
A proof-of-concept application has been created which demonstrates the technolog-
ical feasibility of creating an application to display real-time pressure information across
the surface of a prosthetic socket. However, the tool must be shared with prosthetists,
physiotherapists and prosthesis users to understand the clinical utility of the tool. Such
consultation is vital before progressing with development of the application, to ensure it
meets the needs of the target users and provides maximum value.
Before the application can be used to receive personal data via Bluetooth, it is essen-
tial to build in the required data security characteristics of the application to protect the
data. It would also be beneficial to add in functionality to allow users to select the sensors
they would like to connect to after scanning the surrounding area. Both the functionality
to choose the type of sensors being used (e.g. brand) and also, specifically which sensors
to connect to (instead of defining one address in the code).
4. Materials and Methods
Given the limitations of existing products, it was decided the biofeedback tool must
function cross-platform. The software needed to be compatible with different pressure
sensor technologies, with only minor technical adjustments. The proof-of-concept tool has
been created to complement the sensors created by Hopkins et al. [25] The tool has been
created to be easy to use, requiring no additional training, technical knowledge, or use of
the internet. The pressure data from the sensors should be updated in real-time as the
application receives them to allow for the data to be used immediately for clinical decision
making. Immediate use of the data means the tool can be used in consultations, giving
instant feedback to inform clinical decision making.
Previously collected pressure data of a walking test in a CSV file was used to evaluate
different interpolation methods. Due to the application being created in a sandbox envi-
ronment (isolated from any external network connection e.g. Bluetooth, internet) when
using personal data, there was no need to focus on data security aspects for the proof-of-
concept application.
To choose an appropriate interpolation method, a 2D 156 x 156 grid was used to in-
clude the 12 x 12 sensor array (evenly distributed) and a border for extrapolation. The grid
was created using built-in functions from the numpy [34] library in Python and visualised
using matplotlib [35]. Sensor data collected through participant testing and saved into
CSV files were imported into Python for use. The grid was populated with data from five
evenly spaced time points spanning the length of the participant’s gait cycle, each 250
milliseconds apart. The time points were chosen to determine whether the interpolation
methods were appropriate for different pressure distributions across the gait cycle.
Four multivariable interpolation methods were evaluated, each compatible with un-
structured data and therefore appropriate for both 2D and 3D data: Clough Tocher (CT),36
Radial Basis Function (RBF) [37], Nearest Neighbour [38] (NN) and Linear N Dimension
(LND) [39] The most appropriate interpolation method was identified based on observa-
tion of smooth gradations between pressure values and the ability to extrapolate, as well
as interpolate, data. The chosen interpolation method from the 2D testing was taken for-
ward for testing on a 3D socket model.Preprints (www.preprints.org) | NOT PEER-REVIEWED | Posted: 6 October 2021
A computational model of a prosthetic socket was obtained by laser scanning a cast-
ing mould of a transtibial prosthetic socket. The model was cleaned up, including fixing
of any holes and artifacts produced during the scanning process, using Geomagic Wrap
[40], 3-Matic was used to add thickness to the model, simulating that of a socket. The 144
vertices representing the sensors were picked out manually using Paraview (Various Lo-
cations, USA). For the proof-of-concept, the real-life sensor locations were approximated
on the model: evenly distributed in twelve lines of twelve sensors to represent the sensor
strips.
The 3D model was imported into Python and the sensor locations and values as-
signed to the relevant vertices. The Visualisation Toolkit library was used to create a col-
our map with the chosen Radial Basis Function interpolation from the 2D testing between
the vertices assigned sensor values.
For the model to be accessible to a clinical audience, it was decided that a desktop
application was required for them to view the model. The creation of the application
would also allow connection to the Bluetooth sensors, with the data being used to update
the colour map on the 3D model as data is received in real-time.
PyQt was chosen to create the desktop application’s Graphical User Interface (GUI)
and additional functionality as it allows for the application to run on all major operating
systems. For the application to work, the host device requires a Bluetooth connection.
PyQt’s Bluetooth module was utilised to implement the relevant Bluetooth functionality.
The sensors’ Bluetooth address was specified in the code for simplicity, so the host device
looks for and connects to only the specified sensors in this proof-of-concept application.
5. Conclusions
Visual biofeedback has been shown to have a positive effect on rehabilitation when
it complements traditional methods. The proof-of-concept tool created provides live in-
formation about the pressure distribution inside a prosthetic socket when linked to an
appropriate sensor network. A desktop application was created that can run on any of the
standard operating systems; has no requirement for internet connection; can be connected
to any sensor network with minor changes to the code; and has been designed to be easy
to use without the requirement for technical knowledge or training.
Further improvements and testing should be completed; however, the current appli-
cation shows the potential of a clinical product. End-user feedback is vital for the devel-
opment of both the design and functionality of this application. Feedback from rehabili-
tation clinicians in the clinical environment, the end-users in this case, should be used to
guide further improvements.
Author Contributions: Conceptualization, Shruti Turner and Alison McGregor; Data curation, Mat-
thew Hopkins; Formal analysis, Shruti Turner; Investigation, Shruti Turner, Shivali Jain and Akhil
Patel; Methodology, Shruti Turner, Shivali Jain and Akhil Patel; Software, Shruti Turner; Supervi-
sion, Matthew Hopkins and Alison McGregor; Validation, Shruti Turner, Matthew Hopkins and
Alison McGregor; Visualization, Shruti Turner, Shivali Jain and Akhil Patel; Writing – original draft,
Shruti Turner, Shivali Jain and Akhil Patel; Writing – review & editing, Shruti Turner, Shivali Jain,
Akhil Patel, Matthew Hopkins and Alison McGregor. All authors have read and agreed to the pub-
lished version of the manuscript
Funding: This work was conducted under the auspices of the Royal British Legion Centre for Blast
Injury Studies at Imperial College London. The authors would like to acknowledge the financial
support of the Royal British Legion. No grant number is given.
Conflicts of Interest: The authors declare no conflict of interest.
References
1. Safari MR, Meier MR. Systematic review of effects of current transtibial prosthetic socket designs—Part 1: Qualitative outcomes.
J Rehabil Res Dev. 2015;52(5):491-508. doi:10.1682/JRRD.2014.08.0183Preprints (www.preprints.org) | NOT PEER-REVIEWED | Posted: 6 October 2021
2. Mak AFT, Zhang M, Boone DA. State-of-the-art research in lower-limb prosthetic biomechanics-socket interface: A review. J
Rehabil Res Dev. 2001;38(2):161-173.
3. Haggstrom EE, Hansson E, Hagberg K. Comparison of prosthetic costs and service between osseointegrated and conventional
suspended transfemoral prostheses. Prosthet Orthot Int. 2013;37(2):152-160. doi:10.1177/0309364612454160
4. Pezzin LE, Dillingham TR, MacKenzie EJ, Ephraim P, Rossbach P. Use and satisfaction with prosthetic limb devices and related
services. Arch Phys Med Rehabil. 2004;85(5):723-729. doi:10.1016/j.apmr.2003.06.002
5. Ghoseiri K, Safari MR. Prevalence of heat and perspiration discomfort inside prostheses: Literature review. J Rehabil Res Dev.
2014;51(6):855-867. doi:10.1682/JRRD.2013.06.0133
6. Hagberg K, Branemark R. Consequences of non-vascular trans-femoral amputation: a survey of quality of life, prosthetic use
and problems. Prosthet Orthot Int. 2001;25(3):186-194. doi:10.1080/03093640108726601
7. Huff EA, Ledoux WR, Berge JS, Klute GK. Measuring Residual Limb Skin Temperatures at the Skin-Prosthesis Interface. J Pros-
thetics Orthot. 2008;20(4):170-174. doi:10.1007/s11999-014-3741-4
8. Stekelenburg A, Gawlitta D, Bader DL, Oomens CW. Deep tissue injury: how deep is our understanding? Arch Phys Med
Rehabil. 2008;89(7):1410-1413. doi:10.1016/j.apmr.2008.01.012
9. Webber CM, Davis BL. Design of a novel prosthetic socket: assessment of the thermal performance. J Biomech. 2015;48(7):1294-
1299. doi:10.1016/j.jbiomech.2015.02.048
10. Bouten C V, Oomens CW, Baaijens FP, Bader DL. The etiology of pressure ulcers: skin deep or muscle bound? Arch Phys Med
Rehabil. 2003;84(4):616-619. doi:10.1053/apmr.2003.50038
11. Pirouzi G, Abu Osman NA, Eshraghi A, Ali S, Gholizadeh H, Wan Abas WA. Review of the socket design and interface pressure
measurement for transtibial prosthesis. ScientificWorldJournal. 2014;2014:849073. doi:10.1155/2014/849073
12. Portnoy S, van Haare J, Geers RP, et al. Real-time subject-specific analyses of dynamic internal tissue loads in the residual limb
of transtibial amputees. Med Eng Phys. 2010;32(4):312-323. doi:10.1016/j.medengphy.2009.12.006
13. Escamilla-Nunez R, Michelini A, Andrysek J. Biofeedback systems for gait rehabilitation of individuals with lower-limb ampu-
tation: A systematic review. Sensors (Switzerland). 2020;20(6). doi:10.3390/s20061628
14. Migaou Miled H, Bel Haj Youssef I, Boudoukhane S, et al. Interest of visual biofeedback rehabilitation on balance in the lower
limb amputee. Ann Phys Rehabil Med. 2017;60:e53. doi:10.1016/j.rehab.2017.07.200
15. Quiñones I, Vela E, Pérez AI, Alessi A, Urrusti JL, Cepeda D. Biofeedback system for transfemoral amputees rehabilitation. 2009
Pan Am Heal Care Exch - PAHCE 2009. 2009:148-152. doi:10.1109/PAHCE.2009.5158386
16. Tamburella F, Moreno JC, Herrera Valenzuela DS, et al. Influences of the biofeedback content on robotic post-stroke gait reha-
bilitation: Electromyographic vs joint torque biofeedback. J Neuroeng Rehabil. 2019;16(1):1-17. doi:10.1186/s12984-019-0558-0
17. Dou P, Jia X, Suo S, Wang R, Zhang M. Pressure distribution at the stump/socket interface in transtibial amputees during walk-
ing on stairs, slope and non-flat road. Clin Biomech (Bristol, Avon). 2006;21(10):1067-1073. doi:10.1016/j.clinbiomech.2006.06.004
18. Dakhil N, Evin M, Llari M, et al. Is skin pressure a relevant factor for socket assessment in patients with lower limb amputation?
Technol Heal Care. 2019. doi:10.3233/THC-191637
19. Sanders JE, Lam D, Dralle AJ, Okumura R. Interface pressures and shear stresses at thirteen socket sites on two persons with
transtibial amputation. J Rehabil Res Dev. 1997;34(1):19-43.
20. Carrigan W, Nothnagle C, Savant P, Gao F, Wijesundara MBJ. Pneumatic actuator inserts for interface pressure mapping and
fit improvement in lower extremity prosthetics. Proc IEEE RAS EMBS Int Conf Biomed Robot Biomechatronics. 2016;2016-
July:574-579. doi:10.1109/BIOROB.2016.7523687
21. Laszczak P, McGrath M, Tang J, et al. A pressure and shear sensor system for stress measurement at lower limb residuum/socket
interface. Med Eng Phys. 2016. doi:10.1016/j.medengphy.2016.04.007
22. novel. pliance sensors. https://www.novel.de/wp-content/uploads/2019/06/pliance_sensor_piano_en.pdf. Accessed April 2,
2020.
23. AdaptTech. How it works. https://www.adapttech.eu/howitworks#howinsightworks. Published 2007. Accessed October 26,
2020.
24. Tekscan. F-Socket System. https://www.tekscan.com/products-solutions/systems/f-socket-system. Accessed February 26, 2021.
25. Hopkins M, Vaidyanathan R, McGregor AH. Examination of the Performance Characteristics of Velostat as an In-Socket Pres-
sure Sensor. IEEE Sens J. 2020;20(13):6992-7000. doi:10.1109/jsen.2020.2978431
26. Ali S, Abu Osman NA, Eshraghi A, Gholizadeh H, Abd Razak NA Bin, Wan Abas WAB Bin. Interface pressure in transtibial
socket during ascent and descent on stairs and its effect on patient satisfaction. Clin Biomech. 2013;28(9-10):994-999.
doi:10.1016/j.clinbiomech.2013.09.004
27. Eshraghi A, Abu Osman NA, Gholizadeh H, Ali S, Abas WABW. Interface stress in socket/residual limb with transtibial pros-
thetic suspension systems during locomotion on slopes and stairs. Am J Phys Med Rehabil. 2015;94(1):1-10.
doi:10.1097/PHM.0000000000000134
28. Al-Fakih EA, Abu Osman NA, Mahmad Adikan FR. Techniques for Interface Stress Measurements within Prosthetic Sockets of
Transtibial Amputees: A Review of the Past 50 Years of Research. Sensors (Basel). 2016;16(7). doi:10.3390/s16071119
29. Convery P, Buis AW. Conventional patellar-tendon-bearing (PTB) socket/stump interface dynamic pressure distributions rec-
orded during the prosthetic stance phase of gait of a trans-tibial amputee. Prosthet Orthot Int. 1998;22(3):193-198.
doi:10.3109/03093649809164484
30. Neumann ES, Wong JS, Drollinger RL. Concepts of pressure in an ischial containment socket: Perception. J Prosthetics Orthot.
2005;17(1):12-20. doi:10.1097/00008526-200501000-00004Preprints (www.preprints.org) | NOT PEER-REVIEWED | Posted: 6 October 2021
31. Kahle JT, Highsmith MJ. Transfemoral sockets with vacuum-assisted suspension comparison of hip kinematics, socket position,
contact pressure, and preference: ischial containment versus brimless. J Rehabil Res Dev. 2013;50(9):1241-1252.
doi:10.1682/JRRD.2013.01.0003
32. Polliack AA, Sieh RC, Craig DD, Landsberger S, McNeil DR, Ayyappa E. Scientific validation of two commercial pressure sensor
systems for prosthetic socket fit. Prosthet Orthot Int. 2000;24(1):63-73. doi:10.1080/03093640008726523
33. AdaptTech. Webinar. https://www.adapttech.eu/webinar. Published 2020. Accessed October 26, 2020.
34. Numpy. Numpy. https://numpy.org/. Published 2021. Accessed May 15, 2021.
35. Matplotlib. Matplotlib: Visualization with Python. https://matplotlib.org/. Published 2021. Accessed May 15, 2021.
36. Python. scipy.interpolate.CloughTocher2DInterpolator. https://docs.scipy.org/doc/scipy/reference/generated/scipy.interpo-
late.CloughTocher2DInterpolator.html#scipy.interpolate.CloughTocher2DInterpolator. Accessed September 12, 2018.
37. Python. scipy.interpolate.Rbf. https://docs.scipy.org/doc/scipy/reference/generated/scipy.interpolate.Rbf.html#scipy.interpo-
late.Rbf. Accessed September 12, 2018.
38. Python. scipy.interpolate.NearestNDInterpolator. https://docs.scipy.org/doc/scipy/reference/generated/scipy.interpolate.Near-
estNDInterpolator.html. Accessed September 12, 2018.
39. Python. scipy.interpolate.LinearNDInterpolator. https://docs.scipy.org/doc/scipy/reference/generated/scipy.interpolate.Lin-
earNDInterpolator.html#scipy.interpolate.LinearNDInterpolator. Accessed September 12, 2018.
40. GoMeasure3D. Geomagic Wrap Software. https://gomeasure3d.com/geomagic-wrap-software/. Accessed May 4, 2020.You can also read