Virtual simulation of the biomechanics of the abdominal wall with different stoma locations
←
→
Page content transcription
If your browser does not render page correctly, please read the page content below
www.nature.com/scientificreports
OPEN Virtual simulation
of the biomechanics
of the abdominal wall
with different stoma locations
Lluís Tuset1, Manuel López‑Cano2, Gerard Fortuny1*, Josep M. López1, Joan Herrero3 &
Dolors Puigjaner1
An ostomy is a surgical procedure by which an artificial opening in the abdominal wall, known as
a stoma, is created. We assess the effects of stoma location on the abdominal wall mechanics. We
perform three-dimensional finite element simulations on an anatomy model which was generated on
the basis of medical images. Our simulation methodology is entirely based on open source software.
We consider seventeen different locations for the stoma incision (trephine) and we simulate the
mechanical response of the abdominal wall when an intraabdominal pressure as high as 20 kPa
is applied. We focus on factors related to the risk of parastomal hernia development such as the
deformation experienced by the abdominal wall, the stress levels supported by its tissues and the
corresponding level of trephine enlargement. No significant dependence was found between stoma
location and the levels of abdominal wall deformations or stress supported by tissues, except for the
case with a stoma located on the linea alba. Trephine perimeter and area respectively increased by as
much as 44% and 85%. The level of trephine deformation depends on stoma location with considerably
higher trephine enlargements found in stomas laterally located with respect to the rectus abdominis
muscle.
An ostomy is the creation of an artificial opening into the abdominal wall (AW) through which bodily waste is
rerouted outside of the body. This procedure is used to treat certain diseases related to the digestive or urinary
tract. The opening created is called stoma and it is placed on the abdominal wall. One of the most common
complications of ostomies is the appearance of a parastomal hernia (PH) after the construction of the stoma.
Even though PH is a very frequent problem (with reported incidences as high as 78%1 or 86%2 when identified
by computed tomography) it is difficult to treat and has a huge impact on the quality of life of patients who suffer
from it3–6. In recent years, there has been a striking interest in the prevention of PH with prosthetic m
eshes7–13.
However, advantages of a prosthetic mesh remain a matter of debate14,15.
Preventive surgical practices of PH other than the placement of a mesh have been described. The use of a
stoma incision (trephine) of a diameter not larger than 25 mm was suggested under the assumption that PH
were unlikely to develop for a small trephine provided that its size did not increase with t ime16. However, a
more recent study showed that enlargement of the trephine, regardless of its original size, took place in almost
every surveyed ostomy patient and that most patients developed PH even though the median trephine diameter
of the patient cohort was below 25 mm2. Other surgical practices, such as an extraperitoneal exteriorization of
the stoma (extraperitoneal tunneling of the stoma between the peritoneum and the AW) have been suggested
for the prevention of PH. Although these practices were supported by some promising results most of the data
came from observational studies, making extraperitoneal exteriorization of the stoma a controversial o ption17.
In a recent systematic review, no robust clinical data have been found to indicate which location of the stoma
into the AW is optimal for PH p revention18. Three-dimensional (3D) modelization of the AW could be of great
help to appreciate dynamically and objectively the influence of anatomic variations on the functioning of the
AW19,20. Numerical simulations can complement clinical studies and can provide data that help abdominal sur-
geons in their decisions. In the present study, we applied the finite element (FE) computational setup previously
1
Departament d’Enginyeria Informàtica i Matemàtiques, Universitat Rovira i Virgili, Av Països Catalans 26,
Tarragona, Catalunya, Spain. 2Abdominal Wall Surgery Unit, Department of General Surgery, Hospital Universitari
Vall d’Hebron, Universitat Autònoma de Barcelona, Barcelona, Spain. 3Departament d’Enginyeria Química,
Universitat Rovira i Virgili, Av Països Catalans 26, Tarragona, Catalunya, Spain. *email: gerard.fortuny@urv.cat
Scientific Reports | (2022) 12:3545 | https://doi.org/10.1038/s41598-022-07555-z 1
Vol.:(0123456789)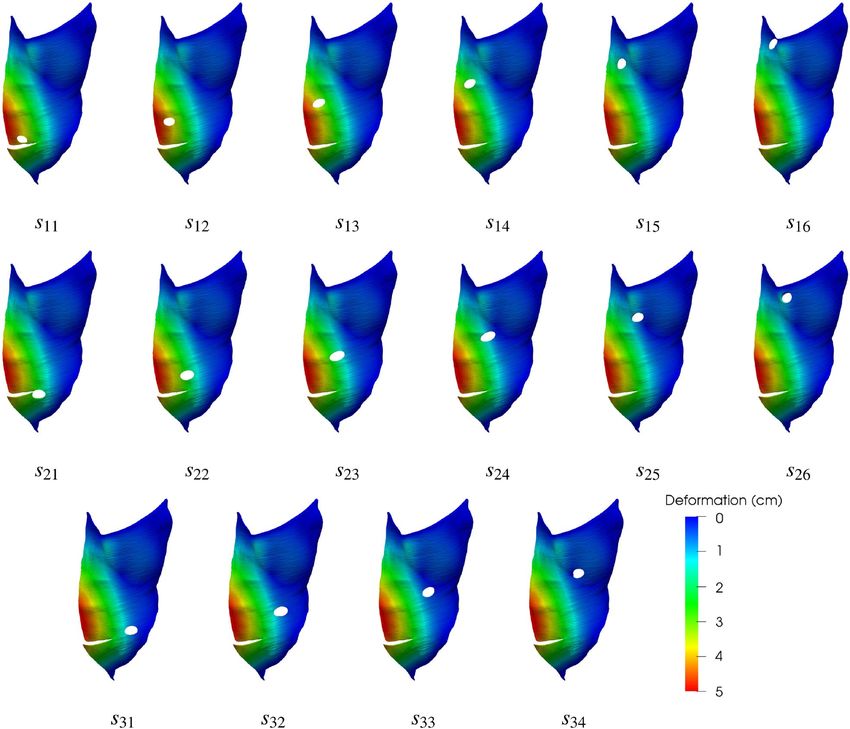
www.nature.com/scientificreports/
Figure 1. Geometry model of the abdominal wall. The elements included in the model are: (a) right and
left external oblique muscles (EO), (b) right and left internal oblique muscles (IO), (c) right and left rectus
abdominis muscles (RA), (d) right and left transverse abdominis muscles (TR), and (e) linea alba (LA). (f) View
of the whole model; note that muscle regions above the red lines in parts (a)–(c) were removed from the plot
and that since the muscles are superimposed the surfaces of the remaining (non-removed) muscle regions are
only partially visible in the composed image.
developed by Tuset et al.21 to investigate the effect of different transperitoneal stoma locations on the biome-
chanical behavior of the AW. We considered seventeen different locations for stoma incisions and we focused
our analysis in two aspects. First, we assessed whether the response of the AW to a certain level of intraabdomi-
nal pressure (IAP), measured in terms of both the deformation and stress levels experienced by the tissues, is
affected by the presence of a stoma. In addition, we analyzed the corresponding enlargements and deformations
experienced by the trephine. Enlargement of the stoma incision is generally considered a risk factor for PH, even
though statistical analyses of patient data on the subject might be i nconclusive2.
Methods
Geometry model. Figure 1 illustrates the geometry model of the AW used in the current study. The model
comprises four pairs of superimposed muscles: the two external oblique muscles (EO, Fig. 1a), the two internal
oblique muscles (IO, Fig. 1b), the two rectus abdominis muscles (RA, Fig. 1c), the two transverse abdominis
muscles (TR, Fig. 1d) and the linea alba (LA, Fig. 1e). Figure 1f shows how the four sets of involved muscles are
superimposed in the geometry model.
Our geometry model was based on computerized tomography (CT) images available in the BodyParts3D
database for a natomy22. Three-dimensional triangular surface meshes for each of the individual elements in the
model were downloaded from this database and were subsequently refined. The refined meshes were then merged
and undesirable intersections between contiguous elements were removed in order to obtain physically consistent
surface meshes. These surface meshes, with a total of 892, 283 triangles, were then uploaded into the Gmsh open
source software23 where the corresponding 3D volume meshes were built. Finally, the individual volume meshes
were compounded into a global computational mesh consisting of 3, 495, 765 tetrahedra.
In the present study, the stoma incision was modeled as a circular cylindrical orifice of diameter 2 cm. We
considered 17 different locations for the stoma distributed over the AW, as shown in Fig. 2. Except for one stoma
located on the LA, stomas are distributed along three vertical lines on the left side of the AW. The stoma located
on the LA is denoted as s0 and the rest of stomas are labelled as si,j , where the i index denotes the particular ver-
tical line (with i growing with increasing horizontal distance to the vertical midline) and j denotes the vertical
position of the stoma in the ith vertical line (with j increasing with height).
Scientific Reports | (2022) 12:3545 | https://doi.org/10.1038/s41598-022-07555-z 2
Vol:.(1234567890)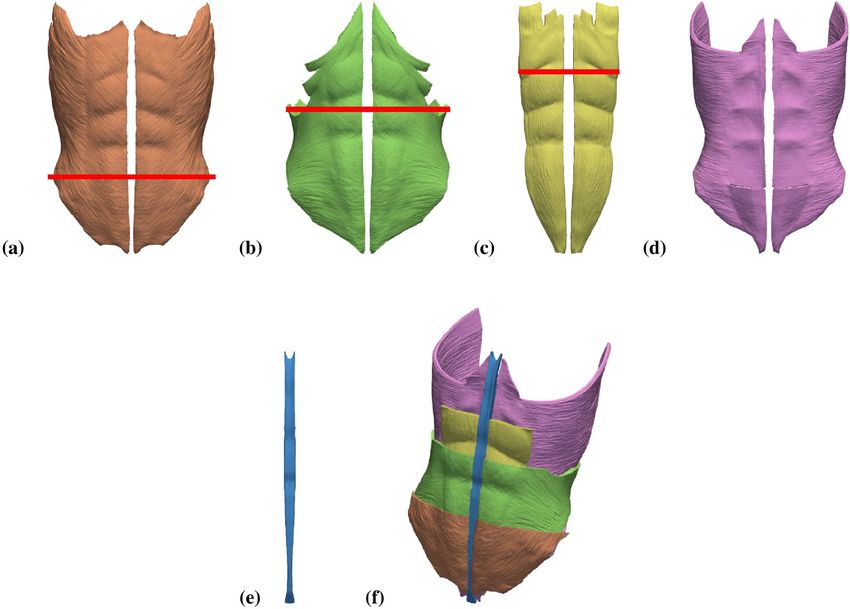
www.nature.com/scientificreports/
Figure 2. Trephine locations (colored in red) on the outermost AW surface and their labels.
Tissue E (MPa) References
EO 1 Cardoso24
IO 0.65 Cardoso24
RA 0.52 Cardoso24
TR 1.03 Cardoso24
LA 72 Cooney et al.25
Table 1. Values of Young’s modulus (E) assumed in the present study for the different tissues in our AW
model.
Material properties. We assumed a linear elastic behavior of the AW tissues,
σ = Eε, (1)
where the stress tensor (σ ), characterizing the force per unit surface area experienced by a material volume, is
proportional to the strain tensor (ε), whose components represent the relative deformations in the material vol-
ume along each spatial direction. To describe the mechanical behavior of a linear elastic material two parameters
are required, the Young’s modulus E, which provides the stiffness of the material (as can be seen in Eq. (1), for
a given σ level the larger the E value the smaller the relative deformation, ε) and the Poisson’s ratio (η), which
measures the relative volume change as a result of the deformation.
In the present study, the values of E for the EO, IO, RA and TR muscles were prescribed following the experi-
mental uniaxial tensor tests performed by C ardoso24. The specific E values for each tissue are listed in Table 1. For
the LA, which is essentially a tendinous tissue and thus the stiffest one in the AW, we used the E = 72 MPa value
reported by Cooney et al.25. Note that the present model does not include soft tissues such as skin or subcutaneous
abdominal fat. The underlying hypothesis is that as the stiffness of soft tissues is at least one order of magnitude
smaller (lower E) than the stiffness of the AW m uscles26 then muscles are the tissues actually determining the
biomechanical response of the AW. All the involved tissues were characterized with a Poisson ratio of η = 0.3.
Numerical simulation. All of the present FE simulations were carried out using the Code Aster open
source software27. A given uniformly distributed IAP value was set for the computational domain regions cor-
responding to the inner AW surface. In addition, a fixed zero deformation boundary condition was set for the
regions on the AW edges, where the real muscular tissue would be attached to bone tissue. For each particular
geometry, we considered five levels of IAP up to P = 20 kPa (150 mmHg), a maximum value which would be
typically achieved when coughing or jumping28. In each simulation, the distributions of stress (σ ) and deforma-
tions along the AW were calculated. As σ is a tensor quantity, often its physical interpretation is not straightfor-
ward. The so-called von Mises stress, σv , was therefore calculated and analyzed. The von Mises stress is a scalar
quantity devised to characterize the risk of rupture of a solid material when subjected to s tresses29.
As mentioned earlier, trephine enlargement seems to be a key risk factor for the development of PH. Con-
sequently, in every simulation the resulting trephine dimensions (perimeter and area) in the deformed geom-
etry were also measured and the relative change with respect to the reference (non-deformed) geometry was
calculated.
Scientific Reports | (2022) 12:3545 | https://doi.org/10.1038/s41598-022-07555-z 3
Vol.:(0123456789)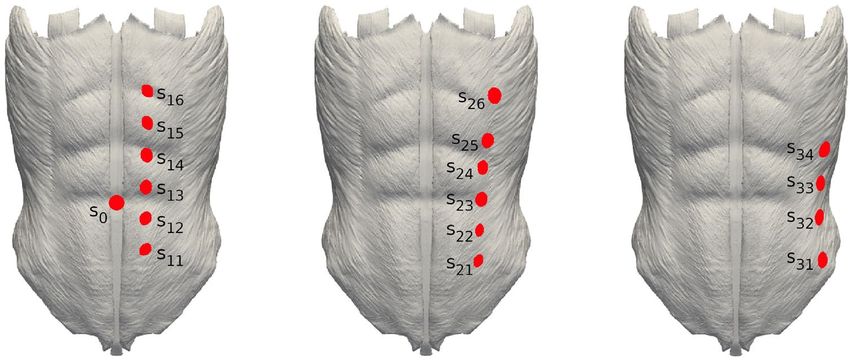
www.nature.com/scientificreports/

                                            Figure 3.  The predicted deformation distributions are plotted on the base (undeformed) geometry of the
                                            abdominal wall for all the cases investigated, that is, the reference case (no stoma) and the seventeen stoma
                                            locations. In all cases, the results correspond to the simulations with the maximum value of the applied
                                            intraabdominal pressure, P = 20 kPa.

                                            Results
                                            We performed FE simulations with the reference geometry model (no stoma) and with each of the 17 geometry
                                            models having a stoma in the locations shown in Fig. 2. In what follows, we analyze the effects of IAP on the
                                            overall AW mechanics and, in particular, the corresponding levels of trephine enlargement. For the sake of
                                            compactness, only results from simulations with the largest IAP value, P = 20 kPa, are presented here.

                                            Deformation and stress distribution on the abdominal wall.                   Figure 3 shows the deformation dis-
                                            tribution on the outer AW surface as predicted by our numerical simulations for all the cases investigated. Note
                                            that since in this figure deformations are plotted on the undeformed geometry trephines preserve their original
                                            size (trephine enlargement will be the subject of the next subsection). As expected, the result of applying any
                                            positive IAP level is always a forwards protrusion of the AW, with a maximum deformation of 52.09 mm in the
                                            reference case. In the 16 cases with the stoma located away from the LA, predicted maximum deformations
                                            ranged between 51.09 and 53.25 mm, which indicates that differences with respect to the reference case are
                                            not significant. Moreover, as it can be observed in Fig. 3, all deformations for geometries other than s0 strongly

          Scientific Reports |   (2022) 12:3545 |                https://doi.org/10.1038/s41598-022-07555-z                                                 4

Vol:.(1234567890)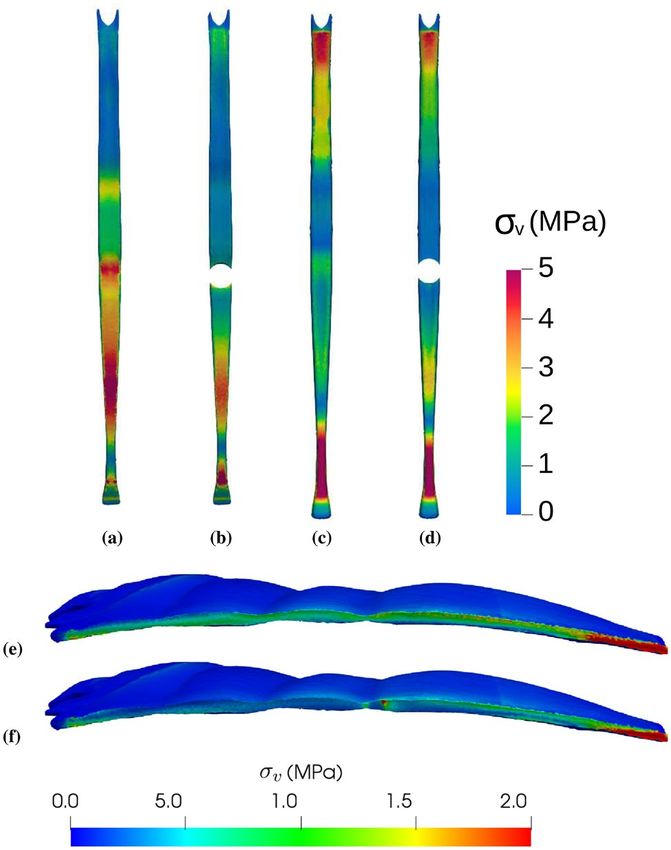
www.nature.com/scientificreports/
Figure 4. Distribution of Von Mises tension (σv ) on the anterior (a,b) and posterior (c,d) surfaces of the linea
alba and (e,f) on the inner lateral region of the left rectus abdominis muscle (the surface that is in contact with
the LA). (a,c,e) Reference case (model without incisions). (b,d,f) Case with a stoma located on the linea alba
(s0). Note that in parts (e) and (f) the axes are rotated so that the leftmost region of the RA here corresponds to
the uppermost RA region in Fig. 1c.
resemble the distribution for the reference case. Similarly, small differences were found between all cases other
than s0 in terms of the von Mises stress distributions, with maximal values (σvmax ) in the 11.19–11.36 MPa range
(with σvmax = 11.29 MPa in the reference case).
The s0 case was devised as an acid test for the current methodology. That is, the classical recommendation
that a stoma should not be constructed through a midline laparotomy incision1 ought to be also supported from
a mechanical standpoint. As illustrated in the first row of Fig. 3, the maximum AW deformation is about a 18%
larger in the s0 case (61.23 mm) than it is in the reference case (52.09 mm). The corresponding σvmax increase
is more modest, about a 3% ( σvmax = 11.65 MPa for s0 ). The LA plays a key role in AW mechanics as it pulls
together the muscles from the left and right sides (see Fig. 1f). Consequently, as shown in Fig. 4a,c, in the cur-
rent IAP-promoted AW expansion scenario LA is the element experiencing the highest stress levels, with the
largest σv values found near its lower edge (closer to the pubic region). From a mechanical point of view, the
main drawback with the s0 stoma location is that the trephine severs the LA into two independent sections (see
Fig. 4b,d). Despite the larger AW deformation for s0 in Fig. 3, comparison of Fig. 4d with Fig. 4b shows that the
two independent LA sections keep performing their main function, i.e., they remain attached to the muscles
from both sides of the AW.
As the two rectus abdominis are the muscles in closer contact with the LA through their inner lateral surfaces,
one would expect AW expansion to produce relatively high stress levels within the RA tissue. Figures 4e,f show
the σv distribution on the inner lateral region of the left RA muscle for the reference case and the s0 case. In the
reference case (Fig. 4e), the largest σv values are concentrated at the lower part of the muscle (rightmost section of
the plot), consistently with the stress distribution on the LA itself (see Fig. 4c). In contrast, in the s0 case (Fig. 4f)
a second region of high σv (i.e., a red spot) appears around the axial location of the trephine.
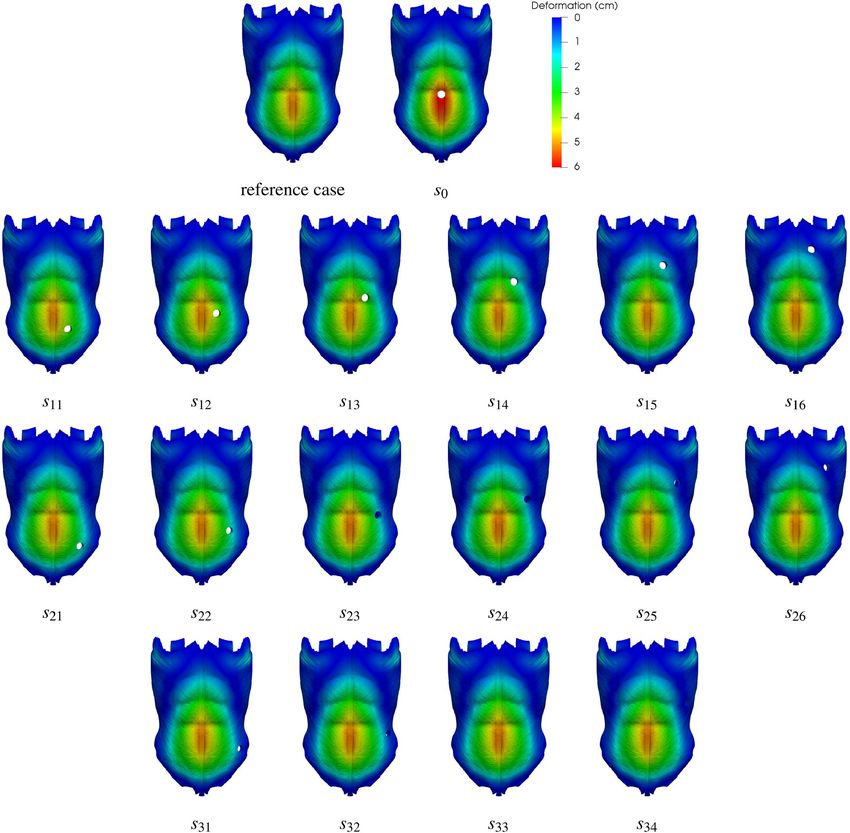
Trephine enlargement. The trephine original size was significantly increased as a result of the AW defor-
mation in all the cases investigated, as illustrated in Fig. 5 where the deformed geometry of the left TR muscle is
displayed. The elliptic forms adopted by stoma incisions in the deformed geometries are clearly visible in these
plots. In agreement with the radiological measurements reported by Ho et al.2, our simulations predict that the
trephine sagittal diameter grows more than its axial diameter does. Table 2 summarizes the deformations expe-
rienced by stomas in terms of trephine perimeter and area, as well as the corresponding percent increase of these
two quantities with respect to the original geometry. Note that when the largest IAP of 20 kPa is applied trephine
enlargements as high as 44% in terms of perimeter and 85% in terms of area (for the s32 stoma) are obtained. A
Scientific Reports | (2022) 12:3545 | https://doi.org/10.1038/s41598-022-07555-z 5
Vol.:(0123456789)www.nature.com/scientificreports/
Stoma Area of the deformed stoma (cm2) % increase in area Perimeter of the deformed stoma (cm) % increase in perimeter
s0 3.76 20 6.93 10
s11 3.59 14 6.88 9
s12 3.64 16 6.96 11
s13 4.18 33 7.56 20
s14 4.18 33 7.46 19
s15 4.25 35 7.45 19
s16 4.07 30 7.30 16
s21 4.75 51 7.76 23
s22 4.82 53 8.05 28
s23 5.37 71 8.70 38
s24 5.58 78 9.00 43
s25 4.34 38 7.56 20
s26 3.93 25 7.14 14
s31 4.28 36 7.50 19
s32 5.82 85 9.05 44
s33 4.34 38 7.59 21
s34 4.91 56 8.09 29
Table 2. Area and perimeter of stomas in the deformed geometry when an intraabdominal pressure of P = 20
kPa is applied. The percentage of increase with respect to the undeformed geometry is also included. Note
that in the undeformed geometry the diameter of the stoma is 2 cm, the area is therefore 3.14 cm2 and the
perimeter is 6.28 cm. In all cases, the dimensions of the deformed trephines were measured at the innermost
surface of the abodminal wall.
topic which is the subject of some controversy in the literature is whether trephine enlargment levels depend
on stoma location. More particularly, the question is whether or not stomas located lateral to the left RA muscle
tend to experience largest trephine enlargements than do stomas crossing the RA. For the latter type of stomas,
we can see in Table 2 (the ones labeled as s1,j , 1 ≤ j ≤ 6; see also Fig. 2) that the average incrase in trephine
area is 28% whereas for the stomas lateral to the RA muscle the corresponding increases are 53% ( s2,j ) and 54%
( s3,j ). Thus, the present simulations predict trephine enlargements that, on the average, are more pronounced for
stomas located lateral to the RA muscle. This result is in apparent contradiction with the findings by Ho et al.2,
who found no statistically significant relation between the rate of trephine size progression and stoma position.
Notwithstanding, these authors acknowledged as a limitation of their data analysis the fact that only 11.7% of
patients had a stoma created lateral to the RA muscle.
Discussion
Our study shows that the creation of a stoma, unless its location is poorly chosen, does not compromise the
mechanical consistency of the AW when subjected to IAP levels as high as 20 kPa. More precisely, except for the
case with a stoma located on the LA ( s0), the amount of deformation of the AW (visualized as a forward protru-
sion of the patient’s belly) and the stress levels that it supports show a very weak dependence on stoma location.
On the other hand, an augment of the trephine size was observed in all of the simulations. Such a trephine
enlargement was measured in terms of the increase in both trephine perimeter and cross-area. Our simulations
therefore indicate that trephine enlargement is inherent to the AW deformation that results when a certain IAP
level is applied. It seems plausible to suggest that as trephine enlargement is related to PH d evelopment2 then
parastomal hernia would be a long run complication inherent to the ostomy procedure. Notwithstanding, it is
important to place the present results in the proper scope. Our model predicts short-time trephine enlargements
that would be completely reversible. That is, the whole AW and thus the trephines would recover their original
shape once the IAP is released. What is seen and measured in the patients’ CT scans2 is trephine defect, i.e., the
level of permanent (irreversible) enlargement of trephines. We can think of trephine defect in terms of either
material fatigue, micro-lesions or, more generically, a progressive adaption of biological tissues to the surrounding
constraints. In an ideal world permanent trephine enlargement should not occur but reality (clinical findings) is
that trephine defect increases with time after stoma creation. We cannot presently predict, for example, whether
trephine defect would develop faster in a (hypothetical) patient with a quiescent life style, who might however
experience occasional large AW deformations (e.g., a sudden high peak in IAP level), or in a second patient
undergoing mild but frequent exercising.
The present simulations also show that stomas placed lateral to the RA muscle experience higher trephine
enlargements as a result of an IAP, a fact suggesting that creation of laterally placed stomas ought to be avoided.
However, this result has to be interpreted with caution because of the aforementioned difference between the
ideal (reversible) trephine enlargement, predicted in our simulations, and the real (irreversible) trephine defect
experienced by ostomy patients. Future research, which will hopefully include radiological measurements and
data analyses in large ostomy patients’ cohorts30, will no doubt shed more light on the subject. Moreover, our
Scientific Reports | (2022) 12:3545 | https://doi.org/10.1038/s41598-022-07555-z 6
Vol:.(1234567890)www.nature.com/scientificreports/
Figure 5. Deformed geometries in the cases where the enlargement of the stomas was apparent at first sight
when an IAP of P = 20 kPa was applied. For the sake of clarity, only the left TR muscle is shown in each case.
The deformation distribution on the TR surface is represented by color levels, as specified in the accompanying
color box.
methodology could be used in the future to assess the risks associated to trephine enlargement in a patient-
specific basis. For this purpose, simulations would be carried out in geometries built from the patient’s CT scans.
Received: 16 September 2021; Accepted: 10 February 2022
References
1. Whitehead, A. & Cataldo, P. Technical considerations in stoma creation. Colon Rectal Surg. 30, 162–171. https://d oi.o
rg/1 0.1 055/s-
0037-1598156 (2017).
2. Ho, K., Economou, T., Smart, N. & Daniels, I. Radiological progression of end colostomy trephine diameter and area. BJS Open
3, 112–118. https://doi.org/10.1002/bjs5.50109 (2019).
3. Kald, A., Juul, K. N., Hjortsvang, H. & Sjödal, R. I. Quality of life is impaired in patients with peristomal bulging of a sigmoid
colostomy. Scand. J. Gastroenterol. 43, 627–633. https://doi.org/10.1080/00365520701858470 (2008).
4. Ripoche, J., Basurko, C., Fabbro-Perray, P. & Prudhomme, M. Parastomal hernia. A study of the French federation of ostomy
patients. J. Visc. Surg. 148, e435–e441. https://doi.org/10.1016/j.jviscsurg.2011.10.006 (2011).
5. van Dijk, S. M. et al. Parastomal hernia: Impact on quality of life?. World J. Surg. 39, 2595–2601. https://doi.org/10.1007/s00268-
015-3107-4 (2015).
6. Hubbard, G. et al. Research priorities about stoma-related quality of life from the perspective of people with a stoma: A pilot survey.
Health Expect. 20, 1421–1427. https://doi.org/10.1111/hex.12585 (2017).
7. Serra-Aracil, X. et al. Randomized, controlled, prospective trial of the use of a mesh to prevent parastomal hernia. Ann. Surg. 249,
583–587 (2009).
8. López-Cano, M. et al. Use of a prosthetic mesh to prevent parastomal hernia during laparoscopic abdominoperineal resection: A
randomized controlled trial. Hernia 16, 661–667. https://doi.org/10.1007/s10029-012-0952-z (2012).
Scientific Reports | (2022) 12:3545 | https://doi.org/10.1038/s41598-022-07555-z 7
Vol.:(0123456789)www.nature.com/scientificreports/
9. Vierimaa, M. et al. Prospective, randomized study on the use of a prosthetic mesh for prevention of parastomal hernia of permanent
colostomy. Dis. Colon Rectum 58, 943–949. https://doi.org/10.1097/DCR.0000000000000443 (2015).
10. López-Cano, M. et al. Preventing parastomal hernia using a modified sugarbaker technique with composite mesh during laparo-
scopic abdominoperineal resection. Ann. Surg. 264, 923–928. https://doi.org/10.1097/SLA.0000000000001684 (2016).
11. Brandsma, H.-T. et al. Prophylactic mesh placement during formation of an end-colostomy reduces the rate of parastomal hernia
short-term results of the dutch prevent-trial. Ann. Surg. 265, 663–669. https://doi.org/10.1097/SLA.0000000000001903 (2017).
12. Odensten, C. et al. Use of prophylactic mesh when creating a colostomy does not prevent parastomal hernia. Ann. Surg. 269,
427–431. https://doi.org/10.1097/SLA.0000000000002542 (2019).
13. Prudhomme, M. et al. End colostomy with or without mesh to prevent a parastomal hernia (greccar 7). A prospective, randomized,
double blinded, multicentre trial. Ann. Surg. 274, 928–934. https://doi.org/10.1097/SLA.0000000000004371 (2021).
14. López-Cano, M., Pereira, J. & García-Alamino, J. Comment on: Meta-analysis and systematic review of the use of a prosthetic
mesh for prevention of parastomal hernia. Ann. Surg.https://doi.org/10.1097/SLA.0000000000004949 (2021).
15. Prudhomme, M., Fabbro-Peray, P., Rullier, E., Occean, B. V. & Bertrand, M. M. Meta-analysis and systematic review of the use of
a prosthetic mesh for prevention of parastomal hernia. Ann. Surg. 274, 20–28. https://doi.org/10.1097/SLA.0000000000004944
(2021).
16. Hotouras, A., Murphy, J., Power, N., Williams, N. & Chan, C. Radiological incidence of parastomal herniation in cancer patients
with permanent colostomy: what is the ideal size of the surgical aperture?. Int. J. Surg. 11, 425–427 (2013).
17. Kroese, L., de Smet, G., Jeekel, J., Kleinrensink, G. & Lange, J. Systematic review and meta-analysis of extraperitoneal versus
transperitoneal colostomy for preventing parastomal hernia. Dis. Colon Rectum 59, 688–695. https://doi.org/10.1097/DCR.00000
00000000605 (2016).
18. Hardt, J. et al. Lateral pararectal versus transrectal stoma placement for prevention of parastomal herniation. Cochrane Database
Syst. Rev.https://doi.org/10.1002/14651858.CD009487.pub2 (2019).
19. López-Cano, M., Rodríguez-Navarro, J., Rodríguez-Baeza, A., Armengol-Carrasco, M. & Susín, A. A real-time dynamic 3d model
of the human inguinal region for surgical education. Comput. Biol. Med. 37, 1321–1326. https://doi.org/10.1016/j.compbiomed.
2006.12.006 (2007).
20. Fortuny, G., López-Cano, M., Susín, A. & Herrera, B. Simulation and study of the geometric parameters in the inguinal area and
the genesis of inguinal hernias. Comput. Methods Biomech. Biomed. Eng. 15, 195–201. https://doi.org/10.1080/10255842.2010.
522182 (2012).
21. Tuset, L., Fortuny, G., Herrero, J., Puigjaner, D. & López, J. M. Implementation of a new constitutive model for abdominal muscles.
Comput. Methods Progr. Biomed.https://doi.org/10.1016/j.cmpb.2019.104988 (2019).
22. Mitsuhashi, N. et al. Bodyparts3d: 3d structure database for anatomical concepts. Nucleic Acids Res. 37, 782–785. https://doi.org/
10.1093/nar/gkn613 (2009).
23. Geuzaine, C. & Remacle, J.-F. Gmsh. A three-dimensional finite element mesh generator with built-in pre- and post-processing
facilities. (2020) http://gmsh.info/. (accessed 10 May 2020).
24. Cardoso, M. Experimental Study of the Human Anterolateral Abdominal Wall: Biomechanical Properties of Fascia and Muscles.
Master’s thesis, Faculdade de Engenharia, Universidade do Porto (2012).
25. Cooney, G. M. et al. Uniaxial and biaxial tensile stress-stretch response of human linea alba. J. Mech. Behav. Biomed. Mater. 63,
134–140. https://doi.org/10.1016/j.jmbbm.2016.06.015 (2016).
26. Guimarães, C., Gasperini, L., Marques, A. & Reis, R. The stiffness of living tissues and its implications for tissue engineering. Nat.
Rev. Mater. 5, 351–370. https://doi.org/10.1038/s41578-019-0169-1 (2020).
27. code Aster. Structures and thermomechanics analysis for studies and research. https://www.code-aster.org/spip.php?rubrique2
(2020). https://www.code-aster.org/spip.php?rubrique2. (accessed 26 May 2020).
28. Cobb, W. S. et al. Normal intraabdominal pressure in healthy adults. J. Surg. Res. 129, 231–235. https://doi.org/10.1016/j.jss.2005.
06.015 (2005).
29. Malvern, L. E. Introduction to the mechanics of a continuous medium. In Engineering of the Physical Sciences (Prentice-Hall, 1969).
30. Tabusa, H. et al. Protocol for the UK cohort study to investigate the prevention of parastomal hernia (the CIPHER study). Colo-
reactal Dis. 23, 1900–1908. https://doi.org/10.1111/codi.15621 (2021).
Acknowledgements
Financial support for the current research was granted by Universitat Rovira i Virgili, project number
2018PFR-URV-B2-29.
Author contributions
Conception: M.L.-C. and G.F. Simulation design and setup: L.T., G.F., J.M.L., J.H. and D.P. Performing the
simulations: L.T. Post-processing: L.T., G.F., J.M.L., J.H. and D.P. All authors analyzed and discussed the results
of the simulations. All authors contributed to the writing of the manuscript. All authors have read and agreed
to the submitted version of the manuscript.
Competing interests
The authors declare no competing interests.
Additional information
Correspondence and requests for materials should be addressed to G.F.
Reprints and permissions information is available at www.nature.com/reprints.
Publisher’s note Springer Nature remains neutral with regard to jurisdictional claims in published maps and
institutional affiliations.
Scientific Reports | (2022) 12:3545 | https://doi.org/10.1038/s41598-022-07555-z 8
Vol:.(1234567890)www.nature.com/scientificreports/
Open Access This article is licensed under a Creative Commons Attribution 4.0 International
License, which permits use, sharing, adaptation, distribution and reproduction in any medium or
format, as long as you give appropriate credit to the original author(s) and the source, provide a link to the
Creative Commons licence, and indicate if changes were made. The images or other third party material in this
article are included in the article’s Creative Commons licence, unless indicated otherwise in a credit line to the
material. If material is not included in the article’s Creative Commons licence and your intended use is not
permitted by statutory regulation or exceeds the permitted use, you will need to obtain permission directly from
the copyright holder. To view a copy of this licence, visit http://creativecommons.org/licenses/by/4.0/.
© The Author(s) 2022
Scientific Reports | (2022) 12:3545 | https://doi.org/10.1038/s41598-022-07555-z 9
Vol.:(0123456789)You can also read