Vegetation Height and Diurnal Period Influenced the Landscape-Use Pattern of Small Ruminants in Woodlands around Summer - MDPI
←
→
Page content transcription
If your browser does not render page correctly, please read the page content below
Article
Vegetation Height and Diurnal Period Influenced the
Landscape-Use Pattern of Small Ruminants in Woodlands
around Summer
Shailes Bhattrai *,† , Uma Karki and Sanjok Poudel ‡

                                          Department of Agricultural and Environmental Sciences, College of Agriculture, Environment, and Nutrition Sciences,
                                          Tuskegee University, Tuskegee, AL 36088, USA; ukarki@tuskegee.edu (U.K.); sanjokpoudel@gmail.com (S.P.)
                                          * Correspondence: shailes.bhattrai@uga.edu
                                          † Current address: Department of Poultry Science, College of Agricultural and Environmental Sciences,
                                            University of Georgia, Athens, GA 30602, USA.
                                          ‡ Current address: School of Plant and Environmental Sciences, College of Agriculture and Life Sciences,
                                            Virginia Polytechnic Institute and State University, Blacksburg, VA 24061, USA.

                                          Abstract: Despite the huge potential of using woodlands for small ruminant grazing in the southeast
                                          US, unmanaged understory shrubs grown beyond animals’ access minimize the utilization of such
                                          vegetation. This study aimed to determine the effect of vegetation height and diurnal period on the
                                          behavior and distribution patterns of goats and sheep in woodlands around summer. The study was
                                          conducted in six woodland plots (0.4 ha each) comprising southern pines and non-pine (non-target)
                                          plant species. Non-pine plants in each study plot were assigned to four treatments: cut to 0 m, 0.9 m,
                                or 1.5 m from the ground level or left uncut (control). Cut plant stubs were allowed to regrow to
                                   full canopy before stocking animals. Eight Kiko wethers and five Katahdin rams were rotationally
Citation: Bhattrai, S.; Karki, U.;        stocked in separate plots, and their diurnal (dawn–dusk) behaviors and distribution patterns were
Poudel, S. Vegetation Height and          monitored when they were in each plot (three plots per animal species) around the summer of
Diurnal Period Influenced the             2018. Animal behavior data were analyzed using the general linear model (GLM) procedure with
Landscape-Use Pattern of Small            multivariate analysis of variance (MANOVA) in SAS, while animal distribution pattern and weather
Ruminants in Woodlands around             data were analyzed in SAS using a GLM procedure and the distribution evenness index (DEI) using
Summer. Forests 2021, 12, 205.            the Kruskal–Wallis rank-sum test in R. Level of significance was set at 5%. Both animal species
https://doi.org/10.3390/f12020205
                                          visited the control area the least. Wethers browsed predominantly in areas where non-pine plants
                                          were cut to 0.9 m from the ground level, and rams grazed mostly in areas where non-pine plants
Academic Editors:
                                          were cut to the ground level, mostly during the post-midday period. Browsing was the dominant
Julianne O’Reilly-Wapstra and
                                          feeding behavior of wethers (39% browsing vs. 4% grazing), while rams’ feeding behavior was
Ben Moore
Received: 23 November 2020
                                          dominated with grazing (24% grazing vs. 12% browsing). Lying was a predominant diurnal behavior
Accepted: 8 February 2021                 in both wethers (46%) and rams (35%), mostly during the midday period. Wethers had a higher
Published: 10 February 2021               value for DEI than rams during the morning and post-midday periods. This study established that
                                          (1) the utilization of woodland understory foliage by small ruminants can be increased by lowering
Publisher’s Note: MDPI stays neutral      plant height, and (2) both vegetation characteristics and diurnal period are important factors for
with regard to jurisdictional claims in   influencing small ruminants’ behavior while stocked in woodlands around summer.
published maps and institutional affil-
iations.                                  Keywords: browsing; distribution; grazing; Katahdin rams; Kiko wethers

Copyright: © 2021 by the authors.         1. Introduction
Licensee MDPI, Basel, Switzerland.             Woodlands are land areas of at least 0.4 ha with 10% or more coverage by live trees,
This article is an open access article    including other areas that were similarly covered before and have the capacity to be
distributed under the terms and           regenerated or planted [1]. Woodlands cover a substantial portion of land (310 million
conditions of the Creative Commons
                                          hectares) in the United States and are important for economic and environmental well-
Attribution (CC BY) license (https://
                                          being. The southeast US has 31.5 million hectares of woodlands [2]. Alabama ranks
creativecommons.org/licenses/by/
                                          second in the Southeast in woodland coverage, with 9.3 million hectares of woodlands,
4.0/).

Forests 2021, 12, 205. https://doi.org/10.3390/f12020205                                                         https://www.mdpi.com/journal/forests
Forests 2021, 12, 205 2 of 16
which are dominated by softwood stands (mostly pine-45%) and generated an annual
revenue of USD 20 billion from the timber industry in 2017 [3]. Even with multiple
intercultural operations, such as thinning and pruning, profitable pine timber harvesting in
silvopastures may take from 30 to 50 years or more [4,5]; however, it may take even longer
for unmanaged woodlands. Investments in conventional woodland management practices,
such as mechanical control and forest fires, are either expensive or unfeasible. The cost
of the mechanical method of forest management averaged at USD 370.63/ha, chemical
control USD 125.01/ha, and the cost of prescribed fire is estimated between USD 65.80/ha
and USD 2471/ha [6,7]. Indeed, forest fire may pose a high risk to neighborhoods, if it
escapes from the target area, and also damage the desirable flora and fauna in the burnt
area [8]. In areas where forest fire is not feasible or desirable, the use of small ruminants
can be a viable option to control the understory vegetation in woodlands.
The integration of woodlands with suitable grazing animals can reduce understory
vegetation management costs while serving as an eco-friendly measure for vegetation
management [9]. Thinning and goat grazing in Mediterranean woodlands improved tree
growth, as indicated by greater tree height and trunk diameter, as opposed to woodlands
where such practices were not applied [10]. Goats are one of the suitable animal species
for integrating in woodlands, as they consume most of the vegetation available in the
system [11] and can also actively graze (feed on grasses and vegetation growing close to the
ground surface). Sheep can be another animal species to use in woodlands, since they can
change their feeding habits to browsing (eating woody shrubs, vines, and tree leaves) when
herbaceous species are limited in the system [12], reaching up to 0.87 m for browsing [13].
Identifying suitable animal species to integrate into woodlands for utilizing the un-
wanted vegetation and producing marketable quality animals for regular income is impor-
tant for the sustainable use of the whole system. Woodland grazing can also complement
the pasture-based animal production system by expanding the grazing opportunity, increas-
ing diet variety, creating a mild environment, and minimizing gastro-intestinal parasite
problems in small ruminants [9]. The expanded grazing opportunity can minimize the ex-
isting feed deficit for small ruminants in southeastern states of the US, including Alabama,
where farmers must supplement their animals with hay and/ or concentrate feeds for five
to six months each year, resulting in a high production cost [14,15]. Sustainably managed
woodlands with small ruminants can benefit both timber and small ruminant industries.
The scope of the small ruminant industry in the US is increasing, as the demand for
goat and sheep meat has been growing for the past several years at an accelerated rate. Goat
and sheep meat imports have increased at an average annual rate of 4% from 2002–2017,
goat production increased by 8%, and sheep production decreased by 1% during the same
time [16]. The projected increment in goat meat consumers, mostly in Hispanic and Asian
populations, by 115% and 143% between 2014 and 2020 [17], respectively, suggest that
goat meat demand will increase further. The US imported 143 thousand metric tons of
goat and sheep meat in 2017 [18], suggesting that domestic production is not enough to
meet the current demand. The negative supply situation in domestic production presents a
great opportunity to expand the small-ruminant industry in the US. The sustainable use of
woodlands for grazing small ruminants can minimize the production costs.
Despite the great scope of utilizing woodlands, only three percent of the total wood-
land (31.5 million hectares) is grazed in the Southeast [2], without any management applied
to the woodland resources. When small ruminants are used in woodlands, their access to
only a limited height can be an issue [11–13], as vegetation beyond animals’ reach remains
unutilized and shades plants present at the lower level, affecting their regrowth after
being consumed by animals. This situation triggers a question—how can the non-pine
(unwanted) plants present beyond the reach of grazing animals be managed? One of the
options would be to cut non-pine plant species to lower heights such that regrowth could
be within the reach of grazing animals and then manage the regrowth with the rotational
stocking of grazing animals. This idea needs to be tested to determine whether it works
and to evaluate how such cutting would influence animals’ landscape utilization patternsForests 2021, 12, 205 3 of 16
(time spent and behavior performed in different areas). Understanding animals’ behavior
and distribution within a landscape is very important to manage any grazing system
sustainably [13,19]. An even distribution of animals over the grazing landscape is essential
to utilize the available vegetation and recycle the nutrients in the form of animal excreta
uniformly within the system. The evenness of animal distribution can be estimated by
calculating the distribution evenness index (DEI) [19], which is elaborated in the Materials
and Methods section. Uneven animal distribution in grazing lands may cause overex-
ploitation of resources in certain areas while other areas remain underused, leading to
unsustainable use of resources. Therefore, a better understanding of animal behavior and
distribution pattern in a grazing system is important for landowners and land managers
to make management decisions such as the placement of grazing facilities, management
of stocking density, and control of predators [19]. Our previous studies during fall in
woodlands showed that goats and sheep mostly selected areas within their accessible
heights for browsing and grazing during evening hours, while resting activities such as
lying and loafing were mostly during afternoon hours, showing the influence of vegetation
height and diurnal periods on behavior and distribution patterns of goats and sheep during
fall [20]. In this study, we aimed to understand how the vegetation characteristics and time
of day influence the behavior and distribution pattern of Kiko wethers (castrated male
goats) and Katahdin rams (uncastrated male sheep) in woodlands around summer.
2. Materials and Methods
2.1. Study Site
The study was conducted around summer (June to August) of 2018 in six (6) woodland
plots, each of 0.4 ha and fenced on all sides, situated at the Atkins Agroforestry Research and
Demonstration Site, Tuskegee University, Tuskegee, Alabama, USA (latitude 32◦ 260 34.0” N,
longitude 85◦ 430 57.4” W). Study plots consisted of a mixture of longleaf (Pinus palustris
Mill.) and loblolly (Pinus taeda L.) pines, hardwood trees, and many understory plant
species. Pine trees were 13 years old, with a tree density of 690 trees/ha, height 8.3
(±0.09 SE) m, and diameter at breast height (DBH) of 12.7 (±0.24 SE) cm. The soil of the
study site comprised 78.7%, 21.3%, and 0.1% Cowarts loamy sand, Uchee loamy sand, and
Uchee–Cowarts complex, respectively, with the slope ranging from 1 to 25% [21].
2.2. Site Preparation
Prior to applying the cutting treatments, each plot was virtually demarcated into four
equal sections (0.1 ha each) with marking flags. During the summer of 2017, non-pine
plant species in each plot were either left uncut (control: Zone 1) or cut to the ground level
(0 m: Zone 2), 0.9 m from the ground level (Zone 3), or 1.5 m from the ground level (Zone
4); treatments were randomly assigned to each virtual section in each plot. Areas along
the fence line (Zone 5) were clear and mostly devoid of woody species or dense ground
vegetation; shelters, mineral feeders, and water troughs for animals were installed in this
zone (Figure 1). Two shelters and mineral feeders each were installed in each plot such
that one of each was located in between the two adjacent sections to promote the uniform
distribution of animals across all sections within each plot.
Before stocking animals in each study plot, available vegetation height (grown up to
2.13 m from the ground surface) was measured with a measuring tape in ten randomly
selected points in every zone within each plot. At each observation point, the height of
all vegetation present within a 1.2 m radius from the center of the observation point was
measured (Figure 2). Zone 2 mostly comprised herbaceous species and vines with an
average canopy height of 0.8 (±0.03 SE) m. Zone 3 and Zone 4 were dominated by woody
species with an average canopy height of 1.4 (±0.03 SE) m and 2.0 (±0.03 SE) m, respectively.
Zone 1, unlike other zones, was dominated by woody plants and understory vegetation
up to a height of 2.13 (±0.03 SE) m was considered as available for small ruminants based
on the maximum browsing height of 1.95 m reported in previous studies with young
(6–8 months old) Kiko wethers [22] and assuming a 7.7% higher browsing height for theForests 2021, 12, 205 4 of 16
mature animals used in the current study. Zone 5 did not have much vegetation available
for grazing or browsing.
Figure 1. Schematic diagram of research plots showing different zones and locations for shelters min-
eral feeders and water troughs, June–August 2018, Atkins Agroforestry Research and Demonstration
Site, Tuskegee University, Tuskegee, Alabama, USA. Zone 1: Non-pine plants left uncut (control);
Zone 2: Non-pine plants cut to the ground level; Zone 3: Non-pine plants cut to 0.9 m from the
ground level; Zone 4: Non-pine plants cut to 1.5 m from the ground level; Zone 5: Fence line and
driveway where shelters, mineral feeders, and water troughs were located.
Figure 2. A schematic diagram showing an observation point for the measurement of vegetation
height in different zones in woodlands, June–August 2018.
2.3. Study Animals and Their Management
Eight Kiko wethers (48–50 months old) and five Katahdin rams (29–32 months old)
were used for the study. The number of animals was determined by estimating the
equivalent live weight for each animal species at the beginning of the study. Animals
were stocked in the adjacent silvopasture plots before they were brought to the study plots.
Animals’ FAMACHA score (estimation of the level of anemia in animals caused by barber
pole worm (Haemonchus contortus (Rudolphi) Cobb.)), body condition score (BCS), live
weight, hooves, and the overall health condition were assessed before stocking them in the
study plots. Animals had access to clean drinking water and minerals ad libitum. WhenForests 2021, 12, 205 5 of 16
the vegetation attained the full canopy in the growing season, eight goats and five sheep
were randomly allocated to three separate plots per animal species at the beginning of
the study, and each animal species was rotated through the assigned plots throughout the
study period. Once 50% of the available vegetation within their reach was eaten during
the study period of June to August 2018, one set of studies was completed in one plot, and
animals were moved to the next plot for the next set of studies. Available vegetation was
estimated by visual observations several times during the study and by taking pictures
of the photoplots [23] that were established in each zone before stocking animals. These
vertical photoplots were 2.1 m high and 0.6 m wide that consisted of 56 equal-sized squares
inside (0.15 m × 0.15 m). Photoplots were used to take pictures and estimate the available
foliage in each plot before animals were brought to the plot, when animals were stocked
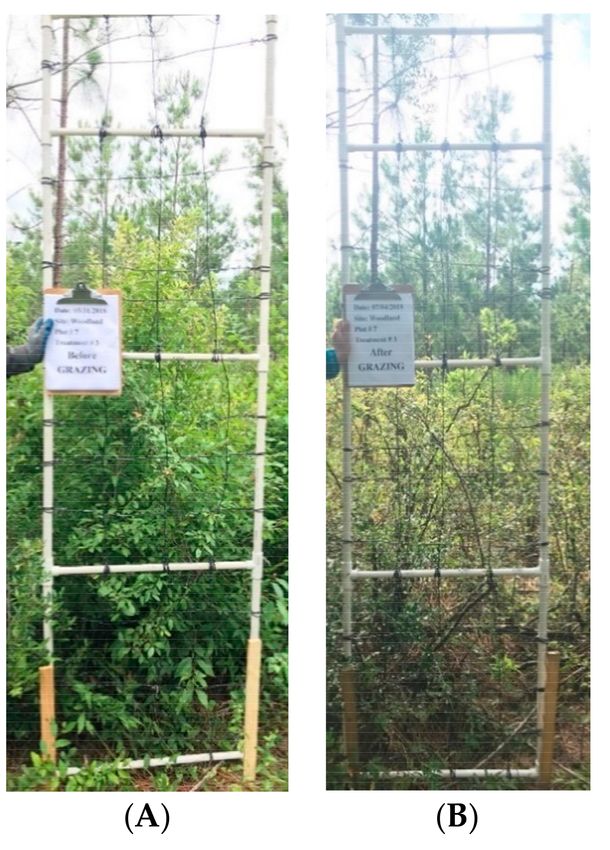
in the plot, and after animals were moved out of the plot (Figure 3). Study animals were
cared for following the Tuskegee University Animal Care and Use Committee protocol
throughout the study.
Figure 3. Photoplots taken (A) before bringing animals into the study plots to assess the available
vegetation and (B) after moving animals out of the plots to estimate the vegetation consumed by
Kiko wethers and Katahdin rams stocked in woodlands, June–August 2018.
2.4. Weather Data
Secondary data for air temperature, air pressure, humidity, dew point, wind speed,
and visibility for the study site and observation dates were downloaded from an online
resource recorded at Auburn-Opelika airport for the Tuskegee Institute, AL, which was the
nearest station, located around 34 km from the research site.
2.5. Diurnal Behavior and Distribution Pattern
A study on diurnal (dawn–dusk) behavior and distribution pattern of animals was
conducted as described in a previous study [20]. Once animals were stocked in study plots
(goats and sheep in separate plots), two days were allocated for them to adjust in each
plot. On Day 3, two observers (one for goats and another for sheep) observed the diurnal
behavior and distribution pattern of animals and recorded the observations on the pre-
structured observation sheets every 10 min. Observations were repeated at each rotational
stocking in each study plot, resulting in three observation days per animal species (5 June
to 12 August 2018), daily average duration of 13:30 h to 14:30 h, and 516 total observationsForests 2021, 12, 205 6 of 16
over the study period. Observation sheets were specific to each study plot, showing
different zones, locations of water troughs, mineral feeders, and shelters, and notation for
behavior categories such as grazing, browsing, loafing, lying, and debarking [19,20,24].
Observers placed themselves on the adjacent plots in such a way that they could easily
observe animals without letting the animals notice the observers. When animals were
not visible from the observers’ location, they moved quietly and gently to a new location
from where they could see animals clearly to avoid animals sensing such movement and
the presence of any observer near them. Changing the observation location continued
throughout the observation day as needed.
2.6. Data Analyses
Statistical analyses for animal behavior (percentage of total time spent by animals
on different behavior categories), distribution pattern (percentage of total time spent by
animals in different zones), distribution evenness index (DEI), and weather data were
conducted as described in a previous study [20]. Briefly, all observation data were grouped
into three diurnal periods: morning (dawn–1100 h), midday (1100–1500 h), and post-
midday (1500 h–dusk). This grouping of data into different diurnal periods helped to relate
animals’ behavior and distribution patterns to the varying weather conditions within a
day from morning to evening [19,25]. Since the behavior and weather data were correlated
(variables within each data set), multivariate analysis of variance (MANOVA) was used
to analyze them [19]. The MANOVA option takes care of the correlation existing among
the dependent variables used in the datasets and determines the effects of explanatory
variables on the set of dependent variables used in the model at once. Assumption of
independence was checked with the residual plots and no issues were found. Animal
distribution and vegetation height data were analyzed using general linear model (GLM)
procedure with analysis of variance (ANOVA) option in SAS 9.4. The level of significance
(α) was set at 5%. The difference among means was assessed using Tukey’s multiple
comparison test.
Model used for analyzing data:
1. Animal behavior-GLM procedure with MANOVA option in SAS 9.4
Y1ij Y2ij Y3ij . . . Ynij = µ + αi + βj + (αβ)ij + eij
MANOVA h = Animal species, diurnal period, and the interaction between animal species and diurnal period.
where Y(1–n)ij = value of an observation taken for the ith animal species, in jth diurnal
period, (Y1–Yn—behavior categories—grazing, browsing, loafing, and lying), µ = grand
mean, αi = main effect of the ith animal species (i = 1–2), βj = main effect of the jth diurnal
period (j = 1–2), (αβ)ij = interaction effect of ith animal species and jth diurnal period, and
eij = error associated with the ith animal species and jth diurnal period.
2. Weather data-GLM procedure with MANOVA option in SAS 9.4
Y1i Y2i Y3i = µ + αi + ei
MANOVA h = Diurnal period.
where Yi (1–3) = value of weather variables for the ith diurnal period (i = 1–3), µ = grand
mean, αi = main effect of ith diurnal period, and ei = error associated with ith diurnal period.
To determine the effect of Zones and diurnal periods on animal distribution, the animal
distribution data were analyzed using the GLM with ANOVA option in SAS 9.4. Zones
and diurnal periods were independent variables and animal distribution patterns were
dependent variables. For the analysis of vegetation height, zones were the independent
variables and vegetation height was dependent variable.Forests 2021, 12, 205 7 of 16
Similarly, DEI, which is a measure of uniformity of animal distribution patterns in
a grazing landscape, was calculated as described previously [20] by using the equation
presented below [26]. !
z
DEI = − ∑ pi ln pi / ln z
i =1
where pi = the proportion of wethers or rams present in a particular zone at a given
observation point in time, z = the number of zones in the study plot. A value of 0.001 was
assigned to zones with no animals at the specific observation time to make the mathematical
calculations feasible.
The set of DEI data was assigned to three different diurnal periods (morning, midday,
and post-midday), as done with the other data sets, and analyzed to determine the effect of
animal species on the distribution evenness using the Kruskal–Wallis rank-sum test [27], a
non-parametric analysis method in R v 3.4.4, as the data did not meet the criteria for normal
distribution required for a parametric analysis method. Multiple means were compared by
using the Dunn test. An animal species (goat and sheep) comparison for DEI was analyzed
separately for each diurnal period (morning, midday, and post-midday) by using the model
presented below:
k R2
12
H = ∑ i
n ( n + 1 ) i =1 n i
− 3( n + 1)
where H = test statistic, ni (i = 1, 2, 3, . . . , k) = sample size for each of the k groups (k = 1–2
for animal species and k = 1–3 for diurnal periods), Ri = the sum of ranks for group (animal
species or diurnal periods as applicable).
3. Results
3.1. Weather Parameters
Of all the diurnal periods, the highest humidity (p < 0.01) and lowest wind speed
(p < 0.05) occurred in the morning (Table 1). Air temperature, air pressure, dew point, and
visibility were not different among the diurnal periods.
Table 1. Weather parameters for different diurnal periods of behavior observation days at the study site, June–August 2018.
Diurnal Period
Weather Variables Morning (Dawn–1100 h) Midday (1100–1500 h) Post-Midday (1500 h–Dusk)
LS Means ± SE
Air temperature (◦ C) 24.6 ± 1.57 26.6 ± 2.03 28.3 ± 1.81
Air pressure (mm hg) 30.1 ± 0.02 30.1 ± 0.03 30.0 ± 0.03
Humidity (%) 75.1 ± 2.64 a, ** 53.2 ± 3.40 b 61.4 ± 3.04 b
Dew point (◦ C) 19.5 ± 0.75 19.5 ± 0.96 20.1 ± 0.86
Wind speed (Km/h) 8.5 ± 0.68 b 11.6 ± 0.88 a, * 9.9 ± 0.79 a,b
Visibility (Km) 14.8 ± 0.58 16.1 ± 0.75 16.1 ± 0.67
a,b
LS means with different superscripts in a row differ (* p < 0.05, ** p < 0.01). Km/h—Kilometers per hour; Km—Kilometers; LS
means—Least square means; SE—Standard error.
3.2. Vegetation Height
Zone 1, the control area, had the tallest understory vegetation followed by Zones 4, 3,
and 2 (p < 0.01) during the study period (Figure 4). Lower vegetation heights in cutting
treatments, mostly in Zones 2 and 3, could provide animals with greater access to available
plants compared to areas with higher vegetation heights, such as Zones 1 and 4.Forests 2021, 12, 205 8 of 16
Figure 4. Understory vegetation heights (LS means ± SE) in different zones in woodlands, June–
August 2018, Atkins Agroforestry Research and Demonstration Site, Tuskegee University, Tuskegee,
AL, USA (a,b,c,d LS means with different superscripts between different study zones differ, ** p < 0.01).
Zones 1 to 4 are defined in Figure 1.
3.3. Animal Behavior in Different Zones
Animal behavior was different across zones (p < 0.05). Animals lied down mostly in
Zone 5 (p < 0.01) and used other zones for feeding (Table 2). Wethers browsed predomi-
nantly in Zone 3 (Figure 4) (44% of the total browsing time; p < 0.05) and grazed mostly in
Zone 2 (50% of the total grazing time; p < 0.01). Rams grazed predominantly in Zones 2
(38% of the total grazing time) and 3 (29% of the total grazing time) while browsing mostly
in Zone 2 (45% of the total browsing time), followed by Zones 1 and 3 (27% of the total
browsing time in each) (p < 0.05). Animals spent most time on feeding activities in Zones 2
and 3 (wethers—70%, rams—69%).
Table 2. Diurnal (dawn–dusk) time spent by Kiko wethers and Katahdin rams in woodland, June–August 2018.
Behavior Category
Animal Species Zone Grazing Browsing Loafing Lying
LS Means ± SE (%)
1 0 ± 0.3 b 1 ± 1.4 c 0 ± 0.6 c 0 ± 1.5 c
2 2 ± 0.3 a, ** 11 ± 1.4 b 3 ± 0.6 b 7 ± 1.5 b
Kiko wethers 3 0 ± 0.3 b 17 ± 1.4 a, * 0 ± 0.6 c 0 ± 1.5 c
4 1 ± 0.3 a,b 10 ± 1.4 b 2 ± 0.6 b,c 3 ± 1.5 b,c
5 1 ± 0.3 a,b 0 ± 1.4 c 7 ± 0.6 a, * 36 ± 1.5 a, **
1 2 ± 1.1 c 3 ± 0.7 a,b 1 ± 1.1 c 1 ± 1.4 c
2 9 ± 1.1 a, * 5 ± 0.7 a, * 15 ± 1.1 a, ** 9 ± 1.4 b
Katahdin rams 3 7 ± 1.1 a,b 3 ± 0.7 a 3 ± 1.1 c 0 ± 1.4 c
4 3 ± 1.1 b,c 0 ± 0.7 b,c 0 ± 1.1 c 0 ± 1.4 c
5 3 ± 1.1 b,c 0 ± 0.7 c 9 ± 1.1 b 26 ± 1.4 a, **
a,b,c
LS means with different superscripts in a column for each animal species differ (* p < 0.05, ** p < 0.01). Zones 1 to 5 are defined in
Figure 1.
3.4. Animal Distribution in Different Zones
Vegetation height had an effect on the distribution of both animal species in the
landscape (p < 0.05). Wethers spent the predominant time in Zone 5 (44%, p < 0.0001), while
rams spent the predominant time in Zones 2 (37%) and 5 (36%, p < 0.05) (Figure 5). Zone 1Forests 2021, 12, 205 9 of 16
was the least visited area by wethers, while Zones 1, 3, and 4 by rams. Both animal species
visited Zone 1 the least.
Figure 5. Diurnal (dawn–dusk) time (LS means ± SE) spent by Kiko wethers and Katahdin rams
in different zones in woodlands, June–August 2018 (a,b,c x,y,z LS means with different superscripts
within each animal species differ; * p < 0.05, **** p < 0.0001). Zones 1 to 5 are defined in Figure 1.
3.5. Influence of Diurnal Period on Animal Behavior
The diurnal period influenced the feeding and lying behavior of both species (p < 0.05).
Grazing (p < 0.05) and browsing (p < 0.0001) behaviors of wethers were concentrated during
the post-midday period and lying during the midday period (p < 0.05) (Table 3). Similar
behavior was shown by rams, with most time spent on grazing (p < 0.0001) during the
post-midday period and lying during the midday period. However, rams browsed mostly
in the morning (p < 0.05).
Table 3. Diurnal (dawn–dusk) time spent by Kiko wethers and Katahdin rams in woodlands, June–August 2018.
Behavior Category
Animal Species Diurnal Period Grazing Browsing Loafing Lying
LS Means ± SE (%)
Morning (Dawn–1100 h) 1 ± 1.1 b 33 ± 3.9 b 15 ± 2.0 52 ± 4.0 b
Kiko wethers Midday (1100–1500 h) 3 ± 1.2 b 19 ± 4.6 b 9 ± 2.3 69 ± 4.7 a, *
Post-midday (1500 h–Dusk) 8 ± 1.1 a, * 63 ± 4.2 a, **** 10 ± 2.1 20 ± 4.3 c
Morning (Dawn–1100 h) 19 ± 3.1 b 18 ± 2.2 a, * 34 ± 3.3 29 ± 4.4 b
Katahdin rams Midday (1100–1500 h) 14 ± 3.7 b 4 ± 2.6 b 23 ± 3.9 59 ± 5.1 a, ****
Post-midday (1500 h–Dusk) 40 ± 3.4 a, **** 11 ± 2.3 b 27 ± 3.6 23 ± 4.7 b
a,b,c LS means with different superscripts in a column for each animal species differ (* p < 0.05, **** p < 0.0001).
3.6. Influence of Diurnal Period on Animal Distribution
The time of day influenced the time spent by both species in different zones (p < 0.05)
(Table 4). In Zones 1 (p < 0.05) and 3 (p < 0.0001), wethers spent the most time during
the post-midday period, while in Zone 5, they spent most time during the midday period
(p < 0.05). Similarly, rams spent the most time in Zone 1 (p < 0.05) in the morning, Zone 3
during the post-midday period (p < 0.01), and Zone 5 (p < 0.001) during the midday period.
Wethers were distributed more evenly in the post-midday period, with a distributionForests 2021, 12, 205 10 of 16
evenness index (DEI) value of 0.16 vs. the morning (DEI—0.08; p < 0.01) and midday
periods (DEI—0.05; p < 0.0001).
Table 4. Diurnal (dawn–dusk) time spent by Kiko wethers and Katahdin rams in woodlands, June–August 2018.
Zone 1 Zone 2 Zone 3 Zone 4 Zone 5
Animal Species Diurnal Period
LS Means ± SE (%)
Morning (Dawn–1100 h) 0 ± 0.6 b 27 ± 4.0 8 ± 3.2 b 19 ± 3.3 45 ± 4.3 b
Kiko wethers Midday (1100–1500 h) 0 ± 0.8 b 19 ± 4.7 3 ± 3.7 b 14 ± 3.8 64 ± 5.1 a, *
Post-midday (1500 h–Dusk) 3 ± 0.7 a, * 20 ± 4.3 40 ± 3.4 a, **** 11 ± 3.5 26 ± 4.6 c
Morning (Dawn–1100 h) 12 ± 2.5 a, * 40 ± 4.8 13 ± 3.4 ab 7 ± 2.1 28 ± 4.4 b
Katahdin rams Midday (1100–1500 h) 6 ± 3.0 b 31 ± 5.6 6 ± 3.9 b 1 ± 2.4 55 ± 5.2 a, ****
Post-midday (1500 h–Dusk) 3 ± 2.7 b 39 ± 5.1 23 ± 3.6 a, ** 5 ± 2.2 29 ± 4.7 b
a,b,c
LS means with different superscripts in a column for each animal species differ (* p < 0.05, ** p < 0.01, **** p < 0.0001). Zones 1 to 5 are
defined in Figure 1.
3.7. Effect of Animal Species on Diurnal Behavior
Diurnal behaviors were significantly different between Kiko wethers and Katahdin
rams throughout the study period that lasted for 13:30 to 14:30 h (p < 0.01). Wethers (46%)
and rams (35%) showed predominantly lying behavior (Figure 6). Wethers lied down for a
longer time than rams (p < 0.01). Browsing was the dominant feeding behavior of wethers
(39%), which was much higher than that of rams (p < 0.0001). In contrast, grazing was
the dominant feeding behavior of rams (24%), and was much greater than that of wethers
(p < 0.0001). Rams loafed for a longer time (28%) compared to wethers (11%) (p < 0.0001).
Animals did not debark pine trees during the study. The DEI of wethers was significantly
higher than rams during the morning (p < 0.01) and post-midday periods (p < 0.0001)
(Figure 7).
Figure 6. Diurnal (dawn–dusk) time (LS means ± SE) spent by Kiko wethers and Katahdin rams
in woodlands, June–August 2018 (a,b LS means with different letters within each behavior category
differ; ** p < 0.01, **** p < 0.0001).Forests 2021, 12, 205 11 of 16
Figure 7. Distribution evenness index (DEI) (LS means ± SE) of Kiko wethers and Katahdin rams in woodlands, June–
August 2018 (a,b LS means with different letters within each diurnal period differ; ** p < 0.01, **** p < 0.0001).
4. Discussion
4.1. Influence of Vegetation Height on Animal Behavior and Distribution
We found a significant influence of the height of understory vegetation in woodlands
on the behavior and landscape-use pattern of Kiko wethers and Katahdin rams in this
study. Wethers browsed mostly in Zone 3, which was dominated by woody species with
an average vegetation canopy height of 1.4 m. Wethers grazed for a very short time, mostly
in Zone 2, which had plenty of herbaceous species grown to an average height of 0.8 m
from the ground surface. A longer time spent by wethers on browsing (44% of total feeding
time) versus grazing (0%) in areas where the vegetation canopy was available to an average
height of 1.4 m, which shows the importance of lowering and maintaining the non-timber
(non-pine) vegetation within the comfortable reach of goats in woodlands. Although there
was an abundance of browse vegetation in Zone 4, where the average canopy height was
2.0 m, goats spent much less time (41%) browsing here compared to Zone 3. The time
spent by goats on browsing in Zone 1, where no manual intervention was made in altering
the non-pine vegetation height, was much lower (94%) than the time they spent in Zone 3
on browsing. Similar findings were reported in our previous study during fall [20]. With
these findings, the current research revealed that maintaining the browse vegetation at an
appropriate height provides comfortable access to animals and promotes the utilization
of such vegetation in woodlands. In our previous study, we demonstrated that goats and
sheep consumed foliage from an average maximum height of 1.6 m and 1.1 m, respectively,
in woodlands [28]. Even though the browsing behavior of goats has been reported as a
dominant feeding behavior, with some possible reasons for such behavior explained in
previous studies [24,29,30], the current study is the first to determine the effect of vegetation
height on the browsing behavior of goats in woodlands.
Similar to wethers, rams’ preference for feeding and non-feeding behavior was influ-
enced by the height of understory vegetation while stocked in woodlands. Rams preferred
Zones 2 and 3 for feeding activities as these zones had shorter vegetation canopy height,
0.8 m and 1.4 m, respectively, compared to Zones 1 and 4. Rams spent 69% of their total
feeding time in these zones, where 67% of the total feeding time was spent on grazing
and 33% on browsing. Although grazing as the dominant feeding behavior of sheep has
been reported in previous studies [24,31,32], their preference for certain areas based on the
vegetation height is the novel finding of the current study. Additionally, the findings of the
current study emphasize the value of mixed species grazing (goats and sheep) to utilize
the diversified vegetation available in woodlands that is managed to promote understoryForests 2021, 12, 205 12 of 16
vegetation growth and utilization, and minimize the competition of non-pine vegetation
with pine trees. Zone 1 was the least visited area by both animal species because of its
denseness with woody plant species and the most foliage remaining beyond the reach
of animals. The areas with sparse vegetation, shelters, and watering facilities (Zone 5)
were used by animals for lying or resting. These results indicate that openness and the
availability of ample vegetation within the reach of animals are important for the efficient
use of understory foliage in woodlands. This finding has presented a new insight for
tremendously improving woodland grazing strategy, which involves lowering the height
of non-timber species to desirable levels and maintaining the regrowth within the reach of
grazing animals. By implementing this new management approach, producers can derive
additional benefits over the conventional practice of woodland grazing that only includes
rotational stocking of animals after developing grazing facilities to harvest the existing
understory vegetation without any management of non-timber or timber species. While
individual animal behavior were not accounted for in this study, we believe the results are
applicable to similar animal populations, environmental conditions, and grazing systems,
as used in the current study.
4.2. Influence of Diurnal Period on Animal Behavior and Distribution
Diurnal periods had a significant effect on feeding and lying activities of goats and
sheep. Feeding activities were concentrated mostly during the post-midday period. Several
researchers have reported similar findings from studies conducted in different grazing
systems, such as woodlands [20], silvopastures [19,24,33], and the Mongolian steppe [34].
Goats grazed for less time in the morning due to less conducive environmental condi-
tions (cooler temperature, higher humidity, and possible dew) as compared to evening
hours [19]. In the current study, the morning temperature was lower while the humidity
was higher than during other parts of the day. Similar to the results reported by previous
studies [19,20,24], animals grazed until late evening in the current study. Lying behavior
was predominant during the midday period, which could be because of the direct sunlight
falling on the ground (perpendicular or close to that angle) thereby creating less or no
shading in the grazing lands vs. during morning or post-midday hours. The direct sunlight
during the midday period might have caused discomfort in grazing animals, leading them
to rest in the shade and/ or shelters. Previous studies conducted in woodlands during
fall [20] and in silvopastures during the cool-season-grazing period have reported similar
results [19,24].
Another reason for the lying behavior of animals during the midday period could
be because of the higher wind speed during this time versus the morning period in the
current study. Goats preferred indoor conditions under light (0.5 m/s) to medium (4 m/s)
windy conditions [35]. In addition, a high temperature (26.6 ◦ C) could have caused more
lying behavior of animals during the midday period, as this temperature was above
the thermoneutral zone of goats (10–20 ◦ C) and towards the upper limit of sheep (21.1–
31.1 ◦ C) [36]. Similarly, a predominant lying activity for goats and sheep was reported
during the midday period when the humidity was lower than reported in the current study
(47.3%) and the temperature was 24.5 ◦ C [24]. Goats were distributed most evenly during
the post-midday period, when their feeding activities were predominant. This might have
resulted from their dispersal in search of their preferred foliage. A previous study has
reported goats’ greater DEI in the spring vs. winter and during midday vs. morning in
silvopastures due to more conducive weather conditions in the former season and diurnal
period [19]. These authors showed higher DEI values occurring during the diurnal periods,
when animals were exhibiting greater feeding activities. Understanding diurnal variation
in behavior of goats and sheep could benefit small farmers, who have small woodland
holdings and few animals, by targeting animal intergation in such grazing facilities during
their active feeding periods, thereby saving time and management costs.Forests 2021, 12, 205 13 of 16
4.3. Species Effect on Behavior and Distribution Pattern
Wethers browsed for a longer time (69%) compared to rams, while rams grazed
for a longer time (83%) than wethers. Browsing as a dominant feeding activity of goats
and grazing for sheep have been reported in several studies conducted in non-woodland
systems, showing goats’ browsing activity ranging from 45% to 63% of the total observation
time, while sheep browsed for 12% to 18% of the total observation time [13,24,37,38].
Similarly, in another study, goats browsed for 75% of the total feeding time and sheep
grazed for 73% of the total feeding time, while they co-grazed in rangelands dominated
by shrubs and herbaceous annual grasses [39]. The difference in the foraging behavior
of goats and sheep could be due to difference in their anatomical structures. In general,
goats have mobile upper lips and prehensile tongues that allow them to select leaves of
browse species [30], while the short lips and broad muzzle in sheep facilitate the intake
of grasses and forages growing close to the ground [32]. The current and previous study
findings support the fact that when there are different types of vegetation available, goats
are more inclined to browse, and sheep are more inclined to graze as compared to each
other irrespective of the grazing system. The different foraging behavior of sheep and goats
indicates that co-grazing of these species would be more effective to utilize the grazing
lands with diverse vegetation than grazing with either of the species alone.
Time spent loafing remained less (61%) for Kiko wethers than Katahdin rams in
this study. This could be because of rams traveling more within the landscape searching
for their preferred vegetation. However, the availability of sufficient woody plants in
study plots for goats to browse might have minimized their time spent searching for the
foliage of their choice. In contrast to the finding of the current study, a study reported
that goats loafed for a longer time than sheep with or without confinement in silvopasture
plots [24]. These authors mentioned that there were plenty of planted herbaceous forages
in silvopasture plots, where sheep spent the most time grazing, and woody species outside
the silvopasture plots, where goats traveled to browse when the silvopasture plot gate was
left open (non-confinement). Goats lied down for a longer time (24%) compared to sheep
in the current study. This could be because of sheep spending more time searching for
food. Wethers were spread across the landscape more evenly in the morning (63%; p < 0.01)
and post-midday (69%; p < 0.0001) periods than rams. This could be because of a stronger
flocking behavior of sheep than goats. Another reason for goats’ more even distribution
could be because of their greater preference for a wide range of plant species available
throughout the landscape, causing them to spread more widely in the grazing land [40]
compared to sheep. Similar to the findings of the current study, greater DEI values for
wethers than rams were reported when they were grazed in woodlands separately [20] or
co-grazed in silvopastures [24].
Animals did not debark pine trees in the current study. However, debarking behavior
of Kiko wethers on southern pine trees has been reported [19,24] when they were rotation-
ally stocked in silvopasture plots. Nevertheless, sheep did not debark any pine trees in
silvopastures [24]. Contrary to the findings of these authors, sheep debarked the younger
stand of pine trees (2–4 years old) heavily (35%) in low tree density plots and less (Forests 2021, 12, 205 14 of 16
available within their reach the least. Open space (dry and sparsely vegetated) with shelters,
mineral feeders, and watering facilities was mostly preferred by animals for lying or resting.
Animals preferred to browse and graze during the post-midday period and lie down in
the midday period. Neither of the animal species debarked pine trees. This study has
established that small ruminants can efficiently utilize understory vegetation in woodlands
available within their reach and located in areas they can easily move through compared
to areas with dense woody species growing beyond their reach. Such a landscape-use
pattern of animals confirms the importance of lowering the height of non-timber plants and
maintaining their regrowth within the reach of grazing animals to increase the utilization of
woodland-understory vegetation. The current study also found a strong diurnal periodicity
of animals when performing different behaviors and utilizing various areas with diverse
vegetation characteristics and facilities in woodlands. While individual animal behavior
were not accounted for in this study, we believe the results are applicable to similar animal
populations, environmental conditions, and grazing systems, as used in the current study.
Author Contributions: U.K. designed the experiment. S.B. and S.P. collected behavior and distribu-
tion data. S.B. and U.K. performed statistical analyses and interpreted the results. S.B. prepared the
manuscript and U.K. reviewed and edited it. S.B. and U.K. finalized the manuscript. All authors
have read and agreed to the published version of the manuscript.
Funding: This work was supported by the United States Department of Agriculture (USDA)–
National Institute of Food and Agriculture (NIFA), Agriculture and Food Research Initiative (AFRI)
Competitive Grant # 2016-68006-24764, and the McIntire Stennis Forestry Research Program.
Data Availability Statement: The data presented in this study are available on request from the
corresponding author. The data are not publicly available due to restrictions from funding agency.
Acknowledgments: The authors are grateful for the support from the staff of the Tuskegee University
George Washington Carver Agricultural Experiment Station and Cooperative Extension to set up
some of the grazing facilities in the study plots.
Conflicts of Interest: The authors declare no conflict of interest.
References
1. USDA-FS. Forest Inventory and Analysis; United States Forest Service, United States Department of Agriculture: Washington,
DC, USA, 2016; Available online: https://www.nrs.fs.fed.us/fia/data-tools/state-reports/glossary/default.asp (accessed on 13
March 2019).
2. Bigelow, D.P.; Borchers, A. Major Uses of Land in the United States, 2012. 2017. Available online: https://ageconsearch.umn.edu/
record/263079/files/eib-178.pdf (accessed on 24 February 2019).
3. AFC. Forest Resource Report. 2017. Available online: http://www.forestry.alabama.gov/PDFs/alabamaForestResourceReport.
pdf (accessed on 20 September 2018).
4. Hamilton, J. Silvopasture: Establishment and Management Principles for Pine Forests in the Southeastern United States; USDA National
Agroforestry Center and Natural Resources Conservation Service: Lincoln, NE, USA, 2008.
5. Onokpise, O.U.; Bambo, S.K. Establishment and management of trees in silvopasture systems. In Sustainable Agroforestry
Practices in the Southeastern United States: Training Handbook; Karki, U., Ed.; Tuskegee University Cooperative Extension Program,
Publication No. TUAG1015-01 2015; Tuskegee University: Tuskegee, AL, USA, 2015; pp. 9–25.
6. Maggard, A.; Barlow, B. Costs & Trends of Southern Forestry Practices, 2016; Alabama Cooperative Extension System (ACES):
Auburn, AL, USA, 2018; Available online: http://www.afoa.org/PDF/n180312a.pdf (accessed on 5 March 2019).
7. Stephens, S.L.; McIver, J.D.; Boerner, R.E.J.; Fettig, C.J.; Fontaine, J.B.; Hartsough, B.R.; Kennedy, P.L.; Schwilk, D.W. The effects of
forest fuel-reduction treatments in the United States. Bioscience 2012, 62, 549–560. [CrossRef]
8. USDA-FS. Wildland Fire; United States Department of Agriculture: Washington, DC, USA, 2019; Available online: https:
//www.fs.fed.us/managing-land/fire (accessed on 25 February 2019).
9. Karki, U. Woodland Grazing Notes with Research Highlights; Tuskegee University, Tuskegee University Cooperative Extension
Program: Tuskegee, AL, USA, 2017; Available online: https://www.tuskegee.edu/Content/Uploads/Tuskegee/files/CAENS/
TUCEP/Livestock%20program/WoodlandGrazing.pdf (accessed on 24 February 2019).
10. Perevolotsky, A.; Haimov, Y. The effect of thinning and goat browsing on the structure and development of Mediterranean
woodland in Israel. For. Ecol. Manag. 1992, 49, 61–74. [CrossRef]
11. Khatri, R.; Karki, U.; Bettis, J.; Karki, Y. Grazing with goats changed the woodland plant-species composition during summer.
Prof. Agric. Work. J. 2016, 4, 1–11.Forests 2021, 12, 205 15 of 16
12. Kronberg, S.L.; Malechek, J.C. Relationships between nutrition and foraging behavior of free-ranging sheep and goats. J. Anim.
Sci. 1997, 75, 1756–1763. [CrossRef] [PubMed]
13. Sanon, H.O.; Kaboré-Zoungrana, C.; Ledin, I. Behaviour of goats, sheep and cattle and their selection of browse species on natural
pasture in a Sahelian area. Small Rumin. Res. 2007, 67, 64–74. [CrossRef]
14. Karki, U. Importance of year-round forage production and grazing/browsing management. In Sustainable Year-Round Forage
Production and Grazing/Browsing Management for Goats in the Southern Region; Karki, U., Ed.; Tuskegee University Cooperative
Extension Program: Tuskegee, AL, USA, 2013; pp. 1–4.
15. Karki, U.; Karki, L.B. Winter forage program benefitted small-scale goat producers. Am. J. Agric. Biol. Sci. 2017, 12, 79–84.
[CrossRef]
16. USDA-NASS. Sheep and Goats; National Agricultural Statistics Service (NASS): Washington, DC, USA; Agricultural Statistics
Board: Washington, DC, USA; United States Department of Agriculture: Washington, DC, USA, 2017; Available online: https:
//usda.library.cornell.edu/concern/publications/000000018?locale=en (accessed on 6 March 2019).
17. Colby, B.S.L.; Ortman, J.M. Projections of the Size and Composition of the U. S. Population: 2014 to 2060. 2015. Available
online: https://www.census.gov/content/dam/Census/library/publications/2015/demo/p25-1143.pdf (accessed on 25 Febru-
ary 2019).
18. COMTRADE-UN. Major Importing Countries of Sheep/Goat Meat. 2017. Available online: http://www.agriexchange.apeda.gov.
in/product_profile/Major_Importing_Countries.aspx?categorycode=0402 (accessed on 25 February 2019).
19. Karki, U.; Karki, Y.; Khatri, R.; Tillman, A. Diurnal behavior and distribution patterns of Kiko wethers in southern-pine
silvopastures during the cool-season grazing period. Agrofor. Syst. 2018, 93, 267–277. [CrossRef]
20. Bhattrai, S.; Karki, U.; Poudel, S.; McElhenney, W. Diurnal behavior and distribution patterns of Kiko wethers and Katahdin rams
in woodlands with different vegetation heights during fall. Agrofor. Syst. 2020, 94, 1809–1823. [CrossRef]
21. USDA-NRCS. Custom Soil Resource Report for Macon County, Alabama; United States Department of Agriculture, Natural Resources
Conservation Service: Washington, DC, USA, 2018.
22. Khatri, R. Use of Woodlands and Browse as Complementary to the Year-Round Grazing for Goats. Master’s Thesis, Tuskegee
University, Tuskegee, AL, USA, 2016.
23. USDA-FS. Sampling Vegetation Attributes; USDA, Forest Service, Technical Reference 1734-4: Bureau of Land Management, Denver,
Colorado, 1996; USDA-FS: Washington, DC, USA, 1996. Available online: http://www.blm.gov/nstc/library/pdf/sampleveg.pdf
(accessed on 26 September 2018).
24. Poudel, S.; Karki, U.; McElhenney, W.; Karki, Y.; Tillman, A. Behavior and distribution patterns of Katahdin rams in southern-pine
silvopastures with cool-season forages. Agrofor. Syst. 2019, 93, 1887–1896. [CrossRef]
25. Karki, U.; Karki, Y.; Khatri, R.; Tillman, A.; Poudel, S.; Gurung, N.; Kumi, A. Raising goats in the southern-pine silvopasture
system: Challenges and opportunities. Agrofor. Syst. 2018, 93, 1647–1657. [CrossRef]
26. Zuo, H.; Miller-Goodman, M.S. An index for description of landscape use by cattle. Rangel. Ecol. Manag. J. Range Manag. Arch.
2003, 56, 146–151. [CrossRef]
27. Kruskal, W.H.; Wallis, W.A. Use of ranks in one-criterion variance analysis. J. Am. Stat. Assoc. 1952, 47, 583–621. [CrossRef]
28. Bhattrai, S. Evaluating the Use of Small Ruminants in Woodlnds: Behavior, Performance, and Ecosystem Impacts. Master’s
Thesis, Tuskgee University, Tuskegee, AL, USA, 2019.
29. Bartolomé, J.; Franch, J.; Plaixats, J.; Seligman, N. Diet selection by sheep and goats on Mediterranean heath-woodland range.
Rangel. Ecol. Manag. J. Range Manag. Arch. 1998, 51, 383–391. [CrossRef]
30. Vallentine, J.F. Grazing Management; Elsevier: Amsterdam, The Netherlands, 2000.
31. Landsberg, J.; Stol, J. Spatial distribution of sheep, feral goats and kangaroos in woody rangeland paddocks. Rangel. J. 1996, 18,
270–291. [CrossRef]
32. NRC. Nutrient Requirements of Small Ruminants: Sheep, Goats, Cervids, and New World Camelids; National Academy Press: Washing-
ton, DC, USA, 2007.
33. Poudel, S.; Karki, U.; Karki, Y.; Tillman, A. Confinement influenced the diurnal behavior of Katahdin rams and Kiko wethers in
southern-pine silvopastures. Agrofor. Syst. 2020, 94, 29–40. [CrossRef]
34. Lin, L.; Dickhoefer, U.; Müller, K.; Susenbeth, A. Grazing behavior of sheep at different stocking rates in the Inner Mongolian
steppe, China. Appl. Anim. Behav. Sci. 2011, 129, 36–42. [CrossRef]
35. Stachowicz, J.; Lanter, A.; Gygax, L.; Hillmann, E.; Wechsler, B.; Keil, N.M. Under temperate weather conditions, dairy goats
use an outdoor run more with increasing warmth and avoid light wind or rain. J. Dairy Sci. 2019, 102, 1508–1521. [CrossRef]
[PubMed]
36. Butler, L.; Cropper, J.; Johnson, R.; Norman, A.; Peacock, G.; Shaver, P.; Spaeth, K. National Range and Pasture Handbook; USDA
National Resources Conservation Service: Washington, DC, USA, 2003; p. 214.
37. Orihuela, A.; Solano, J.J. Grazing and browsing times of goats with three levels of herbage allowance. Appl. Anim. Behav. Sci.
1999, 61, 335–339. [CrossRef]
38. Pande, R.S.; Kemp, P.D.; Hodgson, J. Preference of goats and sheep for browse species under field conditions. N. Z. J. Agric. Res.
2002, 45, 97–102. [CrossRef]
39. Ngwa, A.T.; Pone, D.K.; Mafeni, J.M. Feed selection and dietary preferences of forage by small ruminants grazing natural pastures
in the Sahelian zone of Cameroon. Anim. Feed Sci. Technol. 2000, 88, 253–266. [CrossRef]Forests 2021, 12, 205 16 of 16
40. Animut, G.; Goetsch, A. Co-grazing of sheep and goats: Benefits and constraints. Small Rumin. Res. 2008, 77, 127–145. [CrossRef]
41. Anderson, G.; Hawke, M.; Moore, R. Pine needle consumption and bark stripping by sheep grazing annual pastures in young
stands of widely spaced Pinus radiata and P. pinaster. Agrofor. Syst. 1985, 3, 37–45. [CrossRef]You can also read