Using Deep Learning to Correlate Reddit Posts with Economic Time Series during the COVID-19 Pandemic
←
→
Page content transcription
If your browser does not render page correctly, please read the page content below
Using Deep Learning to Correlate Reddit Posts with Economic Time Series during
                          the COVID-19 Pandemic
                                                  Philip Hossu∗ and Natalie Parde
                                                   Department of Computer Science
                                                   University of Illinois at Chicago
                                                    {phossu2, parde}@uic.edu

                             Abstract                                            • We create a novel dataset of 667 posts from
                                                                                   r/personalfinance annotated with fine-grained cat-
        The COVID-19 pandemic produced uniquely un-                                egories corresponding to types of employment inquiries.
        stable financial conditions that permeated many
        sectors of the economy, creating complex chal-                           • We build a CNN-based model to discriminate between
        lenges for existing financial models. In this in-                          unemployment categories, achieving a binary classifica-
        vestigation we tackle a subset of these challenges,                        tion F1 score of 0.857.
        seeking to determine the relationship between Red-                       • We compute correlation scores between our model pre-
        dit posts and actual economic time series during                           dictions and real-world employment data, achieving
        the economically tumultuous year of 2020. More                             strong Pearson’s correlation scores of 0.796 and 0.747
        specifically, we compute correlation between lan-                          for initial claims and continuing claims, respectively.
        guage used in Reddit’s /r/personalfinance fo-
                                                                                To enable replication and encourage additional follow-up
        rum and initial or continuing unemployment claims
                                                                             work, we make our data available upon request. The remain-
        in the United States throughout the year. We col-
                                                                             der of this paper is organized as follows. We begin by present-
        lect a novel dataset for the task, complete with an-
                                                                             ing a brief summary of related work which served as inspira-
        notations distinguishing between unemployment-
                                                                             tion. We then describe our data collection and annotation pro-
        specific and general employment inquiries. We
                                                                             cedure, as well as define and discuss training procedures for a
        also train a Convolutional Neural Network (CNN)
                                                                             CNN classification model. Predictions from the top perform-
        based deep learning model to distinguish between
                                                                             ing model are subsequently extended to the full year of data,
        these categories, achieving a maximum F1 score of
                                                                             enabling us to compute correlations with real unemployment
        0.857. Finally, we compute Pearson correlation co-
                                                                             economic time series, focusing on both initial and continu-
        efficients between these model predictions and real-
                                                                             ing claims in the USA. We analyze and discuss these results
        world financial data relative to a number of reason-
                                                                             before commenting on intriguing future work directions.
        able baselines, yielding correlations of up to 0.796
        for initial claims and 0.747 for continuing claims.
                                                                             2       Related Work
                                                                             Although a historically less utilized platform than Twitter in
1       Introduction                                                         academic works, Reddit contains a wealth of data in the mod-
The ever-increasing amount of online social media data,                      ern online social network age. Reddit reportedly has around
paired with recent advances in deep learning and natural                     430 million active users,2 with just under 50% of these users
language processing, enables a new generation of analy-                      being based in the United States,3 our target country for this
sis previously unattainable for analyzing public response                    investigation. The primary advantage of using Reddit data
to a global pandemic and consequent financial crisis. In                     for analysis and modeling in the context of the work pre-
this investigation, we seek to shed light on how a specific                  sented here is that users can opt in to various topic-focused
subset of social media data can be used to draw parallels                    discussion forums, ranging from general topics like /r/food
with real world economic trends. We select unemployment                      or /r/music, to specific topic forums like /r/whitesox or
data for our case study. Our work leverages a deep learn-                    /r/CHIcubs, giving researchers a significant amount of flex-
ing model to discover strong correlations between Reddit’s1                  ibility to investigate topics.
/r/personalfinance posts and actual initial and continu-                        Within natural language processing research settings, the
ing unemployment metrics in the United States during the                     use of Reddit has been slowly increasing in popularity, with
anomalous, turbulent COVID-19 year of 2020. Our contri-                          2
butions are as follows:                                                           https://www.statista.com/statistics/272014/global-social-netwo
                                                                             rks-ranked-by-number-of-users/
    ∗                                                                           3
        Contact Author                                                            https://www.statista.com/statistics/325144/reddit-global-activ
    1
        https://www.reddit.com                                               e-user-distribution/

                                                                           8
                                 Proceedings of the Third Workshop on Financial Technology and Natural Language Processing
                                                  (FinNLP@IJCAI 2021), pages 8-14, Online, August 19, 2021.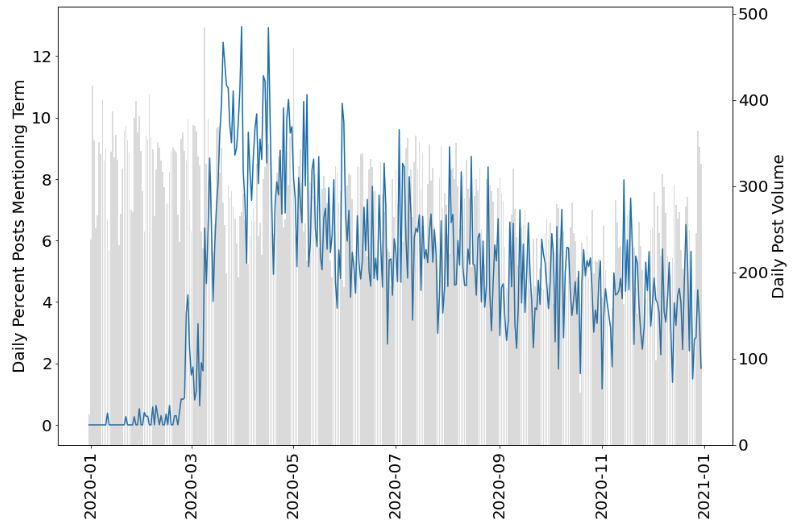
recent studies leveraging Reddit data for mental health dis-                       – Job seekers posting questions related to filling in
course analysis [Choudhury and De, 2014; Valizadeh et                                unemployment assistance forms
al., 2021], psychological personality prediction of users                          – Individuals asking about late or missed unemploy-
[Gjurković and Šnajder, 2018], and even recent COVID-                              ment assistance payments
19 symptom and sentiment detection [Murray et al., 2020].                 • Cut/Furlough (C): Individuals who are furloughed or
From an economic or financial perspective, one clear and                    who have had hours or pay cut. Their employee status
prevalent use of social media text in academic research has                 is limited, but they have not been fully laid-off. Other
been that of analyzing crowd sentiment for investment and                   examples may include:
trading strategies, whether related to equities or other asset
classes. One recent example of this is the work of Wooley et                       – Company offering to bring back employees for re-
al. (2019), where the authors focus on a number of research                          duced pay
questions revolving around cryptocurrency trading prices and                       – Individuals filing for unemployment after being
related Reddit discussion boards. The results and discussion                         only temporarily let go
from these and other works support our notion of using Reddit             • Employment (E): Currently employed individuals who
as a data source in our case study of unemployment analysis.                have questions about their current employment or a new
   The /r/personalfinance sub-reddit specifically has in-                   employment offer; or, currently employed individuals
deed seen some limited mention in academic works; however,                  debating leaving their current job for another job. Other
these works have largely been geared towards psychological                  examples may include:
mental health assessment of online users. Two such works are
those of Shen and Rudzicz (2017) and Low et al. (2020), both                       – Adding a part-time job
which directly reference data from /r/personalfinance in                           – Considering or negotiating an offer while currently
their work — but as a control sub-reddit, rather than a target                       employed
for determining anxiety or mental health.                                 • Other (O): Individuals not fitting in categories U/C/E,
                                                                            or hypothetical questions. Other examples may include:
3       Dataset
                                                                                   – Students having part-time on-campus jobs
We systematically collected data from Reddit since no exist-                       – Individuals willingly quitting their job while show-
ing datasets were available for our specific needs, and we uti-                      ing no obvious signs of financial need
lized existing unemployment data from official government
sources. The following subsections explain this process in                 To compute inter-annotator agreement, a shared set of 100
greater detail.                                                         data samples of the “employment” tagged posts were double-
                                                                        annotated by two U.S. born, English speaking, graduate-level
3.1       Text Data Collection                                          college-educated individuals, which we determined was suf-
Reddit post data was collected using the PushShift li-                  ficient background to accurately interpret English social me-
brary [Baumgartner et al., 2020] in Python 3 from the                   dia posts. One of the annotators was an author of this paper,
/r/personalfinance sub-reddit using a search query from                 and the other was an external volunteer. Following a training
January 1 to December 31 of 2020. Reddit’s API guidelines4              phase that involved iterating on the annotation guide to im-
allow for the collection and use of this data. While this API           prove clarity, particularly with respect to vague edge cases,
returns a sample of all posts, we filtered out any posts which          a Cohen’s Kappa score of 0.88 was obtained, which denotes
had been removed from the site for any reason in order to re-           substantial agreement [Landis and Koch, 1977]. Given this
spect the decision and privacy of users and site moderators.            quantitative measure of confidence in the annotation guide,
Similarly, we made the choice to not analyze any personal               the remaining instances were single-annotated. The final
information related to the posters themselves. This yielded             dataset comprised 667 instances.
a total of 99,282 posts. One of the aspects which makes this
sub-reddit especially interesting and useful for analysis is that       3.3      Unemployment Data
a vast majority of posts are user-tagged with pre-defined cate-         Unemployment time series data was obtained from one pri-
gories, like “investing” or, more relevantly in this work, “em-         mary source — the St. Louis Federal Reserve’s F.R.E.D.
ployment” (4935 posts).                                                 (Federal Reserve Economic Data) portal.5 Both raw weekly
                                                                        initial (“ICSA”) and continuing claims (“CCSA”) data are
3.2       Annotation                                                    available for public download. Initial claims refers to a gov-
For our predictive model and ultimate unemployment time                 ernment tally of individuals seeking unemployment assis-
series correlation, we labeled a sample of posts which were             tance for the first time, whereas continuing claims refers to
poster-tagged with “employment.” Our annotation scheme is               the number of people who have already filed an initial claim,
as follows:                                                             and after a week of joblessness, must continue filing claims
   • Unemployment (U): Individuals who are obviously un-                for government aid. To maintain temporal alignment with
     employed, recently laid-off, and who have questions                our Reddit posts, we downloaded unemployment data corre-
     about their unemployment (e.g., regarding government               sponding to the time frame from January 1 to December 31
     benefits or otherwise). Other examples may include:                of 2020, yielding 52 data points.
    4                                                                      5
        https://www.reddit.com/wiki/api-terms                                  https://fred.stlouisfed.org

                                                                    9
Figure 1: Post frequency on /r/personalfinance ranging from (a) COVID-19
January 1, 2020, through December 31, 2020.
Word Occurrences Word Occurrences
would 75065 know 32276
i’m 58644 year 32244
credit 55896 account 31759
get 51274 want 30928
pay 49026 years 28186
money 43567 make 28047
like 41422 loan 27515
Table 1: The most frequent words appearing in
/r/personalfinance posts during the year 2020, after re- (b) Unemployment
moving stopwords.
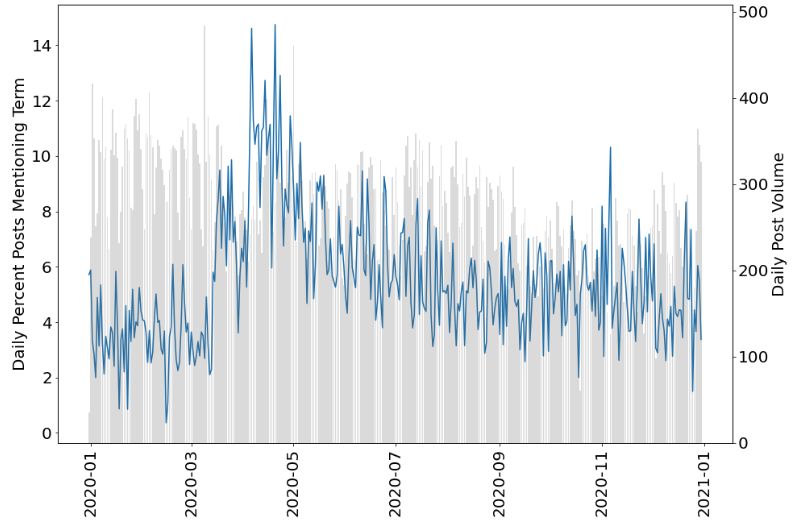
Figure 2: In blue, the line tracks the daily percentage of posts match-
3.4 Exploratory Data Analysis ing queries corresponding to (a) COVID-19 or (b) unemployment
during the year 2020. In grey, the bars indicate the overall post vol-
We conducted exploratory, descriptive analyses of our data ume and frequency over the same time period.
and outline a few findings in this subsection. Figure 1 shows
post frequency over time on /r/personalfinance during
our data collection range. We note the somewhat downward It is interesting to visually note the steadily decreasing fre-
trajectory of this data, with a notable lower volume of posts quency of COVID-19 words after the initial spike — and
around November. overall relative infrequency of these keywords with a max-
Considering post title and text, we observe word count dis- imum of around 12% of posts — despite what we know to
tributions (min, max, mean) for titles as (1, 41, 6.24) and be the actual prevalence of COVID-19 cases in the United
texts as (0, 2897, 83.92), after removing stopwords using States,6 shown in Figure 3.
the NLTK stopwords list [Bird et al., 2009]. Also exclud-
ing stopwords, we report the most frequent post text words 4 Methods & Models
in Table 1. We note that some common words among those For the task of correlating our /r/personalfinance posts
that are most frequent are indicative of the underlying ques- with initial and continuing unemployment claims, we experi-
tion/answer style of the posts, like “i’m,” “like,” “know,” ment with different iterations of a CNN deep learning model.
“want,” etc. Our model structure is influenced heavily by Semeval 2017’s
Finally, we implemented a series of functions to com- Task 5 [Cortis et al., 2017], which focused on sentiment scor-
pute the post frequency with title or text matching a set of ing of financial headlines. More specifically, we draw inspi-
query words. Figure 2 shows two queries — (a) for a set of ration from the works of Mansar et al. (2017) and Kar et
COVID-19 related keywords {covid, covid19, coronavirus, al. (2017), which experimented with various deep learning
virus, corona, covid-19, 2019-ncov, 2019ncov, sars-cov-2, models and word embeddings to achieve the top two scoring
sarscov2}, and (b) for a set of unemployment related key- results.
words {unemployed, laid-off, layoff, layoffs, unemployment, The primary advantage of using a simple CNN for our pro-
benefits}. In both plots, the blue line denotes the daily per- totype model is that these models can work effectively on
cent of posts matching one of these query terms, and the back-
6
ground grey bars reiterate the post volume and frequency. https://covid.cdc.gov/covid-data-tracker/
10Row Model Macro F1 Weighted F1 Details
TB1 Random Forest 0.710 (0.323) 0.772 (0.443) GloVe 300, Stopword Removal, Regex
TB2 Logistic Regression 0.772 (0.443) 0.796 (0.481) GloVe 300, Stopword Removal, Regex
TB3 Linear SVM 0.792 (0.509) 0.814 (0.545) GloVe 300, Stopword Removal, Regex
CNN1 CNN 0.807 0.823 GloVe 300
CNN2 CNN 0.837 (0.544) 0.857 (0.598) GloVe 300, Stopword Removal, Regex
CNN3 CNN 0.821 0.844 GloVe 300, Stopword Removal, Regex, VADER
Table 2: Model Training Results: Two-Class F1 (Four-Class F1). Two-class F1 refers to the F1 results achieved under a simplified two-class
labeling scheme that merges U+C and E+O into two broad categories, whereas four-class F1 (in parentheses) reports F1 results under the
original labeling scheme that considers U, C, E, and O all as separate classes.
ters.
• CNN3: Our CNN model with all of the preprocessing
steps applied in CNN2. Additionally, post-level VADER
[Hutto and Gilbert, 2014] sentiment scores were con-
catenated to the output of the max pooling layer.
These conditions are further described in Table 2, and ad-
ditional feature details are provided in §4.2. Scikit-Learn [Pe-
dregosa et al., 2011] was the primary package for implement-
ing the classical machine learning models (TB1, TB2, and
TB3), and Keras [Chollet and others, 2015] was the primary
package for implementing the CNN models (CNN1, CNN2,
and CNN3). CNN models were trained using stochastic gra-
Figure 3: Daily COVID-19 cases in the United States during the year dient descent and a learning rate of 0.0001, for 150 training
2020, reported by the CDC. epochs. For all models, text input consisted of the post title
concatenated with the first 25 words of the post text, encoded
using pretrained 300-dimensional GloVe embeddings trained
small datasets, having fewer parameters to train than Recur- on Wikipedia 2014 and Gigaword 5 [Pennington et al., 2014].
rent Neural Network-based models. This is important since
our access to supervised training data is limited to the small- 4.1 Model Evaluation
scale corpus developed specifically for this work. A worth-
while side benefit of using more efficient models is that train- Results of our model comparison are shown in Table 2. We
ing time is cut down significantly, which makes a noteworthy evaluate models using macro and weighted F1 scores (har-
difference in our training setting — a 2011 Mac Mini with monic mean of precision and recall), computed using Scikit-
16gb of memory and a dual-core i5 processor. Our model Learn. Non-parenthesized scores report model performance
contains the following layer structure: (1) Convolution 1D, on a simplified two-class labeling scheme where we com-
(2) Max Pool, (3) Dense F.C., (4) Dropout, (5) Dense F.C., bined U+C and E+O posts into two distinct categories. The
(6) Dropout, (7) Softmax Output. motivation behind this decision was an unfortunate and sig-
All models were trained and evaluated using randomly as- nificant class imbalance — our dataset distribution was ulti-
signed 90/10 train/test splits. We compared six conditions, mately 19.8% U, 12.2% C, 50.1% E, and 17.1% O. While
three of which were classical machine learning models (con- clearly not empty, there simply were not as many posts in
sidered as baseline alternatives) and three of which were vari- our target categories of interest, U and C, as we expected.
ations of our CNN architecture with different training or pre- Four-class classification scores are also reported for our top
processing settings: performing model in row CNN2, as well as our baseline mod-
els, enclosed in parentheses. All four-class scores are notably
• TB1: A random forest classification model [Ho, 1995]. lower than the two-class scores.
• TB2: A logistic regression classification model [McCul-
lagh and Nelder, 1989]. 4.2 Ablation Studies
• TB3: A linear support vector machine (SVM) classifi- In our CNN conditions, we experimented with a variety
cation model [Boser et al., 1992]. of settings to assess the utility of preprocessing steps and
lexicon-based features (i.e., sentiment scores), with these set-
• CNN1: Our CNN model with no extra preprocessing tings represented as CNN1, CNN2, and CNN3. To incorpo-
steps. rate sentiment scores into the model, we concatenated post-
• CNN2: Our CNN model with stopword removal, as well wise VADER sentiment lexicon scores [Hutto and Gilbert,
as regular expression-based removal of special charac- 2014] to the output of the max pooling layer, similar to that
11Row Item 1 Item 2 r
Frequency of Tagged
R1 Initial Claims 0.560
Employment Posts
Frequency of Tagged Continued
R2 0.309
Employment Posts Claims
Keyword
R3 Initial Claims 0.796
Unemployment Post %
Keyword Continued
R4 0.701
Unemployment Post % Claims
CNN U/C Predicted
R5 Initial Claims 0.691
Posts
CNN U/C Predicted Continued
R6 0.747
Posts Claims (a) Initial Claims (orange)
Table 3: Pearson correlation coefficients computed between model
predictions on /r/personalfinance unemployment posts (Item 1)
and official initial and continued unemployment claims (Item 2).
done by Mansar et al. (2017). Contrary to our expectations,
this did not consistently improve model performance, yield-
ing a weighted F1 score of 0.844 which is lower than the per-
formance without VADER scores (CNN2).
However, it was clear from our comparison that the task
benefited from some basic text preprocessing steps. In CNN2,
stopwords were removed using NLTK [Bird et al., 2009]
and regular expressions were utilized to remove special char-
acters such as commas and dashes, whereas in CNN1 no
preprocessing steps were performed. CNN2 outperformed
CNN1; moreover, these actions lowered the number of miss- (b) Continuing Claims (red)
ing words encountered by our pretrained GloVe embedding
model (13.56% originally, reduced to 1.50%). Figure 4: Relationship between CNN model predictions (blue) and
official unemployment trends (orange or red, corresponding to initial
or continuing claims, respectively).
5 Results & Discussion
Extending the predictions of our top performing model to
the entire set of “employment” /r/personalfinance posts, content, simply does not as closely reflect initial unemploy-
we computed correlation with official initial and continuing ment metrics. On the other hand, our CNN model predic-
unemployment claims to assess sub-reddit posting behaviors tions of the Unemployment/Cut merged class correlate better
with respect to real-world financial trends. Pearson corre- with continuing unemployment claims than the alternative ap-
lation coefficients (r) were computed using the Stats mod- proaches, at a value of 0.747. The correlations between our
ule of Scipy [Virtanen et al., 2020] and are shown in Table CNN model predictions and real-world unemployment trends
3. Item 1 in the table corresponds to the condition used to are illustrated through the plots in Figure 4.
predict (un)employment, and Item 2 corresponds to the data Visually, it is clear that the elongated peak of the CNN pre-
with which it was correlated (either Initial Claims or Contin- dictions around April and May (shown in blue) match up bet-
uing Claims). Rows R1 & R2 show baseline results which ter with continuing claims (red) than with initial claims (or-
consider the frequency or volume of posts self-tagged with ange). Qualitatively, this behavior appears reasonable given
“employment.” Rows R3 & R4 show the correlation results the context of the online forum — in fact, with almost all
when considering the unemployment keyword percentages posts being question/answer focused, we observed this same
from Figure 2(b). Rows R5 & R6 show the CNN predicted pattern while annotating posts. Individuals seemed relatively
U/C class. All “Item 1” data is aggregated weekly to match unlikely to post immediately after being laid-off with ques-
up with the 52 weeks of “Item 2” data. tions about filing for unemployment. Instead, for unemploy-
We observe that the strongest correlation with initial claims ment related inquiries we observed notably higher frequency
stems from the simple keyword search (described in §3.4) of individuals asking questions about events within the last
at a value of 0.796. This does not necessarily indicate poor month or so. These posts frequently referenced mistakes
performance from our model, which achieved a lower score made on unemployment filing forms, for example by asking
at 0.691. Rather, we speculate that the way in which cat- how long they needed to wait before they received their first
egories were defined, mixed with the actual sub-reddit post assistance payment after filing.
126 Summary, Conclusion & Future Work lyzing text with the natural language toolkit. ” O’Reilly
In this work, we successfully obtained strong correlation Media, Inc.”, 2009.
with official unemployment statistics during the economi- [Boser et al., 1992] Bernhard E. Boser, Isabelle M. Guyon,
cally anomalous year of 2020. We contributed a new dataset and Vladimir N. Vapnik. A training algorithm for opti-
of r/personalfinance posts labeled with Unemployment, mal margin classifiers. In Proceedings of the Fifth Annual
Cut/Furlough, Employment, and Other designations. We then Workshop on Computational Learning Theory, COLT ’92,
trained a number of machine learning models on this data, page 144–152, New York, NY, USA, 1992. Association
including both classical baselines (Random Forest, Logistic for Computing Machinery.
Regression, Linear SVM) as well as a more advanced CNN
model, which achieved a best weighted F1 score of 0.857 on [Chollet and others, 2015] François Chollet et al. Keras. ht
two-class classification of posts. These predictions were ex- tps://github.com/fchollet/keras, 2015.
tended to the full slice of user “employment” tagged posts. [Choudhury and De, 2014] Munmun De Choudhury and
We then computed correlation between these predictions and Sushovan De. Mental Health Discourse on reddit: Self-
initial and continuing unemployment claims, sourced from Disclosure, Social Support, and Anonymity. Proceedings
the St. Louis Federal Reserve, relative to two baselines (fre- of the International AAAI Conference on Web and Social
quency of posts tagged with “employment,” and unemploy- Media, 8(1), May 2014.
ment keyword percent search). Our experiments yielded top
correlations of 0.796 for initial claims and 0.747 for contin- [Cortis et al., 2017] Keith Cortis, André Freitas, Tobias
uing claims. We make our data and source code available to Daudert, Manuela Huerlimann, Manel Zarrouk, Siegfried
the research community to foster additional work in this area Handschuh, and Brian Davis. SemEval-2017 task 5: Fine-
and to facilitate replication. grained sentiment analysis on financial microblogs and
With respect to future work directions, on a micro level, news. In Proceedings of the 11th International Workshop
there are clear next steps which could be taken to encourage on Semantic Evaluation (SemEval-2017), pages 519–535,
improved performance. Our current models serve as a pro- Vancouver, Canada, August 2017. Association for Com-
totype, with the primary objective being to establish proof putational Linguistics.
of concept rather than achieve state of the art performance. [Devlin et al., 2019] Jacob Devlin, Ming-Wei Chang, Ken-
While our methodology for training the CNN model was ef- ton Lee, and Kristina Toutanova. BERT: Pre-training
ficient and F1 scores indicate that the model structure and of Deep Bidirectional Transformers for Language Under-
inputs were enough to achieve strong performance measures, standing. arXiv:1810.04805 [cs], May 2019. arXiv:
extending model input to include longer word sequences or 1810.04805.
further expanding our labeled dataset could similarly help to
achieve higher performance. This could also enable the use of [Gjurković and Šnajder, 2018] Matej Gjurković and Jan
more advanced machine learning models like gated recurrent Šnajder. Reddit: A Gold Mine for Personality Prediction.
units (GRUs), long short-term memory networks (LSTMs), In Proceedings of the Second Workshop on Computational
or BERT/Transformer-based models [Devlin et al., 2019], Modeling of People’s Opinions, Personality, and Emotions
which we largely avoided due to the small size of our labeled in Social Media, pages 87–97, New Orleans, Louisiana,
data sample. USA, June 2018. Association for Computational Linguis-
On a macro level, this study provides an interesting tics.
case study towards harnessing natural language in Reddit [Ho, 1995] Tin Kam Ho. Random decision forests. In Pro-
posts for economic time series correlation, specifically fo- ceedings of 3rd International Conference on Document
cused on unemployment and the COVID-19 pandemic in Analysis and Recognition, volume 1, pages 278–282 vol.1,
the USA. However, further work could consider including 1995.
a larger time frame to encompass non-pandemic phenomena
as well. Even within the context of our specific sample of [Hutto and Gilbert, 2014] Clayton J. Hutto and Eric Gilbert.
/r/personalfinance data, there is still ample room to ex- Vader: A parsimonious rule-based model for sentiment
plore and analyze altogether different time series, as there is analysis of social media text. In Eytan Adar, Paul Resnick,
no shortage of user-tagged posts covering a diverse range of Munmun De Choudhury, Bernie Hogan, and Alice H. Oh,
topics including “retirement,” “housing,” “investing,” “auto,” editors, ICWSM. The AAAI Press, 2014.
and others, offering a productive starting point for follow-up [Kar et al., 2017] Sudipta Kar, Suraj Maharjan, and Thamar
work. Solorio. RiTUAL-UH at SemEval-2017 Task 5: Senti-
ment Analysis on Financial Data Using Neural Networks.
References In Proceedings of the 11th International Workshop on Se-
[Baumgartner et al., 2020] Jason Baumgartner, Savvas Zan- mantic Evaluation (SemEval-2017), pages 877–882, Van-
nettou, Brian Keegan, Megan Squire, and Jeremy Black- couver, Canada, August 2017. Association for Computa-
burn. The Pushshift Reddit Dataset. arXiv:2001.08435 tional Linguistics.
[cs], January 2020. arXiv: 2001.08435. [Landis and Koch, 1977] J. Richard Landis and Gary G.
[Bird et al., 2009] Steven Bird, Ewan Klein, and Edward Koch. The Measurement of Observer Agreement for Cat-
Loper. Natural language processing with Python: ana- egorical Data. Biometrics, 33(1):159–174, 1977.
13[Low et al., 2020] Daniel M. Low, Laurie Rumker, Tanya Kern, Eric Larson, C J Carey, İlhan Polat, Yu Feng,
Talkar, John Torous, Guillermo Cecchi, and Satrajit S. Eric W. Moore, Jake VanderPlas, Denis Laxalde, Josef
Ghosh. Natural Language Processing Reveals Vul- Perktold, Robert Cimrman, Ian Henriksen, E. A. Quintero,
nerable Mental Health Support Groups and Heightened Charles R. Harris, Anne M. Archibald, Antônio H.
Health Anxiety on Reddit During COVID-19: Obser- Ribeiro, Fabian Pedregosa, Paul van Mulbregt, and SciPy
vational Study. Journal of Medical Internet Research, 1.0 Contributors. SciPy 1.0: Fundamental Algorithms
22(10):e22635, October 2020. for Scientific Computing in Python. Nature Methods,
[Mansar et al., 2017] Youness Mansar, Lorenzo Gatti, Sira 17:261–272, 2020.
Ferradans, Marco Guerini, and Jacopo Staiano. Fortia- [Wooley et al., 2019] Stephen Wooley, Andrew Edmonds,
FBK at SemEval-2017 Task 5: Bullish or Bearish? In- Arunkumar Bagavathi, and Siddharth Krishnan. Extract-
ferring Sentiment towards Brands from Financial News ing cryptocurrency price movements from the reddit net-
Headlines. In Proceedings of the 11th International Work- work sentiment. In 2019 18th IEEE International Con-
shop on Semantic Evaluation (SemEval-2017), pages 817– ference On Machine Learning And Applications (ICMLA),
822, Vancouver, Canada, August 2017. Association for pages 500–505, 2019.
Computational Linguistics.
[McCullagh and Nelder, 1989] Peter McCullagh and
John A. Nelder. Generalized Linear Models, Second Edi-
tion. Chapman and Hall/CRC Monographs on Statistics
and Applied Probability Series. Chapman & Hall, 1989.
[Murray et al., 2020] Curtis Murray, Lewis Mitchell,
Jonathan Tuke, and Mark Mackay. Symptom extraction
from the narratives of personal experiences with COVID-
19 on Reddit. arXiv:2005.10454 [cs, stat], May 2020.
arXiv: 2005.10454.
[Pedregosa et al., 2011] F. Pedregosa, G. Varoquaux,
A. Gramfort, V. Michel, B. Thirion, O. Grisel, M. Blon-
del, P. Prettenhofer, R. Weiss, V. Dubourg, J. Vanderplas,
A. Passos, D. Cournapeau, M. Brucher, M. Perrot, and
E. Duchesnay. Scikit-learn: Machine learning in Python.
Journal of Machine Learning Research, 12:2825–2830,
2011.
[Pennington et al., 2014] Jeffrey Pennington, Richard
Socher, and Christopher Manning. GloVe: Global Vectors
for Word Representation. In Proceedings of the 2014
Conference on Empirical Methods in Natural Language
Processing (EMNLP), pages 1532–1543, Doha, Qatar,
October 2014. Association for Computational Linguistics.
[Shen and Rudzicz, 2017] Judy Hanwen Shen and Frank
Rudzicz. Detecting Anxiety through Reddit. In Proceed-
ings of the Fourth Workshop on Computational Linguis-
tics and Clinical Psychology — From Linguistic Signal
to Clinical Reality, pages 58–65, Vancouver, BC, August
2017. Association for Computational Linguistics.
[Valizadeh et al., 2021] Mina Valizadeh, Pardis Ranjbar-
Noiey, Cornelia Caragea, and Natalie Parde. Identify-
ing medical self-disclosure in online communities. In
Proceedings of the 2021 Annual Conference of the North
American Chapter of the Association for Computational
Linguistics (NAACL 2021), Online, 2021. Association for
Computational Linguistics.
[Virtanen et al., 2020] Pauli Virtanen, Ralf Gommers,
Travis E. Oliphant, Matt Haberland, Tyler Reddy, David
Cournapeau, Evgeni Burovski, Pearu Peterson, Warren
Weckesser, Jonathan Bright, Stéfan J. van der Walt,
Matthew Brett, Joshua Wilson, K. Jarrod Millman, Niko-
lay Mayorov, Andrew R. J. Nelson, Eric Jones, Robert
14You can also read