Using aircraft location data to estimate current economic activity - Nature
←
→
Page content transcription
If your browser does not render page correctly, please read the page content below
www.nature.com/scientificreports

            OPEN           Using aircraft location data to
                           estimate current economic activity
                                           1,2 ✉                                1,2                     1,2
                           Sam Miller           , Helen Susannah Moat                 & Tobias Preis

                           Aviation is a key sector of the economy, contributing at least 3% to gross domestic product (GDP) in
                           the UK and the US. Currently, airline performance statistics are published with a three month delay.
                           However, aircraft now broadcast their location in real-time using the Automated Dependent Surveillance
                           Broadcast system (ADS-B). In this paper, we analyse a global dataset of flights since July 2016. We first
                           show that it is possible to accurately estimate airline flight volumes using ADS-B data, which is available
                           immediately. Next, we demonstrate that real-time knowledge of flight volumes can be a leading
                           indicator for aviation’s direct contribution to GDP in both the UK and the US. Using ADS-B data could
                           therefore help move us towards real-time estimates of GDP, which would equip policymakers with the
                           information to respond to shocks more quickly.

                           Most economic statistics, such as GDP, are released with a significant delay. Estimating their current values before
                           they are published is known as “nowcasting”1. Previous studies have used real-time internet data, from sources
                           such as Google2–6, Twitter7,8 and Wikipedia9,10, to nowcast economic data. Better nowcasts are highly valuable, as
                           major economic policy tools such as interest rates can take up to 20 months to fully impact the economy11. When
                           faced with shocks like the 2008 financial crisis, policymakers must therefore respond as quickly as possible, which
                           requires accurate knowledge of the current state of the economy. Failure to do so has deepened past recessions12,
                           leading to political instability across Europe following both the Great Depression and the 2008 financial crisis.
                              Aviation is a key economic sector, contributing at least 3% to GDP in the UK and the US13,14. Aircraft now
                           broadcast their location, among other data, in real-time using the Automated Dependent Surveillance Broadcast
                           (ADS-B) system. So far, ADS-B data has rarely been used outside its intended application in the aviation sector.
                           An exception is one study that showed that ADS-B data could track corporate jets, therefore providing a lead-
                           ing indicator for certain mergers between firms15. The current paper analyses whether ADS-B data can help
                           nowcast airline performance and aviation’s direct contribution to GDP. In contrast to real-time ADS-B data, the
                           current statistics for these variables are published with a three month delay because they require surveys of busi-
                           nesses16–19. Faster statistics could help policymakers respond more quickly to future economic shocks, thereby
                           limiting their damage.

                           Methods
                           ADS-B data. We retrieve aircraft data from the ADS-B Exchange20. Commercial aircraft in Europe have been
                           required to broadcast ADS-B data since 201721, and it has been mandatory for US aircraft since January 202022.
                           These broadcasts include the aircraft’s speed and location, specified as their altitude, latitude and longitude along-
                           side a timestamp. Each ADS-B message also includes a six-digit hex identification code assigned to the aircraft by
                           the International Civil Aviation Organisation (ICAO). Amongst other things, the ICAO code makes it possible to
                           link an aircraft to its operating airline by looking up the ICAO code in a corresponding database. This pre-pro-
                           cessing is carried out by ADS-B Exchange and the operating airline is included in each of the resulting ADS-B
                           records.
                              ADS-B messages are unencrypted, in order to be receivable by other aircraft, which means they are avail-
                           able to anyone with an ADS-B receiver. The ADS-B Exchange collects data from thousands of receivers20. The
                           resulting database covers global flight activity (Fig. 1). We analyse the period from July 2016 to December 2018.
                           We note that coverage has improved over time, as the number of receivers feeding the database has grown (see
                           Supplementary Fig. S1).
                              The raw data we analyse contains roughly 25 billion messages. First, we reduce this data from one row for each
                           message to one row for each flight. Figure 2 shows how we identify take-offs and landings by analysing the alti-
                           tude of an aircraft over time (see also Supplementary Figs. S2 to S6). Applying this method, we extract 67 million

                           1
                            Data Science Lab, Behavioural Science, Warwick Business School, University of Warwick, Scarman Road, Coventry,
                           CV4 7AL, UK. 2The Alan Turing Institute, British Library, 96 Euston Road, London, NW1 2DB, UK. ✉e-mail: smiller@
                           turing.ac.uk

Scientific Reports |   (2020) 10:7576 | https://doi.org/10.1038/s41598-020-63734-w                                                             1
www.nature.com/scientificreports/ www.nature.com/scientificreports
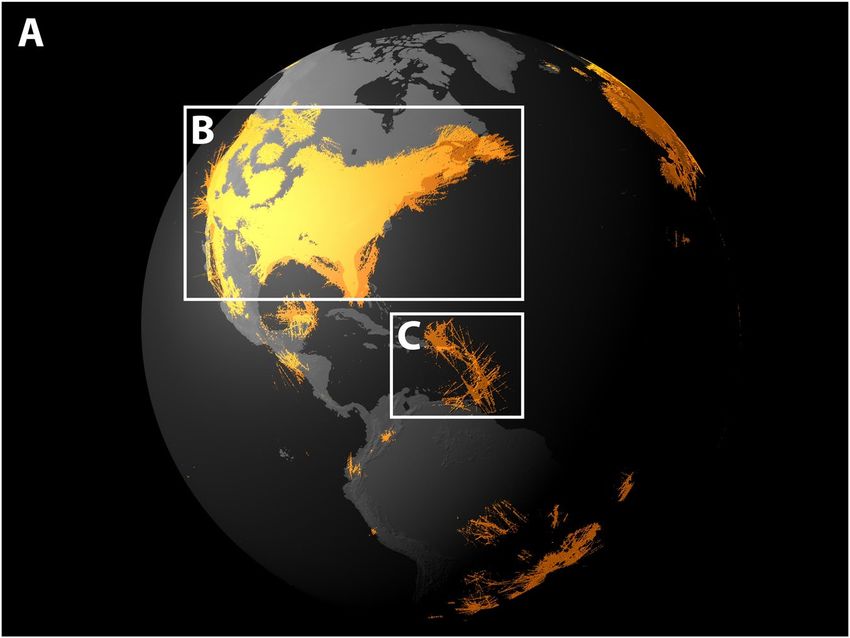
Figure 1. Recorded flight paths over the western hemisphere on 30th September 2016. (A) In orange, we
depict the locations from which at least one ADS-B message was received by the network of receivers. (B) The
network covers large parts of the United States and in particular their coastal regions. Visual inspection of the
US east coast reveals that the land-based receivers are capable of tracking air traffic over coastal waters too. (C)
In regions within coverage but with less dense air traffic flow, e.g. in the broad vicinity of the Caribbean Sea,
distinct flight routes emerge. The increase in coverage from 2016 to 2018 is shown in Supplementary Fig. S1.
The base layer of this map utilises the ALOS World 3D global digital surface model provided by the Japan
Aerospace Exploration Agency (JAXA), which is available to use with no charge via https://www.eorc.jaxa.jp/
ALOS/en/ (JAXA).
Figure 2. The flight-counting algorithm. An example of the flight-counting algorithm crawling through
altitude data from real-time ADS-B messages. The algorithm identifies a take-off and landing of six separate
flights for this aircraft over the course of a day. These form a new data structure, where we have one row for each
flight rather than one row for each ADS-B observation. In total we identify 67 million separate flights from July
2016 to December 2018.
separate flights and record their take-off and landing time as well as corresponding locations. Next, we aggregate
these flights by month and airline to generate estimates for published airline statistics. This further reduces our
dataset to 303 monthly airline flight counts for the UK, and 405 for the US. We include the largest 13 UK and 15
Scientific Reports | (2020) 10:7576 | https://doi.org/10.1038/s41598-020-63734-w 2www.nature.com/scientificreports/ www.nature.com/scientificreports
Figure 3. Comparing official aviation statistics to measures derived from ADS-B data. Plots of the percentage
change in official flight count and ADS-B flight count for six UK and US airlines. The ADS-B estimate of the
monthly change tracks the official statistics very closely, although there is some variation in accuracy across
airlines. We suggest the two most likely sources of error are the database that maps aircraft to airline, and
imperfect coverage of the ADS-B data.
US airlines, with the cut-off for airline inclusion set at 1% of total air traffic in each country. Overall, our ADS-B
data captures 83% of UK flights and 41% of US flights since July 2016.
Published aviation statistics. Both the UK16 and US18 aviation authorities publish monthly airline sta-
tistics. They contain a range of performance indicators, such as flight volume and capacity utilisation, but are
currently released with a three month delay. Figure 3 depicts the monthly percentage change in both the airline
statistics and in flight volumes calculated using the ADS-B data. Visual inspection suggests there is a strong cor-
relation. However, there is clear seasonality for both countries (see Supplementary Figs. S7 and S8). We account
for this seasonality in our later analysis.
Finally, we collect economic data from the UK Office for National Statistics (ONS)17 and US Bureau of Economic
Analysis (BEA)19. Both the ONS and BEA publish a GDP series that is split by industry, from which we consider
air transport. The UK series is a monthly time series dating back to 1997, and the US series is a quarterly time
series dating back to 2005. When analysing these series, we consider key time series properties, such as stationar-
ity, to avoid drawing misleading conclusions (see Supplementary Figs. S9 and S10).
Results
Estimating airline flight volume. For each airline, we aim to generate rapid estimates of flight volume
across time. Some airlines are much larger than others. To ensure comparability between airlines, we therefore
normalise the flight volume data by indexing the first period to each airline for 100. We then re-scale subsequent
periods so they are measured relative to the first. An airline whose original flight counts were (5000, 6000, …
6500) would be normalised to (100, 120, … 130). A normalised flight volume of 120 reflects a flight volume 20%
higher than the first period.
A reasonable baseline model would be an autoregressive (AR) model where we estimate normalised airline
flight volumes with their own history:
yi , t = α i + γt + βyi , t −3 + εi , t , (1)
where yi , t is the number of flights and εi , t is a noise term for airline i in month t. Due to the three month publica-
tion lag for the official flight volume statistics, when nowcasting the flight volume for month t we only have official
data from month t−3. The baseline therefore includes an AR(3) term, yi , t −3 and β is the weight on the AR(3) term.
We also derive binary (“dummy”) variables from the longitudinal data structure. γt are coefficients for dummy
variables for each month (12 in total), which proxy for seasonality. A positive value for γt would reflect that flight
volumes are usually higher than average in month t. α i are coefficients for 28 airline-specific dummy variables,
which capture the airline’s average growth over time. A positive value of α i would reflect an increase in the mean
flight volume for airline i across the time period.
To measure the performance boost from ADS-B data, we add this data to the baseline model. Denoting xi , t as
the ADS-B flight count for airline i in period t, and δ as the weight on the ADS-B term:
yi , t = α i + γt + δxi , t + βyi , t −3 + εi , t (2)
Scientific Reports | (2020) 10:7576 | https://doi.org/10.1038/s41598-020-63734-w 3www.nature.com/scientificreports/ www.nature.com/scientificreports
Simple Complex Simple Complex
Model UK US
Baseline adj R2 0.06 0.66 0.36 0.75
ADS-B adj R2 0.54 0.90 0.56 0.89
Number of parameters 2 27 2 29
Number of airlines 13 13 15 15
Table 1. Estimating airline flight volume: in-sample results. In-sample adjusted R2 scores from models built
to generate rapid estimates of airline flight volume. All models are unpenalised linear regressions. The baseline
model is autoregressive: it estimates the change in each airline’s monthly flights using the most recently available
flight count statistics. The ADS-B model additionally includes the ADS-B estimate of each airline’s monthly
flights as a predictor. The simple model does not include any further predictors. The complex model includes
binary variables for each airline and month, to capture seasonality and differences in airline growth across the
period. ADS-B data boosts performance across all model specifications, including against the more complex
baseline. This shows that ADS-B data can help estimate dynamic airline-specific changes in flight volume, and
does not only proxy seasonality or differences in airline growth.
Figure 4. Adaptive nowcasting of airline flight volume. We build adaptive nowcasting models23 to generate
rapid estimates of flight volume for UK and US airlines. We investigate whether models enhanced with real-
time ADS-B data deliver more accurate estimates than nowcasting models based on historic flight volume alone.
For each month t ∈ [5,T ], we fit a model with all data up to t − 1, then test performance in month t. The model
is an autoregressive linear regression penalised using LASSO and tuned through 5-fold cross-validation. (A)
Performance for the UK. (B) Performance for the US. The red series show the mean absolute error (MAE) from
the baseline model with no ADS-B data, whereas the blue series show the MAE when adding ADS-B data. We
find that including ADS-B data as a predictor improves rapid estimates of airline flight volume in both the UK
and the US.
Table 1 shows that adding ADS-B data boosts the in-sample accuracy of all baseline models, regardless of
whether month and airline dummies are included (see Supplementary Table S1 for similar results when the model
includes month dummies or airline dummies alone). This shows that ADS-B data can help estimate dynamic
airline-specific changes in flight volume, and does not only proxy seasonality or differences in airline growth.
Our results so far suggest that ADS-B improves in-sample estimates of airline flight volume. However,
in-sample scores may overstate true predictive accuracy. To assess out-of-sample performance, we use
one-step-ahead adaptive nowcasting23, originally developed to help generate rapid indicators of flu incidence
using Google search volume. For each month t in our dataset, we train the model with data from months
∈[1,t − 1]. We penalise the model’s coefficients, to avoid overfitting, using LASSO regression with 5-fold
cross-validation (see Supplementary Methods for regularising out-of-sample forecasts). The penalised model
then estimates the test month t. We record the estimate for each airline, and use the mean absolute error (MAE)
as the score for month t. As we move through the analysis period, thereby increasing t, we re-fit the model to add
new training data (hence “adaptive”). This procedure only uses past data to predict the present, so we know per-
formance is tested out-of-sample.
Scientific Reports | (2020) 10:7576 | https://doi.org/10.1038/s41598-020-63734-w 4www.nature.com/scientificreports/ www.nature.com/scientificreports
Figure 5. Adaptive nowcasting of aviation’s direct contribution to GDP. We build adaptive nowcasting models
[23] to generate rapid estimates of aviation’s direct contribution to GDP in the UK and the US. We investigate
whether models enhanced with real-time flight volume data would deliver more accurate estimates than
nowcasting models based on historic GDP data alone. Given a training window w, for each period t ∈ [w , T ] we
fit a model with all data ∈[t − w , t − 1], then test performance in period t. (A) Adding flight volume data
reduces the UK nowcast MAE by 7%. (B) Aviation’s direct contribution to UK GDP. Visual inspection suggests
that flight volume data delivers the greatest improvements in estimates during volatile economic periods, such
as the period from 2008 to 2012. (C) Similarly, adding flight volume results in the MAE decreasing by 30% in
the US. (D) Aviation’s direct contribution to GDP in the US. Again, we see that the US model is most improved
by flight volume data during the volatile economic period until 2012.
For both the UK and US, we construct a baseline adaptive nowcasting model which produces estimates for
each airline. The baseline adaptive nowcasting model contains airline dummies (see Supplementary Table S2 for
model performance with different dummy configurations). The ADS-B model adds ADS-B data to the baseline
adaptive nowcasting model.
Figure 4 depicts our adaptive nowcasting results. Adding ADS-B data reduces the MAE by 29% for the UK
(baseline MAE = 17.3, ADS-B MAE = 12.2) and 18% for the US (baseline MAE = 7.4, ADS-B MAE = 6.1). We
also show the distribution of errors for each model over time in Supplementary Fig. S11. These results hold across
a range of dummy specifications and training windows (see Supplementary Tables S2 and S3). Therefore ADS-B
data also improves out-of-sample estimates of airline flight volume.
Estimating economic activity. We next analyse whether ADS-B data may help estimate aviation’s direct contri-
bution to GDP. Both the UK and US aviation GDP series are non-stationary based on Augmented Dickey-Fuller
tests (UK: Dickey-Fuller = −1.4; US: Dickey-Fuller = −2.9; both ps > 0.05). Therefore their distributions are not
constant over time, so we cannot use them for regression. Instead, we use the rolling annual percentage change
in GDP, which deals effectively with both non-stationarity and seasonality (see Supplementary Figs. S7 to S10).
Our baseline specification for the annual percentage change in aviation’s direct contribution to GDP ∆z t is
Scientific Reports | (2020) 10:7576 | https://doi.org/10.1038/s41598-020-63734-w 5www.nature.com/scientificreports/ www.nature.com/scientificreports
∆z t = α + β ∆z t −j + εt , (3)
where εt is a noise term. There is a two month publication lag for the first complete estimate of UK GDP, and a one
quarter lag for the US. Therefore ∆z t −j is the most recent value known at month t, where j = 2 for the UK and
j = 1 for the US. The augmented model includes the rolling annual percentage change in ADS-B flight volume
∆x t :
∆z t = α + β ∆z t −j + γ ∆x t + εt (4)
The in-sample results are promising: adding ADS-B data boosts adjusted R2 from 31% to 55% for the UK and
12% to 42% for the US. However, there are only 18 monthly periods for the UK and 6 quarterly periods for the US
due to the limited time series of ADS-B data. These sample sizes are clearly too small to assess out-of-sample
performance with an adaptive nowcasting model.
We previously showed that ADS-B data could help estimate official flight volumes. To obtain greater insight
into whether ADS-B data can improve nowcasts of aviation’s direct contribution to GDP, we therefore substitute
the official airline flight volume series in place of the ADS-B data. The official airline series are available for the full
period for which we have aviation GDP data for both the UK (from 1997) and the US (from 2005). We again use
adaptive nowcasting, but with fixed training window lengths of 60 months for the UK and 8 quarters for the US
(see Supplementary Table S6 for results using other training window lengths).
Figure 5 depicts out-of-sample results for GDP estimation. Adding real-time flight volume data reduces the
MAE by 7% for the UK (baseline MAE = 4.54, ADS-B MAE = 4.22) and 30% for the US (baseline MAE = 4.65,
ADS-B MAE = 3.25). The improvement is greatest during the 2008–2010 financial crisis and the 2012 Euro crisis
(see Supplementary Table S5). This may be because the baseline AR model performs worse during volatile eco-
nomic times.
Discussion
We have assessed whether ADS-B data can help nowcast aviation statistics, which are currently published with a
three month delay. We first show that ADS-B data can accurately estimate airline performance, as measured by
their flight volume. Second, we show that real-time knowledge of flight volume is a leading indicator for aviation’s
direct contribution to GDP. We find that this indicator is of greatest value during volatile periods, such as the cri-
ses between 2008 and 2012. Crisis periods are when rapid estimates for GDP are most crucial for policymakers,
as they must take decisions quickly. In certain crises, such as disease outbreaks, real-time information on flight
volumes may also be important beyond the economic domain.
The main limitation of our analysis comes from the novelty of ADS-B data. We do not have a long enough
time series to determine whether ADS-B data, which we only had access to from July 2016 onward, can directly
nowcast GDP out-of-sample. Future work will have access to a longer ADS-B time series and could therefore
better evaluate out-of-sample performance. Continued monitoring of ADS-B data will also be important in case
its value as an economic indicator changes. For example, airlines who knew ADS-B data were being used to assess
their performance may instruct pilots to fly differently. This however seems unlikely given the probable costs of
flying more erratically. ADS-B data is therefore likely to be less prone to manipulation than other nowcasting data,
such as internet search activity.
Finally, our analysis is restricted to aviation which comprises only 3–5% of GDP in total, including indirect
contributions which are not analysed here. However, our methods could be extended to other sectors of the econ-
omy where data is shared at a similar level of granularity. As the availability of real-time data increases, we could
develop more accurate estimates of a large enough number of economic sectors to build a complete, real-time
picture of the economy. In turn, policymakers would be able to respond more effectively to future crises.
Data availability
This study was a re-analysis of existing datasets that are publicly available at the locations described in the
Methods section.
Received: 20 January 2020; Accepted: 31 March 2020;
Published: xx xx xxxx
References
1. Giannone, D., Reichlin, L. & Small, D. Nowcasting: The real-time informational content of macroeconomic data. Journal of
Monetary Economics 55, 665–676, https://doi.org/10.1016/j.jmoneco.2008.05.010 (2008).
2. Choi, H. & Varian, H. Predicting the present with Google Trends. Economic Record 88, 2–9, https://doi.org/10.1111/j.1475-
4932.2012.00809.x (2012).
3. Carrière-Swallow, Y. & Labbé, F. Nowcasting with Google Trends in an emerging market. Journal of Forecasting 32, 289–298, https://
doi.org/10.1002/for.1252 (2013).
4. Preis, T., Moat, H. S. & Stanley, H. E. Quantifying trading behavior in financial markets using Google Trends. Scientific Reports 3,
1684, https://doi.org/10.1038/srep01684 (2013).
5. Da, Z., Engelberg, J. & Gao, P. In search of attention. The Journal of Finance 66, 1461–1499, https://doi.org/10.1111/j.1540-
6261.2011.01679.x (2011).
6. Vosen, S. & Schmidt, T. Forecasting private consumption: survey-based indicators vs. Google Trends. Journal of Forecasting 30,
565–578, https://doi.org/10.1002/for.1213 (2011).
7. Bollen, J., Mao, H. & Zeng, X. Twitter mood predicts the stock market. Journal of Computational Science 2, 1–8, https://doi.
org/10.1016/j.jocs.2010.12.007 (2011).
Scientific Reports | (2020) 10:7576 | https://doi.org/10.1038/s41598-020-63734-w 6www.nature.com/scientificreports/ www.nature.com/scientificreports
8. Botta, F., Moat, H. S. & Preis, T. Quantifying crowd size with mobile phone and Twitter data. Royal Society Open Science 2, 150162,
https://doi.org/10.1098/rsos.150162 (2015).
9. Moat, H. S. et al. Quantifying Wikipedia usage patterns before stock market moves. Scientific Reports 3, 1801, https://doi.
org/10.1038/srep01801 (2013).
10. Mestyán, M., Yasseri, T. & Kertész, J. Early prediction of movie box office success based on Wikipedia activity big data. PLOS ONE
8, e71226, https://doi.org/10.1371/journal.pone.0071226 (2013).
11. Bernanke, B. S. & Gertler, M. Inside the black box: The credit channel of monetary policy transmission. Journal of Economic
Perspectives 9, 27–48, https://doi.org/10.1257/jep.9.4.27 (1995).
12. Auerbach, A. J. & Gorodnichenko, Y. Measuring the output responses to fiscal policy. American Economic Journal: Economic Policy
4, 1–27, https://doi.org/10.1257/pol.4.2.1 (2012).
13. Federal Aviation Administration. The economic impact of civil aviation on the U.S. economy. Accessible at: https://www.faa.gov/
air_traffic/publications/media/2016-economic-impact-report_FINAL.pdf (2016).
14. Oxford Economics. Economic benefits from air transport in the UK. Accessible at: https://www.oxfordeconomics.com/recent-
releases/the-economic-benefits-from-air-transport-in-the-uk (2014).
15. Strohmeier, M., Smith, M., Lenders, V. & Martinovic, I. The real first class? Inferring confidential corporate mergers and government
relations from air traffic communication. 2018 IEEE European Symposium on Security and Privacy (EuroS&P) 107–121, https://doi.
org/10.1109/EuroSP.2018.00016 (2018).
16. Civil Aviation Authority. Airline data, “Table_03_All_Services”. Accessible at: https://www.caa.co.uk/Data-and-analysis/UK-
aviation-market/Airlines/Datasets/Airline-data/.
17. Office for National Statistics. Index of Services time series, “IoS: 51: Air transport: Index-1dp”. Accessible at: https://www.ons.gov.
uk/economy/economicoutputandproductivity/output/timeseries/s2l5.
18. Bureau of Transportation Statistics. Monthly U.S. air carrier capacity and traffic data. Accessible at: https://www.bts.dot.gov/browse-
statistical-products-and-data/db20.
19. Bureau of Economic Analysis. Industry economic accounts data: value added by industry, “Air transportation”. Accessible at https://
apps.bea.gov/iTable/iTable.cfm?reqid=51step=51isuri=1table_list=1 series=q.
20. ADS-B Exchange. Accessible at: https://www.adsbexchange.com/data/.
21. European Commission. Commission Implementing Regulation (EU) No 1207/2011 of 22 November 2011 laying down requirements
for the performance and the interoperability of surveillance for the single European sky. Accessible at: https://op.europa.eu/s/n18a
(2011).
22. Federal Aviation Administration. Automatic Dependent Surveillance-Broadcast (ADS-B) Out equipment and use. Code of Federal
Regulations 14: Aeronautics and Space, §91.225, 747–748 (2011).
23. Preis, T. & Moat, H. S. Adaptive nowcasting of influenza outbreaks using Google searches. Royal Society Open Science 1, 140095,
https://doi.org/10.1098/rsos.140095 (2014).
Acknowledgements
We thank James Stanford from the ADS-B Exchange. S.M., H.S.M. and T.P. were supported by The Alan Turing
Institute under the EPSRC grant EP/N510129/1 (awards TU/B/000006 and TU/B/000008). The authors are also
grateful for support provided by the Office for National Statistics Data Science Campus.
Author contributions
S.M., H.S.M. and T.P. designed research; S.M., H.S.M. and T.P. performed research; S.M., H.S.M. and T.P. analysed
data; and S.M., H.S.M. and T.P. wrote the paper.
Competing interests
The authors declare no competing interests.
Additional information
Supplementary information is available for this paper at https://doi.org/10.1038/s41598-020-63734-w.
Correspondence and requests for materials should be addressed to S.M.
Reprints and permissions information is available at www.nature.com/reprints.
Publisher’s note Springer Nature remains neutral with regard to jurisdictional claims in published maps and
institutional affiliations.
Open Access This article is licensed under a Creative Commons Attribution 4.0 International
License, which permits use, sharing, adaptation, distribution and reproduction in any medium or
format, as long as you give appropriate credit to the original author(s) and the source, provide a link to the Cre-
ative Commons license, and indicate if changes were made. The images or other third party material in this
article are included in the article’s Creative Commons license, unless indicated otherwise in a credit line to the
material. If material is not included in the article’s Creative Commons license and your intended use is not per-
mitted by statutory regulation or exceeds the permitted use, you will need to obtain permission directly from the
copyright holder. To view a copy of this license, visit http://creativecommons.org/licenses/by/4.0/.
© The Author(s) 2020
Scientific Reports | (2020) 10:7576 | https://doi.org/10.1038/s41598-020-63734-w 7You can also read