USER HRTF SELECTION FOR 3D AUDITORY MIXED REALITY
←
→
Page content transcription
If your browser does not render page correctly, please read the page content below
U SER HRTF S ELECTION FOR 3D AUDITORY M IXED R EALITY

Rishi S HUKLA1 , Rebecca S TEWART2 , and Mark S ANDLER1
1
 Centre for Digital Music, Queen Mary University of London, London, UK
2
 Dyson School of Design Engineering , Imperial College London, London, UK

 ABSTRACT openness to environmental sound is also enabled in some
 instances. Recent evaluation of these devices has high-
We introduce a novel approach for personalisation of an lighted potential affordances and some initial interaction
efficient 3D binaural rendering system designed for mo- design recommendations. It has also introduced new work-
bile, auditory mixed reality use cases. A head-related ing definitions to distinguish the variety of hardware fea-
transfer function (HRTF) ranking method is outlined for tures and modes of experience that coexist in auditory
users of real-time, interactive sound and music applica- mixed reality (AMR), a term that ‘encapsulates any audi-
tions. Twenty participants tested the approach and its im- tory VR and AR experiences’ (i.e. forms of sonic virtual or
pact on their capacity to locate a continuous musical sound augmented reality) [6]. These technologies have recently
rendered in varying 3D positions. Analysis of HRTF rank- prompted structured experimentation with creative social
ings across three separate sessions reveal encouraging lev- gameplay [7], as well as direct industry research address-
els of reliability amongst some participants. Patterns of in- ing how audio virtual reality might be applied to music
teraction show a significant benefit to horizontal precision discovery activity [8].
that results from the selection process. In contrast, length Research into personalisation of spatial rendering for
of system exposure (rather than HRTF preference) demon- these audio-only contexts is limited. The potential bene-
strates a significant degree of improvement to aspects of fits to user orientation and sense of immersion from incor-
vertical perception and overall speed of response, with no porating HRTF personalisation have been highlighted in
detriment to horizontal accuracy. These findings provide previous spatial audio experience studies as an area requir-
an initial basis from which to consider priorities in the de- ing structured investigation [5, 9]. This paper presents and
sign of audio-only immersive applications and accompany- evaluates a method for user selection of preferred HRTF
ing methods for effective user controlled personalisation. sets via a custom binaural rendering system for mobile, in-
 teractive spatial audio. Section 2 discusses the limitations
 of prior work on HRTF selection for end-user audio-only
 1. INTRODUCTION
 contexts and specific considerations therein. Section 3 out-
Since the 1990s, sound computing research has explored lines the method conceived for 3D HRTF comparison and
spatially located interactive audio within real world con- the experimental protocol for measuring its performance.
texts. The principles and applications of binaural synthesis Results of the evaluation are presented in section 4, fol-
(i.e. 360∘ sound simulation over headphones) were given lowed by discussion of outcomes and summary conclu-
prominent discussion in Begault’s major work on 3D audio sions in sections 5 and 6.
for multimedia [1]. Bederson’s virtual tour guide presented
an early design for personalised real-time audio interven-
tion to augment physical environments [2]. Possibilities 2. BACKGROUND
for blending acoustic and digitally situated sound were HRTF sets are location dependent filters that simulate spa-
later investigated with closed-ear headphones (Cohen’s ex- tialisation of sources around a listener. HRTF sets com-
periment with artificially spatialised sound sources [3]) and prise multiple head-related impulse responses (HRIRs),
wearable speakers (Sawnhey’s Nomadic Radio [4]). which are measured within the left and right ear of a hu-
 Mobile computing has brought renewed focus on person- man or dummy head, using an excitation source placed at
alised interactive sound design that supplants or supple- incremental surrounding positions. The efficacy of HRTF
ments environmental acoustics, for example through multi- processing is dependent on both the density of the mea-
layered spatial auditory display to encourage exploration surements, and correlation between the HRIRs and fea-
of art exhibitions [5]. ‘Hearable’ headsets have further ac- tures of the listener’s morphology that affect spatial per-
celerated development. These devices feature integrated ception (chiefly the shape of their head, pinnae and upper
orientation and often positional sensing to enable immer- body) [1, 10]. Use of a generic or poorly matched HRTF
sive audio spatialisation. Direct or electronically assisted set is liable to impact sound localisation accuracy, discrim-
 ination between sources in front/behind and above/below,
Copyright: © 2021 the Authors. This is an open-access article distributed un- externalisation (i.e. sense that a sound is emanating from
der the terms of the Creative Commons Attribution 4.0 International License, which outside the lister’s head), and tonal clarity.
permits unrestricted use, distribution, and reproduction in any medium, provided the A growing body of research demonstrates the efficacy of
original author and source are credited. parametric methods for either selecting or simulating best-
fitting HRTF sets according to user morphology [11–14]. VBAP processing prior to binaural encoding. Five virtual
However, precise and reliable acquisition of anthropomet- speakers are located on the horizontal plane (0∘ elevation)
ric head, ear and torso features in the case of mobile sys- at 0∘ , -60∘ , 60∘ , 120∘ and -120∘ . Three further speakers
tem end-users is a nontrivial challenge. Selection of a are placed around the median plane (0∘ azimuth) at 90∘ (di-
best-fitting HRTF set from a database of alternatives is an- rectly above), -45∘ (below front) and -135∘ (below back).
other established strategy for customising binaural render- VBAP has been shown to render with favourable levels
ing [15, 16]. However, the latter approach – which is the of spatial and tonal consistency in this virtual configura-
area of concern for the remainder of this paper – also raises tion [28] and more generically [29]. However, specific lim-
specific design problems for the context of AMR. itations to vertical cue representation in a sparse array lay-
 out, such as that defined above, are also well known [30].
2.1 Working criteria for end user HRTF selection
The authors have previously discussed the difficulties 3. METHODOLOGY
of applying established HRTF evaluation methodologies
 A selection method was devised and evaluated against the
within an end user system [17]. Objective approaches re-
 four criteria in section 2.1. Participants undertook three
quire subjects to repeatedly identify perceived locations of
 identical study sessions (to assess reliability). In each ses-
sources placed in various spatial positions, for alternate
 sion, part one comprised of the HRTF selection procedure
HRTF sets. This is by its nature time-consuming and typ-
 (to test usability and efficiency) and part two consisted of a
ically relies on a laboratory-style format and rapid serial
 follow-up objective localisation task (to measure validity).
responses to short test signal stimuli [18–20]. Subjective
approaches, by contrast, ask users to rate the effect of alter-
 3.1 Participation
nate HRTF sets using separate criteria, such as consistency
in motion/trajectory, hemispherical distinction or degree of Twenty-one participants (aged 25-45, 6 female and 15
externalisation [21, 22]. Evidence suggests that repeatabil- male) were recruited on to the study, which was approved
ity of such qualitative judgements is contingent on listener by the Queen Mary University of London (QMUL) Ethics
expertise [23–26]. Committee (reference 2038). Each session was approxi-
 A design for HRTF selection in 2D was previously mately 45 minutes, with a minimum of 48 hours between
devised using interactive holistic A/B comparison, with sittings. Participants received £20 in compensation for
recorded music as the stimulus signal. The approach was their time at the end of their third session. All partici-
evaluated against these four criteria with encouraging out- pants were recruited via an open call to staff and doctoral
comes [17]. students across QMUL’s School of Electronic Engineer-
 ing and Computer Science. No hearing impairments were
 • Reliability – clear and consistent selection outcomes declared, other than from two participants who reported
 • Validity – spatial fidelity that is fit for purpose occasional and slight tinnitus that neither regarded as pro-
 nounced. A questionnaire was used to collect information
 • Usability – of potential benefit to any end user on musical training, headphone listening habits and prior
 exposure to binaural audio.
 • Efficiency – a duration acceptable for the use case Participants wore a battery powered embedded device
 running the rendering, study journey and response logging
2.2 Considerations for 3D audio-only mobile contexts
 software. They used an iOS device to submit responses
Adapting the 2D holistic approach for 3D judgement of and progress through the study. Sennheiser HD650 head-
HRTFs in mobile use cases presents three challenges: phones (without any equalisation for binaural synthesis ap-
 plied) were secured to participants with an elasticated hair-
 1. Thorough comparative judgement of 3D involves a band. The head-tracking sensor was mounted on top of
 much wider range of spatial positions and trajecto- the headphones to counter-rotate the sound scene and take
 ries, all of which must be adequately explored to head position readings at 1∘ angular resolution. Head-
 make valid selections. tracking was only enabled in part two of the study.
 2. Mobile and ‘hearable’ devices have either restricted
 or no visual display, meaning that judgements 3.2 Part one: HRTF selection
 should be made without reference to dynamic graph- A comprehensive tournament structure used 21 pairwise
 ics or complex interfaces that would be necessary for comparisons between the optimised shortlist of seven
 audiovisual interaction. human-measured HRTF sets from the LISTEN database
 3. A clear indication of selection repeatability is neces- [31] identified in [32]. A notable previous investigation
 sary in light of the above complexities. into HRTF selection repeatability used stimuli with fixed
 trajectories that were not responsive to head-tracking [23].
 This research deploys a virtual vector base amplitude The test pursued here followed a similar approach, but used
panning (VBAP) [27] system developed on an open-source content derived from recorded music, rather than test tone
embedded Linux platform. The approach uses eight HRIR signals. The comparison stimulus was compiled from ex-
pairs to simulate a sparse, pseudo-spherical virtual loud- cerpts of an anechoic recording of Haydn’s Trumpet Con-
speaker array. Individual sound sources are positioned via certo in Eb performed on unaccompanied cornet [33].
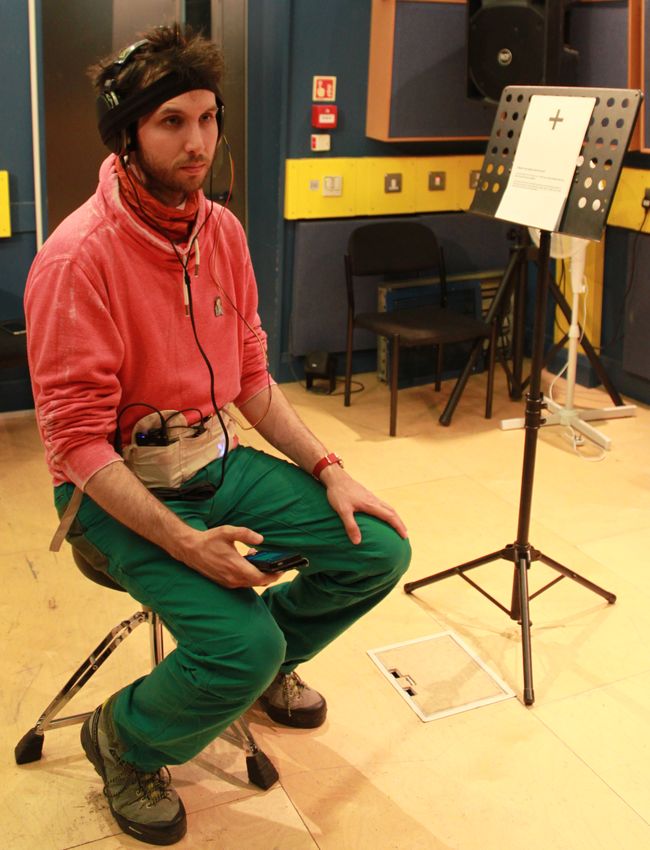
Figure 1. Trajectory for virtual VBAP HRTF comparison Figure 2. User interface for HRTF preference submission

3.2.1 Trajectory
The trajectory in figure 1 addresses considerations 1 and
2 specified in section 2.2. The horizontal plane orbit con-
sisted of a single sustained note lasting approximately two
seconds. Five short bursts in four static positions on the
median plane used an even four-note phrase of around one
second. The overall stimulus was a little under ten sec-
onds. A key feature of the trajectory was that it passed
through all eight virtual speaker locations, which takes ad-
vantage of VBAP’s amplitude panning approach to spatial-
isation. Although the trajectory covered just 363 of 64,082
potential coordinates, this small minority focussed on the
eight fundamental points from which all locations are ren-
dered (consideration 1). The trajectory was also judged
sufficiently short and simple enough to enable purely in-
ternalised A/B auditory comparison without reference to Figure 3. Localisation testing setup showing equipment
dynamic or interactive graphics (consideration 2). worn, personalised calibration point and interaction mode
3.2.2 Selection process
Participants used the GUI shown in figure 2 to compare wished, but were forced to listen to A and B at least once
trajectories and submit preferences. They were also given in their entirety, before response buttons became enabled.
the diagram in figure 1 and an accompanying instruction: Both the sequence of comparisons and the order of A/B
 pairs were randomised for each participant, at all three sit-
 Which has the more convincing 3D effect, tings. For each of their three sessions, the HRTF sets cho-
 excerpt A or B? sen and rejected most often were designated as the pre-
 When comparing A and B, you may wish to ferred and least favoured options. In the event of a draw
 consider: one of the tied sets was picked at random. These two des-
 ignations were then used as the best and worst fitting HRTF
 • horizontal accuracy during the orbit
 sets in participants’ subsequent localisation test.
 and at the four static central positions
 • sense of spread between front/back and 3.3 Part 2: Interactive localisation test
 up/down positions
 The localisation test was conducted following a break of
 • sense of distance or how “outside of
 around five minutes. Before starting, the head-tracker was
 your head” the sounds seem
 calibrated to a personalised position measured and agreed
 Participants completed one example response to check as approximately directly ahead and level with their eye-
their understanding of the task before starting. For each line and therefore considered as 0∘ azimuth, 0∘ elevation.
response, both the time elapsed and outcome of each com- Figure 3 shows the physical setup of the test environment.
parison was logged automatically. Participants were al- The localisation stimulus used 20 seconds of continuous
lowed to listen to either trajectory as many times as they music from the same recording used in part one [33].
Systematic Weak Fair or Good
 Disagreement Agreement Agreement
 C -0.306 (n) A 0.349 (n) B 0.429 (n)
 D -1.080 (o) G 0.186 (n) E 0.743 (p)
 H -0.095 (o) K 0.075 (n) F 0.437 (n)
 J -0.418 (o) O 0.342 (p) I 0.715 (n)
 L -0.840 (p) P 0.380 (o) N 0.726 (p)
 M -0.795 (n) Q 0.142 (o) R 0.648 (o)
 T -1.151 (p) U 0.258 (o) S 0.510 (o)

 Table 1. HRTF selection reliability values and category
 for each participant (A-T), including binaural experience
 indicator (n = none; o = occasional; p = practised)

 Therefore, a total of 120 data points was recorded for each
 participant using between a minimum of two (in the event
 Figure 4. User interface for localisation test submission of perfectly repeated best and worst selections) and maxi-
 mum of six different HRTF sets.

3.3.1 Target locations 4. RESULTS
Localiation targets were divided into three strata, so that All participants completed three study sessions at least 48
anticipated shortcomings in upper and lower hemisphere hours apart. During the session and on later examination
rendering cues could be evaluated independently: of data, it became evident that one participant had not un-
 • at 45∘ elevation – seven azimuths of -153∘ , -102∘ , derstood the requirements of the localisation task and had
 -51∘ , 0∘ , 51∘ , 102∘ and 153∘ provided responses that did not actively seek out the posi-
 tion of the sound source. This participant’s data is reflected
 • at 0∘ elevation – six of the azimuths stated above in the analysis that follows in part one, but not in part two.
 (0∘ was not used)
 4.1 Part one: HRTF selection outcomes
 • at -45∘ elevation – the seven azimuths stated above
 Between the 21 participants, 63 HRTF selection proce-
3.3.2 Localisation process dures were completed. The average time taken across these
The test used egocentric head-pointing to report perceived was a mean of 13 and median of 11.8 minutes.
source position, comparable to [34]. Participants used the 4.1.1 Ranking method
simple GUI in figure 4 with the instruction:
 For each session, the outcomes of a participant’s compar-
 Where is the target sound source? isons were translated into rank order based on the number
 Find the location of the target sound. Point of times each HRTF set was selected (a maximum of six
 your nose towards what you hear to be the and minimum of zero occasions). Tied HRTF sets were
 source position. given a shared ranking at the highest jointly occupied posi-
 tion. So, for example, a ranking list of 1,2,3,4,4,4,7 reflects
 The source will be from somewhere around
 three HRTF sets gaining a score equal to fourth place.
 you and sometimes above or below your ear
 level. In some cases, you might need to ro- 4.1.2 Intra-class correlation measurement
 tate in your seat and/or tilt your head to point
 accurately. Intra-class correlation (ICC) is a statistical approach used
 for measuring consistency between different raters to ver-
 Participants completed two example responses to check ify the robustness of a rating system [35]. ICC has
that they understood what was required before starting the been used previously to evaluate the reliability of repeated
task. For each response, both the time elapsed and variance HRTF set ratings expressed by the same raters [26]. The
in head position from target location was logged automati- HRTF selection reliability established for each participant
cally (as azimuth and elevation co-ordinates). Participants via ICC is presented in table 1. Calculation of ICC was
were allowed as much time as they needed to respond for achieved using the R statistical computing package, ac-
each target. The 20 second excerpt continued on a loop, cording to the guidance and numerical outcome classifi-
if necessary, until they registered a response, after which cations provided in [35], where: less than 0.0 represents
time the next target location began automatically. lower than chance levels of agreement (systematic dis-
 Both the sequence of 20 co-ordinates and the order of agreement); between 0.0 and less than 0.4 is an above
the two groupings (preferred and least favoured HRTF set) chance (but weak) level of agreement; from 0.4 to less
were randomised for each participant, at all three sittings. than 0.6 indicates fair agreement; between 0.6 and less than
0.75 shows good agreement; 0.75 and beyond constitutes Agreement’ group) and the same nine metrics reflected in
excellent agreement. figure 5. Significant difference was found in elevation ac-
 Details provided by participants about their musical train- curacy at 0∘ ( = 0.008, 2 = 9.575). Post-hoc Tukey-
ing, headphone listening habits and level of prior exposure Kramer analysis identified that the ‘Systematic Disagree-
to binaural audio were analysed by the groups in table 1 us- ment’ group performed with significantly better accuracy
ing chi-square and multiple linear regression tests. No re- against this metric than the ‘Weak’ group.
lationship was evident between selection consistency and
 4.2.2 Influence of learning effects
any factor. Each participant’s level of experience with bin-
aural audio is shown in table 1 for reference. Figure 6 represents the distribution of participant outcomes
 when viewed as the first and second halves of their ses-
4.2 Part two: Interactive localisation outcomes sions (irrespective of best/worst HRTF sequencing, which
 was always randomised). A Wilcoxon signed rank test
Three factors mean a reasonable degree of error was to be
 confirmed significant improvement in accuracy of eleva-
expected, particularly at the upper and lower strata (45∘ /
 tion identification with sources placed at 45∘ , for responses
-45∘ elevation). Firstly, even under optimal acoustic con-
 given in the second half of localisation trials ( = 0.041).
ditions, localisation blur of broadband sound immediately
 The same non-parametric test further identified that re-
in front of a listener is established to be in the order of +/-
 sponses at 45∘ ( = 0.003) and 0∘ ( < 0.001) were
3.6∘ for azimuth and +/- 9∘ for elevation [36]. Secondly,
 quicker in the second half, without any detrimental impact
inaccuracy in head pointing orientation was an further con-
 on azimuth or elevation precision.
tributor to response error. Bahu et al [34] suggest that, for
sources with substantial vertical displacement (57∘ ), head
pointed localisation can introduce mean unsigned error of 5. DISCUSSION
3∘ in azimuth and 12∘ in elevation. Thirdly, sparseness We return to the four criteria put forward in section 2 for
of the virtual speaker array in the upper and lower binau- evaluating the success of an HRTF selection system.
ral hemisphere would have degraded spatial representation
of sources originating in these areas far beyond optimal 5.1 Reliability
acoustic conditions [28, 30].
 Given these constraints, minimum standards of accuracy A third of participants demonstrated a fair to good level
were established to evaluate localisation outcomes. For az- of consistency in the rankings that resulted between their
imuth, a tolerance of +/-15∘ was used to test whether the three HRTF selection sessions. A further third showed
rendering system could provide reliable interactive presen- some tendency towards repeating their patterns of selec-
tation of sound sources at a minimum lateral separation of tion beyond chance level. The final third returned sets of
30∘ . For elevation, a +/-22.5∘ threshold was applied to test rankings that actively diverged from each other to a greater
simply whether users could reliably distinguish between degree than chance level.
sources located above, below and on the horizontal plane. Although absolute values and proportions of participants
 between these groups do not indicate a mechanism that
4.2.1 Influence of HRTF selection could yet be described as reliable, for a significant minority
 it was possible to attain outcomes that were repeatable to
Quality of HRTF fit could have impacted both response
 an acceptable level. Given the holistic nature of the com-
accuracy and time. Figure 5 shows the distribution of par-
 parison judgement (simultaneously considering azimuth,
ticipant outcomes for best and worst HRTFs. Plots show
 elevation and externalisation) and speed of the overall se-
the distribution of participants’ overall azimuth and ele-
 lection process, the approach shows substantial potential
vation success rate and their mean response duration, for
 for further development towards more reliable usage. More
each stratum (45∘ , 0∘ and -45∘ ). If there were objec-
 detailed analysis of the selection process and localisation
tive interaction benefits to the HRTF selection procedure,
 data presented here will help to identify how the stimulus,
we would expect to see higher successful identification
 trajectory or written guidance outlined in section 3 could
rates and lower mean response times. This is only evi-
 be further simplified to focus the comparison process.
denced clearly in relation to azimuth accuracy in the upper
hemisphere (upper and middle plots of column one in fig-
 5.2 Validity
ure 5). A Wilcoxon signed rank test confirmed significant
improvement in accuracy of azimuth for sources placed Analysis showed apparent benefits to azimuth localisation
on the horizontal plane, when using a preferred HRTF set accuracy in the upper hemisphere from preferred HRTF se-
compared to least preferred ( = 0.047). The same non- lection, which was significant along the horizontal plane.
parametric test for significance did not uncover any other It is unsurprising that preferred HRTFs were of most ben-
effects from using the best judged HRTF set, for any of the efit across this dimension, where five of the eight virtual
remaining eight metrics in figure 5. speakers reside. Although this finding validates the selec-
 Further analysis was conducted to evaluate the influ- tion approach in one respect, it is notable that positive ele-
ence of HRTF selection consistency on localisation per- vation detection was increased by general exposure to the
formance. A Kruskal-Wallis test was conducted between localisation task (albeit from a low starting base). This im-
the participant groupings shown in table 1 (but without provement and accompanying increases in response speed
the participant identified in 4, who was within the ‘Weak occurred independently of best or worst HRTF usage. The
Figure 5. Distributions of participant azimuth/elevation success rates and mean response times, by HRTF preference*

 Figure 6. Distributions of participant azimuth/elevation success rates and mean response times, by sequence*
 * Plots with blue background indicate significant difference between distributions
selection routine might therefore be validly applied in tan- [3] M. Cohen, S. Aoki, and N. Koizumi, “Augmented au-
dem with a structured pre-exposure phase to optimise per- dio reality : telepresence / VR hybrid acoustic envi-
ceptual experience. ronments,” in IEEE International Workshop on Robot
 It should also be noted that no meaningful statistical rela- and Human Communication, Tokyo, Japan, 11 1993,
tionship was found between participants’ HRTF ranking pp. 361–364.
consistency and localisation performance. Significantly
 [4] N. Sawhney and C. Schmandt, “Nomadic Radio:
improved elevation accuracy was found in the ‘Systematic
 speech and audio interaction for contextual messag-
Disagreement’ group for sources on the horizontal plane.
 ing in nomadic environments,” ACM Transactions on
However, this apparent strength is actually a by-product
 Computer-Human Interaction, vol. 7, no. 3, pp. 353–
of that group returning a greater overall proportion of re-
 383, 2000.
sponses that neglected vertical localisation and remained
overly focussed at 0∘ elevation. The group was less likely [5] Y. Vazquez-Alvarez, M. P. Aylett, S. A. Brewster,
to have noticed vertically displaced sources and performed R. Von Jungenfeld, and A. Virolainen, “Designing
particularly poorly in elevation accuracy at heights of 45∘ interactions with multilevel auditory displays in mo-
and -45∘ . bile audio-augmented reality,” ACM Transactions on
 Computer-Human Interaction, vol. 23, no. 1, pp. 1–30,
5.3 Usability 2016.
It is notable that the two most reliable raters judged them- [6] M. McGill, S. Brewster, D. McGookin, and G. Wil-
selves to be practised in binaural listening. However, there son, “Acoustic transparency and the changing sound-
was no significant advantage to ranking consistency found scape of auditory mixed reality,” in Proceedings of the
through statistical analysis of musical training, headphone SIGCHI Conference on Human Factors in Computing
listening habits or prior binaural exposure. Moreover, Systems, Honolulu, Hawaii,USA, 4 2020, pp. 1–16.
some of those with only occasional and even no binaural
experience were able to achieve fair or good levels of re- [7] A. N. Nagele, V. Bauer, P. G. T. Healey, J. D. Reiss,
peatability. H. Cooke, T. Cowlishaw, C. Baume, and C. Pike, “In-
 teractive audio augmented reality in participatory per-
5.4 Efficiency formance,” Frontiers in Virtual Reality, vol. 1, no.
 February, pp. 1–14, 2021.
An average completion time between 12 and 13 minutes
can be regarded as within the realms of an acceptable du- [8] R. Shukla, “Voice-led interactive exploration of audio,”
ration for single-time calibration of a 3D end-user system. BBC Research and Development, Tech. Rep. Novem-
 ber, 2019.
 6. CONCLUSION [9] M. Geronazzo, A. Rosenkvist, D. S. Eriksen, C. K.
A new generation of headsets is enabling various forms of Markmann-Hansen, J. Køhlert, M. Valimaa, M. B. Vit-
auditory mixed reality with interactive spatial sound. The trup, and S. Serafin, “Creating an audio story with in-
efficacy of those binaural experiences will be at least partly teractive binaural rendering in virtual reality,” Wireless
impacted by the degree to which rendered scenes fit the Communications and Mobile Computing, vol. 2019,
perceptual profile of individual users. To date, there is no pp. 1–14, 2019.
established method for personalising the HRTFs deployed [10] A. Roginska, “Binaural audio through headphones,”
for end-users of audio virtual or augmented reality in mo- in Immersive sound: The art and science of binau-
bile contexts. The approach outlined here begins to ad- ral and multi-channel audio, 1st ed., A. Roginska and
dress this issue and its first iteration has shown promising P. Geluso, Eds. New York, NY, USA: Routledge,
outcomes against previously identified evaluation criteria. 2018, ch. 4, pp. 88–123.

 Acknowledgments [11] M. Geronazzo, S. Spagnol, and F. Avanzini, “Estima-
 tion and modeling of pinna-related transfer functions,”
This work was supported by EPSRC and AHRC under the in Proceedings of the 13th International Conference on
grant EP/L01632X/1 (Centre for Doctoral Training in Me- Digital Audio Effects, Graz, Austria, 9 2010, pp. 1–8.
dia and Arts Technology).
 [12] A. Meshram, R. Mehra, H. Yang, E. Dunn, J.-M.
 7. REFERENCES Franm, and D. Manocha, “P-HRTF: Efficient per-
 sonalized HRTF computation for high-fidelity spatial
[1] D. R. Begault, 3D sound for virtual reality and multi- sound,” in 2014 IEEE International Symposium on
 media, 1st ed. London, UK: Academic Press Limited, Mixed and Augmented Reality (ISMAR), Munich, Ger-
 1994. many, 9 2014, pp. 53–61.
[2] B. B. Bederson, “Audio augmented reality: a prototype [13] S. Spagnol, “HRTF selection by anthropometric re-
 automated tour guide,” in Proceedings of the SIGCHI gression for improving horizontal localization accu-
 Conference on Human Factors in Computing Systems, racy,” IEEE Signal Processing Letters, vol. 27, pp.
 Denver, Colorado, USA, 5 1995, pp. 210–211. 590–594, 2020.
[14] R. Pelzer, M. Dinakaran, F. Brinkmann, S. Lepa, [25] A. Andreopoulou and B. F. G. Katz, “Investigation on
 P. Grosche, and S. Weinzierl, “Head-related transfer subjective HRTF rating repeatability,” in 140th Audio
 function recommendation based on perceptual simi- Engineering Society Convention, Paris, France, 6 2016,
 larities and anthropometric features,” The Journal of pp. 1–10.
 the Acoustical Society of America, vol. 148, no. 6, pp.
 3809–3817, 2020. [26] C. Kim, V. Lim, and L. Picinali, “Investigation into
 consistency of subjective and objective perceptual se-
[15] B. U. Seeber and H. Fastl, “Subjective selection of non- lection of non-individual head-related transfer func-
 individual head-related transfer functions,” in Proceed- tions,” Journal of the Audio Engineering Society,
 ings of the 2003 International Conference on Auditory vol. 68, no. 11, pp. 819–831, 2020.
 Display, Boston, MA, USA, 7 2003, pp. 259–262.
 [27] V. Pulkki, “Virtual sound source positioning using vec-
[16] A. Roginska, G. H. Wakefield, and T. S. Santoro, “User tor base amplitude panning,” Journal of the Audio En-
 selected HRTFs: reduced complexity and improved gineering Society, vol. 45, no. 6, pp. 456–466, 1997.
 perception,” in Undersea Human System Integration [28] R. Shukla, I. T. Radu, M. Sandler, and R. Stewart,
 Symposium, Providence, RI, USA, 7 2010, pp. 1–14. “Real-time binaural rendering with virtual vector base
[17] R. Shukla, R. Stewart, A. Roginska, and M. Sandler, amplitude panning,” in AES International Conference
 “User selection of optimal HRTF sets via holistic com- on Immersive and Interactive Audio, York, UK, 3 2019,
 parative evaluation,” in AES International Conference pp. 1–10.
 on Audio for Virtual and Augmented Reality, Red- [29] V. Pulkki, “Evaluating spatial sound with binaural au-
 mond, WA, USA, 8 2018, pp. 1–10. ditory model,” in Proceedings of the 2001 Interna-
 tional Computer Music Conference. Havana, Cuba:
[18] E. M. Wenzel, M. Arruda, D. J. Kistler, and
 Michigan Publishing, 9 2001, p. 73–76.
 F. L. Wightman, “Localization using nonindividual-
 ized head-related transfer functions,” The Journal of [30] R. Baumgartner and P. Majdak, “Modeling localiza-
 the Acoustical Society of America, vol. 94, no. 1, pp. tion of amplitude-panned virtual sources in sagittal
 111–123, 1993. planes,” AES: Journal of the Audio Engineering Soci-
 ety, vol. 63, no. 7-8, pp. 562–569, 2015.
[19] H. Møller, M. F. Sørensen, C. B. Jensen, and D. Ham-
 mershøi, “Binaural technique: Do we need individual [31] O. Warusfel, “Listen HRTF database,” 2003. [On-
 recordings?” Journal of the Audio Engineering Soci- line]. Available: http://recherche.ircam.fr/equipes/
 ety, vol. 44, no. 6, pp. 451–469, 1996. salles/listen/index.html

[20] D. R. Begault, E. M. Wenzel, and M. R. Anderson, [32] B. F. G. Katz and G. Parseihian, “Perceptually based
 “Direct comparison of the impact of head tracking, head-related transfer function database optimization,”
 reverberation, and individualized head-related transfer The Journal of the Acoustical Society of America, vol.
 functions on the spatial perception of a virtual speech 131, no. 2, pp. EL99–EL105, 2012.
 source.” Journal of the Audio Engineering Society,
 [33] V. Hansen and G. Munch, “Making recordings for sim-
 vol. 49, no. 10, pp. 904–916, 2001.
 ulation tests in the Archimedes project,” Journal of the
[21] A. Roginska, T. S. Santoro, and G. H. Wakefield, Audio Engineering Society, vol. 39, no. 10, pp. 768–
 “Stimulus-dependent HRTF preference,” in 129th Au- 774, 1991.
 dio Engineering Society Convention, San Francisco,
 [34] H. Bahu, T. Carpentier, M. Noisternig, and O. Warus-
 CA, USA, 11 2010, pp. 1–11.
 fel, “Comparison of different egocentric pointing
[22] Y. Wan, A. Zare, and K. Mcmullen, “Evaluating the methods for 3D sound localization experiments,” Acta
 consistency of subjectively selected head-related trans- Acustica united with Acustica, vol. 102, no. 1, pp. 107–
 fer functions (HRTFs) over time,” in AES 55th Interna- 118, 2016.
 tional Conference: Spatial Audio, Helsinki, Finland, 8 [35] K. A. Hallgren, “Computing inter-rater reliability for
 2014, pp. 1–8. observational data: an overview and tutorial,” Tutorials
 in Quantitative Methods for Psychology, vol. 8, no. 1,
[23] D. Schönstein and B. F. G. Katz, “Variability in percep-
 pp. 23–34, 2012.
 tual evaluation of HRTFs,” Journal of the Audio Engi-
 neering Society, vol. 60, no. 10, pp. 783–793, 2012. [36] J. Blauert, Spatial hearing: the psychophysics of hu-
 man sound localization, revised ed. Cambridge, Mas-
[24] A. Andreopoulou and A. Roginska, “Evaluating HRTF sachusetts: MIT Press, 1997.
 similarity through subjective assessments: factors that
 can affect judgment,” in Joint 40th International Com-
 puter Music Conference & 11th Sound and Music
 Computing Conference. Athènes, Greece: Michigan
 Publishing, 9 2014, pp. 1375–1381.
You can also read