UK Equities The crowds are returning! - Columbia Threadneedle Investments

Page created by Joyce Ward
 
CONTINUE READING
UK Equities The crowds are returning! - Columbia Threadneedle Investments
UK Equities
The crowds are returning!
For professional investors only
12 October 2021
UK Equities The crowds are returning! - Columbia Threadneedle Investments
Your presenters today

                 Richard Colwell        Chris Kinder
                 Head of UK Equities   Portfolio Manager
                  Portfolio Manager

                                                           2
UK Equities The crowds are returning! - Columbia Threadneedle Investments
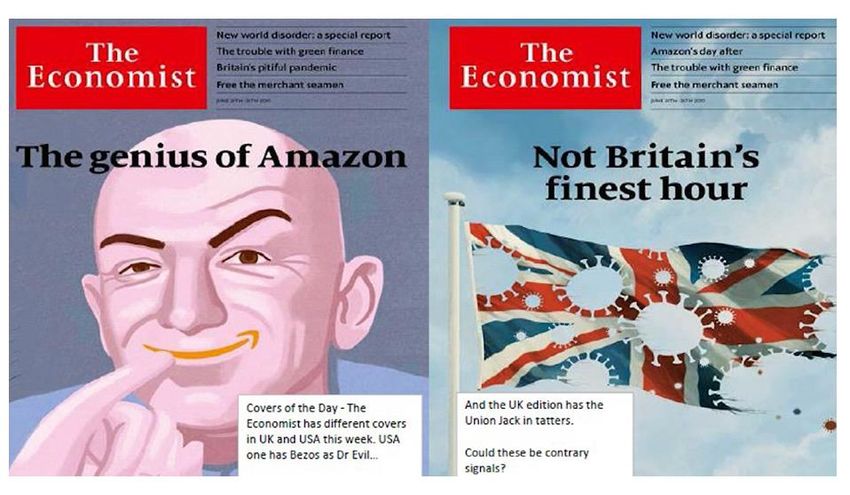
Sentiment in a Snapshot!

‘It is fantastic to be an unregulated monopoly in a pandemic’1
                                                                                                                 Scott Galloway, NYU Professor of Marketing, 2020

Source: Redburn, The Economist, June 2020. 1 Interview with Yahoo Finance and Scott Galloway, Professor of Marketing at NYU, 2020: https://youtu.be/QfMWBDAZsRI.

                                                                                                                                                                    3
UK Equities The crowds are returning! - Columbia Threadneedle Investments
Envy for UK’s vaccine rollout!

◼    The UK lifted their lockdown restrictions in July
◼    As at September 2021, 81% of over 16s have been fully vaccinated in the UK

Source: Sky News, as at 24 February 2021: Covid-19: Germany's top-selling newspaper admits envy for UK's vaccine rollout, UK News, Sky News.

                                                                                                                                               4
UK Equities The crowds are returning! - Columbia Threadneedle Investments
Brexit
Large amount of political uncertainty removed

◼    As of 1 January 2021, the UK has left the EU with                                                 ◼     The trade deal has already removed downside
     a deal                                                                                                  risk to Sterling. Against the dollar, the pound is its
◼    The deal was largely in line with expectations:                                                         strongest since early 2018, while it is approaching
                                                                                                             the top of its post-Brexit range against the euro1
     ◼     Zero-tariff, zero quota trade in goods
     ◼     Services – single market conditions have not been                                           Five years from the referendum: the pound is
           replicated                                                                                  close to making up its lost ground against the
     ◼     Financial services are still being negotiated – for now,                                    dollar1
           it’s equivalence
◼    Longer term
     ◼     Potential to unlock some of the capex constraints
           from corporations now tail risk of No Deal has been
           removed
     ◼     What will we do with our new-found freedom:
           –     New trade deals – successes noted thus far, US
                 is the big one. Pivot to Asia where we already
                 outperform EU
           –     Regulatory autonomy
                                                                                                                British Pound Spot – Last Price            GBP – EUR X-Rate – Last Price
           –     National champions / state aid – unlikely

Source: Columbia Threadneedle Investments.1. Bloomberg article: Brexit Chaos Gone, the U.K. Is Too Cheap to Ignore: John Authers, May 2021. 2. Ruffer, February 2021.

                                                                                                                                                                                           5
UK Equities The crowds are returning! - Columbia Threadneedle Investments
UK market still cheap and out of favour!

UK performance remained a laggard!                                     Global asset allocators been reluctant to redress
                                                                       UK equities underweight
      Korea
Netherlands
    Taiwan
   Sweden                                                                              Sentiment improving?
  Denmark
          US
 Hong Kong
      China
       India
  Germany
      Japan
Switzerland
   Australia
     France
    Canada
        Italy
      Spain
          UK
     Russia
      Brazil
                -30            -10             10            30   50
                        2020 performance (%, USD terms)

                                                                       Source: Bank of America Merrill Lynch Global Fund Manager Survey, as at 31 August 2021.
Source: Bloomberg, Morgan Stanley, as at 31 December 2020.             Data since 2006 for commodities and real estate, since 2001 for everything else.

                                                                                                                                                             6
UK Equities The crowds are returning! - Columbia Threadneedle Investments
When will asset allocators move away from the crowd?

‘Long Tech’ still the most crowded trade                       Net % of FMS investors overweight UK Equities

                                                                   Net % Overweight   UK Equities vs Global Equities

Source: Bank of America Merrill Lynch, as at September 2021.

                                                                                                                       7
UK Equities The crowds are returning! - Columbia Threadneedle Investments
UK market even cheaper – even ex Energy and Banks!
UK Equities not just a reflation trade, cheap everywhere!

UK versus World on PE, Dividend Yield and PBV                                                          MSCI UK 12m Fwd P/E relative, ex Energy and
                                                                                                       Banks
                                    20                                                                 1.10

                                    10                                                                 1.05
Average % Premium On PE, PBV & DY

                                     0                                                                 1.00

                                    -10                                                                0.95

                                    -20                                                                0.90

                                    -30                                                                0.85

                                    -40                                                                0.80

                                    -50                                                                0.75

                                    -60                                                                0.70
                                                                                 43% discount

                                    -70                                                                0.65
                                          74   80      86      92      98   03     09        15   21          01      03   05     07     09    11    13     15    17     19     21
                                                                                                                   MSCI UK ex Energy and Banks 12m Fwd. P/E vs World ex Energy and
                                                    MSCI UK vs World                Median                         Banks
                                                                                                                   Median

Source: Morgan Stanley, as at 30 June 2021.                                                            Source: JPMorgan, as at 30 June 2021.

                                                                                                                                                                                     8
UK Equities The crowds are returning! - Columbia Threadneedle Investments
UK relative value opportunity

 Valuation1                                          Price to Earnings 2021E                                      Dividend Yield (%)
 UK                                                              13.4x                                                      3.7

 Europe ex UK                                                    17.2x                                                      2.8

 USA                                                             21.6x                                                      1.4

UK shares at record low relative to US2                                                               Price-to-book valuation of UK versus US3
                                                                                                       1.2

                                                                                                       1.1

                                                                                                       1.0

                                                                                                       0.9

                                                                                                       0.8

                                                                                                       0.7

                                                                                                       0.6

                                                                                                       0.5
                                                                                                             88   90   92    94   96    98   00    02   04   06   08   10   12     14      16   18   20

                                                                                                                   MSCI UK Price/ Book relative to US         Median             +1stdev             -1stdev

Source: 1 Bloomberg as at 21 September 2021. 2 Macrostrategy Partnership, as at 21 July 2021. 3 JPMorgan, as at 30 June 2021.

                                                                                                                                                                                                           9
UK Equities The crowds are returning! - Columbia Threadneedle Investments
Zooming into the cycles…
Noughties Cycle: 2000-2007 – Favours GBP and FTSE100!

UK Stock Markets: UK relative to US (shown with GB3-US$ spot rate)

Source: Longview Economics as at 16 September 2021.

                                                                     10
UK Equities attractive qualities

FTSE 100 – revenue exposure                              Why buy FTSE 100?

                                                         ◼    Global exposure
                                 Japan                        ▪     77% exposure outside the UK
             Latin America        3%
                   4%                                    ◼    FX factor
        Africa &
       Middle East                       North America
          5%                                  27%             ▪     High level of inverse correlation with sterling

                                                         ◼    Defensive nature
   Europe
   ex UK                                                      ▪     37% of the index1
    17%
                                                         ◼    Commodity exposure
                                                              ◼     23% of the index2

                                                         ◼    Governance

                                           UK                 ◼     Strong regulatory framework and supportive domestic
            Asia/Pacific
             ex Japan
                                          23%                       environment
               20%

                                                         Source: Columbia Threadneedle Investments.1 Defensive sectors comprising combined
                                                         weighting of Consumer Staples, Healthcare, Utilities, Communication Services. 2 combined
Source: FactSet, as at 30 June 2021.                     weighting of Energy and Materials sectors (GICS definition). As at 30 June 2021.

                                                                                                                                               11
UK Equities key qualities

Sector composition of UK versus other key markets                    FTSE 100 index versus GBP/USD: performance
                                                                     8,000                                                           2.2

                                                            MSCI     7,000
                          FTSE100       MSCI US   Topix                                                                              2.0
                                                          Eurozone
                                                                     6,000
                                                                                                                                     1.8
 Energy                       9%          2%       1%       4%
                                                                     5,000
                                                                                                                                     1.6
 Materials                   14%          3%       7%       7%
                                                                     4,000

 Industrials                 10%          9%      24%       15%                                                                      1.4
                                                                     3,000

 Discretionary                8%         12%      18%       17%      2,000                                                           1.2

 Staples                     18%          6%       8%       8%       1,000                                                           1.0
                                                                             86 88 90 92 94 96 98 00 02 04 06 08 11 13 15 17 19 21
 Healthcare                  10%         13%       9%       8%                             FTSE 100         GBP/USD (RHS)

 Financials                  20%         11%       9%       15%      FTSE 100 index versus GBP/USD: correlation
 IT                           1%         28%      13%       13%        60

                                                                       40
 Comm. Services               5%         11%       9%       4%
                                                                       20
 Utilities                    3%          3%       1%       7%
                                                                        0
 Real Estate                  1%          3%       2%       2%
                                                                      -20

 Cyclicals                   34%         51%      61%       53%       -40

 Defensives                  36%         33%      27%       27%       -60
                                                                            86 88 90 92 94 96 98 00 02 04 06 08 11 13 15 17 19 21

Source: JPMorgan, as at 30 June 2021.                                Source: Morgan Stanley, as at 30 June 2021.

                                                                                                                                      12
Value arbitrage – the UK Brexit discount

Sector-adjusted relative performance, 2020-2021                                                                                                 The following names have underperformed their
(MSCI ACW L1 weights at the start of the year)                                                                                                  peers (2020-2021) and screen as inexpensive
1.2                                                                                                                                             versus their peers (and largely have translational
1.1                                                                                                                                             exposure)
                                                                                                                                                 UK international earners, cheap and underperforming peers, common currency,
1.0                                                                                                                                                                                2020-2021
                                                                                                                                                                   Perf.                               Perf. Rel Perf.    PE
                                                                                                                                                UK                       Peer
0.9                                                                                                                                                                  %                                  %       %      discount
                                                                                                                                                Asos               53.3    Zalando                     137.2   -83.8   -64%
0.8
                                                                                                                                                Informa            -39.0   Wolters Kluwer              37.7    -76.6   -16%

0.7                                                                                                                                                                        Dassault System, Hexagon,
                                                                                                                                                Aveva Group        3.5                                 68.0    -64.5   -18%
      Jan Feb Mar Apr May Jun Jul Aug Sep Oct Nov Dec Jan Feb Mar Apr May Jun Jul                                                                                          PTC
                 UK        US        Cont. Europe       GEM         Japan                                                                       Easy Jet           -34.5   Ryanair                     15.3    -49.8   -334%

                                                                                                                                                Rentokil Initial   14.0    Rollins, Servicemaster      54.7    -40.8   -44%
Communication Services and Consumer
                                                                                                                                                ITV                -13.3   ProSieben, RTL, Mediaset    22.6    -35.9   -19%
Discretionary have significantly underperformed
                                                                                                                                                RELX               5.0     Wolters Kluwer              37.7    -32.6   -16%
their global peers even in local currency terms
  2                                                                                                                                             Elementis          -12.2   Lanxess, Croda, Clariant    17.8    -30.0   -19%
 -8                                                                                                                                             Imperial Brand     -13.1   PMI, Altria                  6.0    -19.1   -49%
-18
-28                                                                                                                                             Johnson Matthey    7.0     Umicore                     25.5    -18.5   -35%
-38                                                                                                                                                                        Deutsche Telekom, KPN,
-48                                                                                                                                             Vodafone           -13.8                                4.0    -17.8    0%
                                                                                                                                                                           Orange
-58
                                                                                                                                                SSE                8.8     IberDrola                   25.0    -16.2    -6%
-68
          IT

                                                        Financials

                                                                     Energy

                                                                              Industrials

                                                                                            Cons. Stpls

                                                                                                                        Utilities

                                                                                                                                    Materials
                Telecom

                          Discretionary

                                          Health Care

                                                                                                          Real estate

                                                                                                                                                BAT                -9.6    PMI, Altria                  6.0    -15.6   -35%
                             Cons.

                                                                                                                                                Unilever (UK)      1.4     Nestlé                      15.2    -13.8   -21%

                                                                                                                                                ABF                -11.1   H&M, ITC                    -0.8    -10.3    -7%

Source: Refinitiv and Credit Suisse research, as at 6 July 2021.

                                                                                                                                                                                                                               13
UK target for corporate activity

◼    Corporates and private equity firms looking to take                                Global M&A (£bn) – always late cycle…2
     advantage of the value arbitrage                                                   1,400                                                                                   800

◼    Mergers and acquisitions are at record levels following                            1,200                                                                                   700

     COVID and political uncertainty                                                    1,000                                                                                   600

◼    Helped by appeal of GBP/USD on 35 year lows!                                         800                                                                                   500

                                                                                          600                                                                                   400
◼    Recent examples include:
                                                                                          400                                                                                   300
      ◼    Morrisons                          ◼     GVC / Entain
                                                                                          200                                                                                   200
      ◼    Senior                             ◼     William Hill
                                                                                            0                                                                                   100
      ◼    Aggreko                            ◼     G4S                                         98 99 00 01 02 03 04 05 06 07 08 09 10 11 12 13 14 15 16 17 18 19 20 21
                                                                                                     M&A Quarterly Volume in $bn       MSCI AC World Index in USD (RHS)
      ◼    RSA                                ◼     Signature Aviation
2021 has already almost surpassed previous record                                       Private Equity deal volumes push global M&A to
years for takeovers – transactions in the UK ($bn) 1                                    highs3

Source: Columbia Threadneedle Investments, Bloomberg, as at July 2021. The mention of   Source: 1. Berenberg as at 11 August 2021. 2. Citi, as at 30 June 2021. 3. Financial Times
any specific shares or bonds should not be taken as a recommendation to deal.           as at 1 July 2021.

                                                                                                                                                                                 14
Inflation versus Deflation – the battle of the big beasts!

                                                                                                      ◼   In the battle of the big beasts,
                                                                                                          Niall Ferguson argues the policy
                                                                                                          of borrowing vast sums of money
                                                                                                          to kick-start the economy directly
                                                                                                          conflicts with efforts to reduce
                                                                                                          interest rates.

                                                                                                      ◼   “I can’t tell you when inflation will
                                                                                                          be back, I can’t tell you when
                                                                                                          Godzilla will be defeated, but I
                                                                                                          can tell you that in the process
                                                                                                          there will be economic volatility
                                                                                                          and ordinary people will pay.” 1

                                                                                                      ◼   He warned that "the debt trap
                                                                                                          may be about to spring" 1 for
                                                                                                          countries that have created large
                                                                                                          stimulus packages in order to
                                                                                                          stimulate their economies.

Source: Image: https://www.indiewire.com/shop/watch-godzilla-vs-kong-stream-hbo-max-1234627153/
1 Niall Ferguson 2009: https://www.theguardian.com/politics/2009/may/25/niall-ferguson-hay-festival

                                                                                                                                              15
Value / growth debate

◼    The market is keen to pigeonhole investors: you are either a value roundhead or you are a growth cavalier1
◼    This is “fuzzy thinking”!2
◼    Investors see the “mixing of the two terms as a form of intellectual cross-dressing”3
◼    However, things are more nuanced than that… Warren Buffett believes that “the two approaches are joined at
     the hip; growth is always a component in the calculation of value”2
◼    … and for value “such characteristics are far from determinative as to whether an investor is indeed buying
     something for what it is worth and is therefore truly operating on the principle of obtaining value”2
◼    It is about balance, finding middle ground and acting with conviction

Source: 1 Taken from Richard Colwell’s “The crowds are returning” viewpoint May 2021. 2 The essays of Warren Buffett, edited by Larry Cunningham. 3 Letter to Shareholders of Berkshire Hathaway
Inc, from Warren Buffett, dated 1 March 1993.

                                                                                                                                                                                               16
The time is now: The dangers of market timing
What if you get it wrong?

FTSE All Share total cumulative return (1998-2021)

  250%
                                                                   If you missed the 30 best days between
  200%
                                                                  1998 and 2021, an index fund would have
  150%                                                             fallen by 21% instead of rising by 241%
  100%

    50%

     0%

   -50%

 -100%
                  Stayed the course               missed best 10 days      missed best 30 days   missed best 60 days   missed best 90 days

                                                                                   Markets can turn very quickly and are nearly
                                                                                                       impossible to predict…
Source: Columbia Threadneedle Investments, Liberum, as at 22 March 2021.

                                                                                                                                             17
Return of the Roaring 20s?!

◼    Repressed consumer spending likely to drive upside
     in markets

◼    Vaccine roll-out also raises confidence for 2021
     recovery

Regardless of how recovery plays out, UK Equities is
well positioned for a strong 2021:

◼    Large part of political uncertainty surrounding Brexit
     has been removed

◼    Distressed valuations at record levels across multiple
     sectors

◼    UK not just a Reflationary play!
                                                              UK Equities: Full of compelling opportunities
                                                               You don’t want to be too late to the party!!

Source: Columbia Threadneedle Investments.                    Image source: https://images.app.goo.gl/o1BFUNbKL5SVVyBZ9.

                                                                                                                           18
Conclusion

◼    Investors fixated on ‘visions’ and growth in pursuit of future-proofing

◼    Plenty of value in the UK market – trading at 30-year lows versus MSCI World index

◼    Some of the best opportunities in distressed shares in a decade

◼    Best time to invest can be when it feels most uncomfortable

◼    M&A activity, highly likely to rise

◼    “Bipolar”1 markets led by high degree of consensus thinking

◼    UK equities: still the land that time forgot!

Source: Columbia Threadneedle Investments.
1 Larry Fink, BlackRock CEO, 17 July 2020 https://www.thinkadvisor.com/2020/07/17/u-s-must-fix-bipolar-economy-blackrocks-fink/.

                                                                                                                                   19
20
Cumulative performance of Threadneedle UK Equity
Income Fund
From 31 July 1999
 350

 300

 250

 200

 150

 100

  50

    0

 -50

-100
    1999 2000 2001 2002 2003 2004 2005 2006 2007 2008 2009 2010 2011 2012 2013 2014 2015 2016 2017 2018 2019 2020

                                          UK IA Equity Income                  Threadneedle UK Equity Income Fund                         FTSE All Share

        Annualised Fund performance (3 years net)                               Annualised Fund performance (5 years net)                         Absolute Sharpe ratio (3 years net)

          Fund +3.4%                      Peer group +1.9%                        Fund +7.1%                       Peer group +5.5%                                  +0.2
Source: Columbia Threadneedle Investments and Morningstar, as at 30 June 2021. Peer group is the UK IA - UK Equity Income. Fund performance is net of fees in GBP. The share class is the ISIN
GB00B8169Q14. Please refer to the Fund Objective in the appendix for further information regarding the Funds benchmark.
Past performance is not a guide to future performance.

                                                                                                                                                                                                 21
Threadneedle (Lux) UK Equity Income
Gross performance

Annualised gross performance
                                                                                                          26.1%
                                                                                                                     21.5%

                                                                        12.7%
                                                                                   11.1%
                                      7.0%                                                                                                                                    6.1%
                                                  5.6%                                                                                                                                 5.1%
                                                                                                                                             3.8%
                                                                                                                                                       2.0%

                                          3 Months                         6 Months                            1 Year                          3 Years                   Since fund inception
                                                                                                                                                                             annualised¹
                                                                                  Fund                                   Index

   Outperformance2                         +1.3%                             +1.5%                             +3.8%                             +1.7%                             +0.9%

Calendar year gross performance (%)
                                                2020                                       2019                                      2018                                       2017
 Fund                                            -6.6                                      20.4                                       -6.3                                       7.7
 Index                                           -9.8                                      19.2                                       -9.5                                      13.1
 Outperformance2                                +3.5                                       +1.0                                      +3.6                                       -4.8
Source: Columbia Threadneedle Investments and FactSet, all data as at 30 June 2021 and in GBP. Fund returns gross of fees and management expenses for comparison with the FTSE All-Share
Index. From 1 April 2010 fund gross returns are calculated in FactSet using daily official Global Close valuations and daily cash flows. From 1 January 2008 until 31 March 2010 returns are based on
Global Close (prior to this date official noon prices have been used). All prices are calculated by the fund's administrator.
1 Since inception was 5 October 2016. 2 Outperformance calculated on a geometric basis.
Past performance is not a guide to future returns.

                                                                                                                                                                                                        22
Threadneedle (Lux) UK Equities
Gross performance

Annualised gross performance
                                                                                        23.9%
                                                                                                 21.5%

                                                                     11.1%
                                                            9.1%                                                                                                              9.1%
                                                                                                                                                                                      7.4%
                                         5.6%                                                                                                    6.1% 6.5%
                               4.1%
                                                                                                                     1.9% 2.0%

                                  3 months                    6 months                      1 year                      3 years                      5 years            Since fund inception
                                                                                                                                                                            annualised¹
                                                                                Fund                                  Index

 Outperformance2                    -1.5%                       -1.8%                      +2.0%                        -0.1%                        -0.4%                      +1.5%

Calendar year gross performance (%)
                                            2020                           2019                             2018                             2017                              2016
Fund                                        -9.8                           24.1                             -11.5                             11.8                             14.4
Index                                       -9.8                           19.2                              -9.5                             13.1                             16.8
Outperformance2                             +0.0                           +4.2                              -2.2                             -1.2                             -2.0

Source: Columbia Threadneedle Investments and FactSet, all data as at 30 June 2021 and in GBP. All returns are gross of fees and included gross reinvested income. All prices are calculated by the
fund's administrator. From 1 April 2010 fund gross returns are calculated in FactSet using daily official Global Close valuations and daily cash flows.
1 Fund inception date is 1 January 2012. 2 Outperformance calculated on a geometric basis.
Past performance is not a guide to future returns.

                                                                                                                                                                                                  23
Threadneedle (Lux) UK Equity Income
RI Time series charts

◼     The fund was rated AAA on the MSCI ESG fund ratings

Controversy Exposure – Time series                                                                                                                                                                               MSCI score – Time series
 12.0%                                                                                                                                                                                                           9.0

                                                                                                                                                                                                                 8.0
 10.0%
                                                                                                                                                                                                                 7.0

    8.0%                                                                                                                                                                                                         6.0

                                                                                                                                                                                                                 5.0
    6.0%
                                                                                                                                                                                                                 4.0

    4.0%                                                                                                                                                                                                         3.0

                                                                                                                                                                                                                 2.0
    2.0%
                                                                                                                                                                                                                 1.0

    0.0%                                                                                                                                                                                                         0.0
                                               Jan-20

                                                                                                                                                           Jan-21

                                                                                                                                                                                                        Jun-21
                             Nov-19
                                      Dec-19

                                                                                   May-20
                                                                                            Jun-20

                                                                                                                                         Nov-20
                                                                                                                                                  Dec-20

                                                                                                                                                                                               May-21
           Sep-19
                    Oct-19

                                                        Feb-20
                                                                 Mar-20
                                                                          Apr-20

                                                                                                     Jul-20
                                                                                                              Aug-20
                                                                                                                       Sep-20
                                                                                                                                Oct-20

                                                                                                                                                                    Feb-21
                                                                                                                                                                             Mar-21
                                                                                                                                                                                      Apr-21

                                                                                                                                                                                                                                                  Jun-19

                                                                                                                                                                                                                                                                                         Jun-20

                                                                                                                                                                                                                                                                                                                             Jun-21
                                                                                                                                                                                                                                Dec-18

                                                                                                                                                                                                                                                                       Dec-19

                                                                                                                                                                                                                                                                                                           Dec-20
                                                                                                                                                                                                                       Sep-18

                                                                                                                                                                                                                                         Mar-19

                                                                                                                                                                                                                                                            Sep-19

                                                                                                                                                                                                                                                                                Mar-20

                                                                                                                                                                                                                                                                                                  Sep-20

                                                                                                                                                                                                                                                                                                                    Mar-21
                                                                          Portfolio                                Benchmark                                                                                                                               Portfolio                Benchmark

Source: Columbia Threadneedle Investments, as at 30 June 2021. 2 As at 30 June 2021. The benchmark is the FTSE All Share.

                                                                                                                                                                                                                                                                                                                                      24
Threadneedle (Lux) UK Equities
RI Time series charts

◼     The fund was rated AAA on the MSCI ESG fund ratings

Controversy Exposure – Time series                                                                                                                                                                               MSCI score – Time series
 12.0%                                                                                                                                                                                                            9.0

                                                                                                                                                                                                                  8.0
 10.0%
                                                                                                                                                                                                                  7.0

    8.0%                                                                                                                                                                                                          6.0

                                                                                                                                                                                                                  5.0
    6.0%
                                                                                                                                                                                                                  4.0

    4.0%                                                                                                                                                                                                          3.0

                                                                                                                                                                                                                  2.0
    2.0%
                                                                                                                                                                                                                  1.0

    0.0%                                                                                                                                                                                                          0.0
                                               Jan-20

                                                                                                                                                           Jan-21

                                                                                                                                                                                                        Jun-21
                             Nov-19
                                      Dec-19

                                                                                   May-20
                                                                                            Jun-20

                                                                                                                                         Nov-20
                                                                                                                                                  Dec-20

                                                                                                                                                                                               May-21
           Sep-19
                    Oct-19

                                                        Feb-20
                                                                 Mar-20
                                                                          Apr-20

                                                                                                     Jul-20
                                                                                                              Aug-20
                                                                                                                       Sep-20
                                                                                                                                Oct-20

                                                                                                                                                                    Feb-21
                                                                                                                                                                             Mar-21
                                                                                                                                                                                      Apr-21

                                                                                                                                                                                                                                                   Jun-19

                                                                                                                                                                                                                                                                                          Jun-20

                                                                                                                                                                                                                                                                                                                              Jun-21
                                                                                                                                                                                                                                 Dec-18

                                                                                                                                                                                                                                                                        Dec-19

                                                                                                                                                                                                                                                                                                            Dec-20
                                                                                                                                                                                                                        Sep-18

                                                                                                                                                                                                                                          Mar-19

                                                                                                                                                                                                                                                               Sep-19

                                                                                                                                                                                                                                                                                 Mar-20

                                                                                                                                                                                                                                                                                                   Sep-20

                                                                                                                                                                                                                                                                                                                     Mar-21
                                                                          Portfolio                                Benchmark                                                                                                                                Portfolio            Benchmark

Source: Columbia Threadneedle Investments, as at 30 June 2021. 2 As at 30 June 2021. The benchmark is the FTSE All Share.

                                                                                                                                                                                                                                                                                                                              25
UK Equities Team
Experienced and resourced

                                                                                   Richard Colwell
                                                                                 Head of UK Equities
                                                                                      All sectors
                                                                                 31 years experience

                                                                     Jeremy Smith
                                                                                                    Chris Kinder
                                     Jonathan Barber               Head of UK Equity
   Michael Hamblett                                                                                Housebuilders,           James Thorne             Charanjit Walia
                                  Utilities, Property, Oil &            Research
 Responsible Investments                                                                         Retail, Technology,        Small & Mid-cap      Client Portfolio Manager
                                          Gas Majors                Support Services,
   8 years experience                                                                             Consumer Goods          23 years experience      11 years experience
                                   31 years experience                 Oil Services
                                                                                                 20 years experience
                                                                   27 years experience

                             Sonal Sagar                                  Dominic Younger
                                                      Todd King
    Stacey Cassidy        Chemicals, Leisure,                                Food Retail,           Kunal Kothari              Craig Adey             Lilly Kolliniati
                                                 Aerospace & Defence,
   Media, Transport       Luxury, Healthcare,                            Industrials, Paper &         Multi-sector           Small & Mid-cap      Client Portfolio Analyst
                                                  Construction, Banks
  13 years experience          Insurance                                      Packaging           13 years experience      10 years experience     5 years experience
                                                  10 years experience
                          16 years experience                             8 years experience

    Benjamin Malone                 Christopher Fox                 Roger Wilkinson                  Sian Morgan           Isabel Buccellati         Jeriel Rivera
   Dedicated UK Trader             Dedicated UK Trader              Comm. Services               Insurance, Financials        Healthcare               Industrials
   29 years experience             22 years experience             28 years experience            11 years experience     27 years experience     19 years experience

     James Holman
                                                                     Olivia Watson                  Jess Williams              Ben Kelly             Natalia Luna
 Senior Portfolio Managers            Jenny Fedele
                                                                    Senior RI Analyst                 RI Analyst           Senior RI Analyst       Senior RI Analyst
         Assistant                    Team Assistant
                                                                   15 years experience            7 years experience      14 years experience     11 years experience
   25 years experience

                                                                     Iain Richards               Proxy Voting Team
                                                                 Head of Global RI Policy       Composed of 4 full time
                                                                  27 years experience                employees

Source: Columbia Threadneedle Investments, as at 30 June 2021.

                                                                                                                                                                             26
Biography

RICHARD COLWELL
Head of UK Equities and Portfolio Manager

                 Richard Colwell is a portfolio manager and Head of UK Equities at Columbia Threadneedle. He manages the
                 Threadneedle UK Growth & Income Fund, Threadneedle UK Equity Income Fund and the Threadneedle UK Equity
                 Alpha Income Fund. He also co-manages the Threadneedle Monthly Extra Income Fund and has research
                 responsibility across all sectors.
                 Before joining the company, Richard ran high alpha UK equity portfolios at Aviva Investors. He has also held
                 portfolio management roles at Credit Suisse and Schroders and worked at the Bank of England.
                 Richard has a degree in Banking, Insurance & Finance from the University of Bangor. He holds the Chartered
                 Financial Analyst designation and is a member of the CFA Society of the UK as well as the Chartered Institute of
                 Bankers.
                 Company start date:        2010
                 Industry start date:       1990

                                                                                                                                    27
Biography

CHRIS KINDER
Portfolio Manager

                    Chris Kinder joined the company in 2010 as a portfolio manager in the UK equities team. His main responsibilities
                    are the management of the Threadneedle UK Fund, the Threadneedle UK Extended Alpha Fund, and co-
                    management of the Threadneedle UK Absolute Alpha Fund. He also has research responsibility for the
                    housebuilders, retail, media and oil services sectors.
                    Before joining the company, Chris was an assistant fund manager at RWC Partners. He has also worked at Govett
                    Investments, gaining experience in smaller companies’ analysis. Chris is a qualified chartered accountant, having
                    worked at PricewaterhouseCoopers for 4 years before joining the investment management industry.
                    Chris has a degree in Modern European Languages from Durham University and he also holds the Chartered
                    Financial Analyst designation.
                    Company start date:       2010
                    Industry start date:      2001

                                                                                                                                    28
Threadneedle (Lux) UK Equity Income
Objective and Key Risks

Objective: The aim of the Fund is to provide income with the potential to grow the amount you invested.
The Fund invests at least two-thirds of its assets in shares of companies in the UK or companies that have significant operations there.
The Fund may also invest in asset classes and instruments different from those stated above.
The Fund permanently invests a minimum of 75% of its assets in the European Economic Area equities, and is therefore PEA (Plan d’Epargne en Actions) eligible
in France.
Income from investments in the Fund will be added to the value of your shares.
You can buy or sell shares in the Fund on any day which is a business day in Luxembourg unless the directors have decided that insufficient markets are open.
Such days are published on columbiathreadneedle.com. You can find more detail on the investment objective and policy of the Fund in the section of the
prospectus with the heading “Investment Objectives and Policies”.
The fund manager will make reference to the FTSE All-Share index as part of the investment process. The Fund does not aim to track the index, and will not hold
every security in the index and in theory may hold none. The fund manager may also invest in securities that are not in the index. The FTSE All-Share index is
also considered as part of Columbia Threadneedle’s investment risk monitoring process, to ensure the overall level of risk taken by the fund manager is not
inconsistent with the index.
Key Risks
Investment Risk – The value of investments can fall as well as rise and investors might not get back the sum originally invested.
Currency Risk – Where investments are in assets that are denominated in multiple currencies, or currencies other than your own, changes in exchange rates
may affect the value of the investments.
Derivatives for EPM / Hedging – The investment policy of the fund allows it to invest in derivatives for the purposes of reducing risk or minimising the cost of
transactions.
High Volatility Risk – The fund typically carries a risk of high volatility due to its portfolio composition or the portfolio management techniques used. This means
that the fund’s value is likely to fall and rise more frequently and this could be more pronounced than with other funds.

                                                                                                                                                                       29
Threadneedle (Lux) UK Equities
Objective and Key Risks

Objective – The UK Equities Portfolio seeks to achieve capital appreciation by investing principally in the equity securities of
companies domiciled in the United Kingdom or which have significant United Kingdom operations. The Portfolio may further invest in
other securities (including fix ed income securities, other equities and Money Market Instruments).

Investment Risk – The value of investments can fall as well as rise and investors might not get back the sum originally invested.

Currency Risk – Where investments are in assets that are denominated in multiple currencies, or currencies other than your own,
changes in exchange rates may affect the value of the investments.

Derivatives for EPM / Hedging – The investment policy of the fund allows it to invest in derivatives for the purposes of reducing risk
or minimising the cost of transactions.

Volatility Risk – The fund may exhibit significant price volatility.

                                                                                                                                         30
Important information

For use by professional clients and/or equivalent investor types in your jurisdiction (not to be used with or passed on to retail clients)
For marketing purposes.
Past performance is not a guide to future performance. The value of investments and any income is not guaranteed and can go down as well as up and may be affected by exchange rate fluctuations.
This means that an investor may not get back the amount invested. Your capital is at risk. This material is for information only and does not constitute an offer or solicitation of an order to buy or sell any
securities or other financial instruments, or to provide investment advice or services. The mention of any specific shares or bonds should not be taken as a recommendation to deal.
The analysis included in this document has been produced by Columbia Threadneedle Investments for its own investment management activities, may have been acted upon prior to publication and is
made available here incidentally. Any opinions expressed are made as at the date of publication but are subject to change without notice and should not be seen as investment advice. Information
obtained from external sources is believed to be reliable but its accuracy or completeness cannot be guaranteed.
This presentation and its contents are confidential and proprietary. The information provided in this presentation is for the sole use of those attending the presentation. It may not be reproduced in any
form or passed on to any third party without the express written permission of Columbia Threadneedle Investments. This presentation is the property of Columbia Threadneedle Investments and must
be returned upon request.
Threadneedle (Lux) is an investment company with variable capital (Société d’investissement à capital variable, or "SICAV") formed under the laws of the Grand Duchy of Luxembourg. The SICAV
issues, redeems and exchanges shares of different classes. The management company of the SICAV is Threadneedle Management Luxembourg S.A, who is advised by Threadneedle Asset
Management Ltd. and/or selected sub-advisors.
Certain sub-funds of the SICAV are registered in Austria, Belgium, Denmark, France, Finland, Germany, Hong Kong, Iceland, Ireland, Italy, Liechtenstein, Luxembourg, Macau, the Netherlands,
Norway, Portugal, Singapore, Spain, Sweden, Switzerland, the UAE and the UK; however, this is subject to applicable jurisdictions and some sub-funds and/or share classes may not be available in all
jurisdictions. Shares in the Funds may not be offered to the public in any other country and this document must not be issued, circulated or distributed other than in circumstances which do not
constitute an offer to the public and are in accordance with applicable local legislation.
Threadneedle (Lux) is authorised in Spain by the Comisión Nacional del Mercado de Valores (CNMV) and registered with the relevant CNMV's Registered with number 177.
Het compartiment is op grond van artikel 1:107 van de Wet op het financieel toezicht opgenomen in het register dat wordt gehouden door de Autoriteit Financiële Markten. / Pursuant to article 1:107 of
the Act of Financial Supervision, the subfund is included in the register that is kept by the AFM.
Please read the Prospectus before investing.
Shares in the Funds may not be offered, sold or delivered directly or indirectly in the United States or to or for the account or benefit of any “U.S. Person”, as defined in Regulation S under the 1933
Act.
Subscriptions to a Fund may only be made on the basis of the current Prospectus and the Key Investor Information Document, as well as the latest annual or interim reports and the applicable terms &
conditions. Please refer to the ‘Risk Factors’ section of the Prospectus for all risks applicable to investing in any fund and specifically this Fund. Documents other than KIIDs are available in English,
French, German, Italian, Spanish and Dutch (no Dutch Prospectus). KIIDs are available in local languages. The summary of investor rights is available on our website in English. Documents can be
obtained free of charge on request by writing to the management company at 44, rue de la Vallée, L-2661 Luxembourg, Grand Duchy of Luxembourg, from International Financial Data Services
(Luxembourg) S.A. at 47, avenue John F. Kennedy, L-1855 Luxembourg, Grand Duchy of Luxembourg, and /or from www.columbiathreadneedle.com and or from:

                                                                                                                                                                                                             31
Important information (cont.)

-     in Austria from Erste Bank, Graben 21 A-1010 Vienna;
-     in Belgium from CACEIS Belgium S.A., avenue du Port 86 C b 320, 1000 Brussels
-     in France from CACEIS Bank, 1/3 Place Valhubert, 75013 Paris;
-     in Germany from JP Morgan AG, Junghofstr. 14, 60311 Frankfurt;
-     in Liechtenstein from Liechtensteinische Landesbank AG, Städtle 44, 9490 Vaduz Principality of Liechtenstein;
-     in Sweden from Skandinaviska Enskilda Banken AB (publ), Kungsträdgårdsgatan, SE-10640 Stockholm, Sweden;
-     in the UK from JPMorgan Worldwide Securities Services, 60 Victoria Embankment, London EC4Y 0JP;
-     in Switzerland from our representative and Paying Agent in Switzerland, RBC Investor Services Bank S.A., Esch-sur-Alzette, Zurich branch, Bleicherweg 7, CH 8027 Zurich.
© 2021 MSCI ESG Research LLC. Reproduced by permission. Although Columbia Threadneedle information providers, including without limitation, MSCI ESG Research Inc. and its affiliates (the “ESG
Parties”), obtain information from sources they consider reliable, none of the ESG Parties warrants or guarantees the originality, accuracy and/or completeness of any data herein. None of the ESG
Parties makes any express or implied warranties or any kind, and the ESG Parties hereby expressly disclaim all warranties of merchantability and fitness for a particular purpose, with respect to any
data herein. None of the ESG Parties shall have any liability for any errors or omissions in connection with any data herein. Further, without limiting any of the foregoing, in no event shall any of the
ESG Parties have any liability for any direct, indirect, special, punitive, consequential or any other damages (including lost profits) even if notified of the possibility of such damages. Sustainability risks
are integrated into the fund’s investment decisions making process for financial Risk Management purposes only.
© 2021 Morningstar, Inc. All rights reserved. The information contained herein: (1) is proprietary to Morningstar and/or its content providers; (2) may not be copied or distributed; and (3) is not warranted
to be accurate, complete, or timely. Neither Morningstar nor its content providers are responsible for any damages or losses arising from any use of this information.
Past performance is no guarantee of future results.
Threadneedle Management Luxembourg S.A. may decide to terminate the arrangements made for the marketing of the Fund.
In the EEA and Switzerland: Issued by Threadneedle Management Luxembourg S.A. Registered with the Registre de Commerce et des Sociétés (Luxembourg), Registered No. B 110242 44, rue de la
Vallée, L-2661 Luxembourg, Grand Duchy of Luxembourg.
In the UK: Threadneedle Management Luxembourg S.A. Registered with the Registre de Commerce et des Societes (Luxembourg), Registered No. B 110242, 44, rue de la Vallée, L-2661
Luxembourg, Grand Duchy of Luxembourg. Issued by Threadneedle Asset Management Limited, registered in England and Wales, No. 573204. Registered Office: Cannon Place, 78 Cannon Street,
London EC4N 6AG. Authorised and regulated in the UK by the Financial Conduct Authority.
In the Middle East: This document is distributed by Columbia Threadneedle Investments (ME) Limited, which is regulated by the Dubai Financial Services Authority (DFSA).For Distributors: This
document is intended to provide distributors’ with information about Group products and services and is not for further distribution. For Institutional Clients: The information in this document is not
intended as financial advice and is only intended for persons with appropriate investment knowledge and who meet the regulatory criteria to be classified as a Professional Client or Market
Counterparty and no other Person should act upon it.
Columbia Threadneedle Investments is the global brand name of the Columbia and Threadneedle group of companies.

                                                                                                                                                                                                              32
You can also read