UC Riverside UC Riverside Previously Published Works
←
→
Page content transcription
If your browser does not render page correctly, please read the page content below
UC Riverside
UC Riverside Previously Published Works

Title
Chronological cues and consumers’ preference for mere newness

Permalink
https://escholarship.org/uc/item/1nf9k770

Authors
Jie, Yun
Li, Ye

Publication Date
2022

DOI
10.1016/j.jretai.2021.11.003

Peer reviewed

 eScholarship.org                           Powered by the California Digital Library
                                                            University of California
JID: RETAIL
                                                       ARTICLE IN PRESS                                                               [m5+;January 6, 2022;16:54]

                                                        Available online at www.sciencedirect.com

                                                              Journal of Retailing xxx (xxxx) xxx
                                                                                                                                    www.elsevier.com/locate/jretai

         Chronological cues and consumers’ preference for mere newness
                                                                 Yun Jie a,1,∗, Ye Li b
        a School   of Tourism Management, South China Normal University, Higher Education Mega Center, Guangzhou, 510006, China, P. R. China
                                          b School of Business, University of California, Riverside, United States

                                                                      Available online xxx

Abstract
    Chronological cues are ubiquitous in retail settings, whether they come in the form of production, release, on-shelf, or purchase dates,
etc. Yet, they remain relatively underexplored in the marketing literature. Could newness that arises from these chronological cues lead
consumers to prefer options merely because they are newer, above and beyond any substantive benefits conferred or implied by that newness?
We propose and find in a series of eight preregistered studies (n= 2,216) that consumers exhibit mere newness preference across many
product domains—preferring chronologically newer options over older options with no substantive benefits to newness. We provide evidence
that overgeneralization is one important driver of mere newness preference: Most consumers hold positive (negative) associations with
chronological newness (oldness) in an implicit association test, and mere newness preference is reduced in domains in which the opposite
association exists. Consequently, consumers are willing to pay a newness premium even for mere newness.
© 2022 New York University. Published by Elsevier Inc. All rights reserved.

Keywords: Newness; Overgeneralized association; IAT; Preference; Choice; WTP.

                              Introduction                                          cars that have gone unsold for a few weeks, even if nobody
                                                                                    has driven them. Furthermore, the preferences illustrated by
  “Americans have been conditioned to respect newness,                              these examples could matter because consumers may be will-
whatever it costs them.” —John Updike, 1975, A Month of                             ing to pay sizable newness premiums for newer options over
Sundays                                                                             older options despite there being little to no substantive dif-
                                                                                    ference. Although a little extra dust on a product is annoying,
    Anecdotally, consumers (everywhere, not just Americans)                         is it worth paying so much extra for?
like what is new and expend a great deal of money chas-                                 The existing research on newness in marketing mainly fo-
ing it. Is it possible that consumers even like newness for                         cuses on new products that differ from existing products (or
the sake of newness? For example, when one of the authors                           versions) by being unique, original, or innovative in some way
buys Nike shoes, he spends extra time opening the boxes                             (Desiraju 2001; Henard and Szymanski 2001; Steenkamp and
to find the production dates printed on the shoes’ tongues                          Gielens 2003). That is, newness research in marketing has
and chooses the newest pair among otherwise identical shoes                         generally studied preference for novelty, such as the work on
(even though he acknowledges the difference is inconsequen-                         new product launch (e.g., Hoeffler 2003; Min, Kalwani, and
tial). Similarly, consumers may prefer to buy cars that have                        Robinson 2006) and consumer novelty-seeking/innovativeness
just arrived at the dealership over identical (same model year)                     (e.g., Hirschman 1980). Indeed, newer products typically dif-
                                                                                    fer from older products in substantive ways that may lead con-
                                                                                    sumers to prefer them, and consumers may assume that newer
 ∗   Corresponding author.                                                          versions of products are better than existing ones (Garcia-
     E-mail address: yun.jie@m.scnu.edu.cn (Y. Jie).                                Rada et al. 2020; Sela and LeBoeuf 2017).
  1 Yun Jie received research support from the National Natural Science
                                                                                        Yet, as our introductory examples suggest, a product can
Foundation of China (Grants 71902198 and 71832015) and the Guangdong
Basic and Applied Basic Research Foundation (Grant 2020A1515011080).                be chronologically newer than another product—i.e., being
The authors contributed equally to this paper and author order is alphabeti-        newer on some chronological cue such as production date or
cal.                                                                                on-shelf date—without that difference in newness conferring

https://doi.org/10.1016/j.jretai.2021.11.003
0022-4359/© 2022 New York University. Published by Elsevier Inc. All rights reserved.

 Please cite this article as: Y. Jie and Y. Li, Chronological cues and consumers’ preference for mere newness, Journal of Retailing, https:// doi.org/ 10.1016/ j.
 jretai.2021.11.003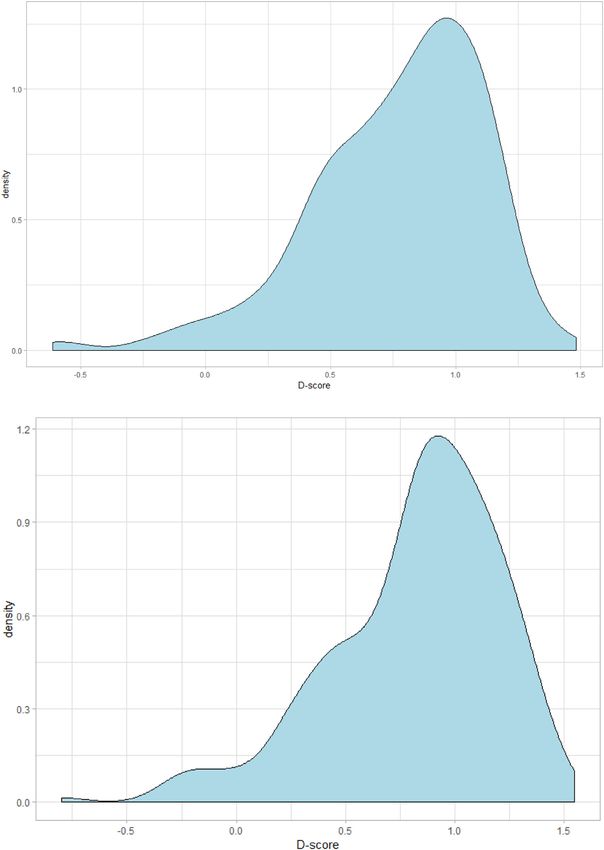
JID: RETAIL
                                             ARTICLE IN PRESS                                                   [m5+;January 6, 2022;16:54]
Y. Jie and Y. Li                                                                                         Journal of Retailing xxx (xxxx) xxx

or implying novelty or any other substantive differences. That         ied chronological cues, and most of the existing papers that
is, one option can be merely newer than another without being          do have focused on expiration dates (e.g., Inman and McAl-
substantively newer. We use the term mere newness to mean              ister 1994; Tsiros and Heilman 2005; Zhu, Yang, and Hsee
chronological newness that does not confer substantive ben-            2018). Given the universality of chronological cues in retail
efits (i.e., it does not relate to product quality), as opposed        contexts, this paper tries to answer whether consumers might
to being substantively newer (e.g., fresher food, more rele-           prefer chronologically newer options merely because they are
vant news, trendier fashion). A natural question arises: Could         newer, separate from the substantive benefits of newness. That
consumers prefer options merely because they are chronolog-            is, do consumers seem to like newness for the sake of new-
ically newer—preferring newness for newness’ sake? That is,            ness?
do consumers exhibit mere newness preference?
    The answer to whether consumers may prefer chronologi-
cally newer options merely because they are newer is not so            Mere newness preference
straightforward. Much like novel or new versions of products
tend to be desirable because they offer something different                We propose that consumers prefer options even if they
from prior products, chronologically newer products do often           are merely chronologically newer, and that this preference
confer or imply some substantive benefit, such as by being             is due to an overgeneralization of the association between
trendier (e.g., music, clothes), fresher (e.g., food), or more         the concepts “newer” and “better.” This association may have
relevant (e.g., news). On the other hand, consumers may ac-            two roots: evolution and associative learning. Over millen-
tually prefer older options in some domains where the pas-             nia of evolution, humans have developed a taste for fresh
sage of time increases product quality or value (e.g., wine,           foods due to their greater nutrition content and disgust to-
whisky, art, antiques). This makes our research question an-           ward decaying foods due to their possibility for illness. Pref-
swerable only if we can disentangle preferences for newer              erences for fresher (and thus chronologically newer) options
options from inferences about the substantive benefits con-            thus became an evolutionarily functional general tendency
ferred by newness or oldness. This was our goal in a series            (Hsee et al. 2014), for which the ultimate cause lies in the
of six studies in which we investigated whether consumers              selective advantages this tendency yielded for prehistoric hu-
prefer even merely newer products and are willing to pay a             mans (Ryan and Deci 2017). In the shorter term, consumers’
premium for them. We created mere newness in two ways, 1)              lives are rife with experiences of newer products with better
by randomly-assigning incidental chronological cues (studies           features and older products deteriorating over time, becoming
1, 2, 5, and 6), and 2) using chronological cues that should           obsolete, or going out of fashion. Consumers may therefore
not substantively impact product quality by design (studies 3          have learned to associate newer (older) chronological cues
and 4).                                                                with improvement (deterioration) (Le Pelley 2004; Mackin-
    Theoretically, the current research contributes to the study       tosh 1975).
of newness in marketing by identifying a new form of                       Whether this association between the concepts of “newer”
newness. We provide insights on whether consumers pre-                 and “better” (and its inverse “older” and “worse”) exists be-
fer newer or older products with different chronological               cause of evolution and/or associative learning, consumers may
cues across various product domains above and beyond any               overgeneralize the relationship, applying it even in situations
substantive benefits actually conferred by the difference in           where it is irrelevant (Zebrowitz 1990). Overgeneralization
chronological newness. While marketers already recognize the           is a natural part of learning and has been used to explain
value that consumers place on newness in terms of novelty              a wide range of phenomena such as stereotyping (Le Pelley
(Hirschman 1980) or revised and upgraded versions of ex-               et al. 2010), facial judgments (Zebrowitz and Rhodes 2004),
isting products (Garcia-Rada et al. 2020; Sela and LeBoeuf             and cooperation in social dilemmas (Baron 1997). Addition-
2017), our research illuminates the extent to which consumers          ally, evolutionary-rooted tendencies are not sensitive to spe-
seem to value newness for newness’ sake. In explaining mere            cific situations (Hsee et al. 2014) and may translate to a
newness preference, we provide evidence for an overgeneral-            preference for merely newer things, i.e., an overgeneraliza-
ized association between newer and better (and between older           tion (Hsee et al. 2013; Arkes and Ayton 1999; Klayman and
and worse).                                                            Brown 1993). Consumers may thus fail to distinguish situ-
                                                                       ations in which newness is relevant or not, overgeneralizing
                   Preference for newness                              from situations where newness is functional (e.g., fruit) to
                                                                       non-functional consumption settings (e.g., office stationary).
   We examine preferences for choice options tagged with               Notably, Garcia-Rada and colleagues (2020) documented a re-
older or newer chronological cues—dates or times that are              lated effect in an unpublished manuscript, showing that people
attached to options, whether physically (e.g., production or           prefer the revised versions of things (e.g., resumes and logos)
expiration dates printed on a product label) or otherwise (e.g.,       even when there is no objective improvement. They suggest a
purchase dates or promotion dates). Such cues can differenti-          similar, although more specific overgeneralization mechanism:
ate choice options according to their chronological newness.           people overgeneralize the specific belief that “good intention
Many marketing papers have studied product attributes such             translates into good outcomes.” In contrast, the effect we iden-
as color, shape, and country of origin; far fewer have stud-           tified in this paper is more general and may even contribute

                                                                   2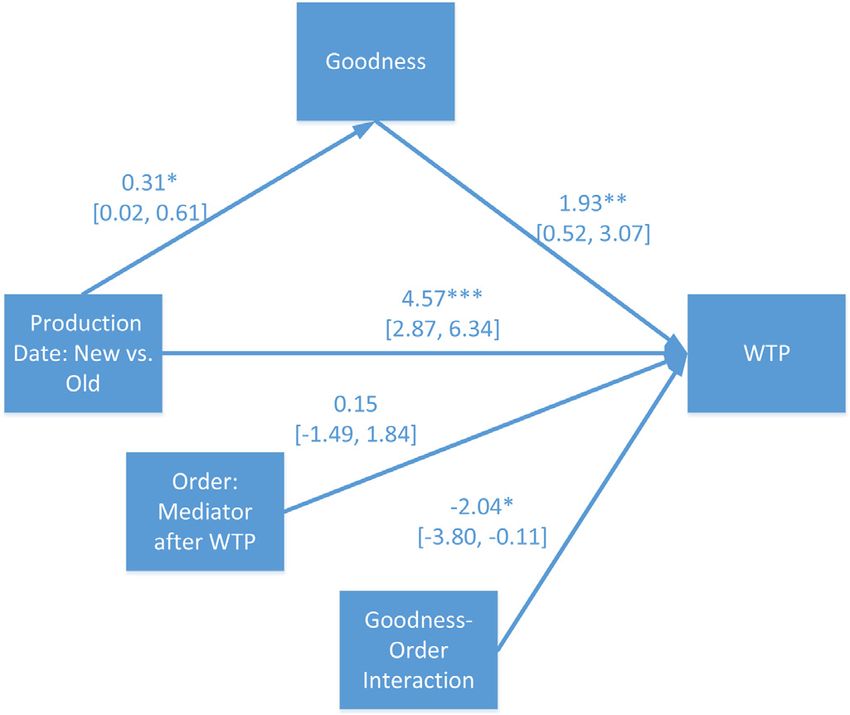
JID: RETAIL
                                             ARTICLE IN PRESS                                                              [m5+;January 6, 2022;16:54]
Y. Jie and Y. Li                                                                                                   Journal of Retailing xxx (xxxx) xxx

to consumers’ preference for revised or upgraded versions of            categories, but with notable exceptions. Next, in six experi-
products (Sela and LeBoeuf 2017).                                       mental studies using in-person and Amazon Mechanical Turk
    Specifically, we hypothesize that chronological newness             samples, and using both within-subjects (studies 1, 2, 5, 6)
cues can bias consumers toward choosing newer options over              and between-subjects designs (studies 3 and 4), we show that
older ones, even if the newer option is not substantively better,       consumers prefer merely newer options (H2a and H2b) using
and they may even pay a premium for that mere newness.                  choice (studies 1, 5, and 6) and willingness-to-pay measures
    H1: People associate newer with better and older with               (studies 2–4). These studies demonstrate mere newness prefer-
worse.                                                                  ence across a range of product domains including electronics
    H2a: People will prefer newer options to older options, all         (study 1), durable goods (studies 2 and 4), food and bever-
else equal (i.e., mere newness preference).                             ages (studies 3 and 5), and digital content (study 6). We also
    H2b: People will pay a premium for merely newer options.            show that mere newness preference is moderated for red wine
    Because evolutionary-rooted tendencies are often ba-                (study 5), a domain in which the opposite “older is better” as-
sic, general, and manifest themselves across domains                    sociation exists (H3). Finally, we cast doubt on an alternative
(Hsee et al. 2014), we posit that mere newness preference               mechanism based on psychological distance (study 6).
is no exception: it occurs at a general level, and can even
exist for product domains where “older is better” beliefs ex-                        Pilot study 1: Implicit association test
ist, such as red wine. For example, although consumers may
prefer red wine produced longer ago due to inferences about                To test that consumers hold an association between
improved quality, they may still prefer wine taken out of the           “newer” and “better” (H1), we conducted an implicit associa-
retailer’s storage and placed on store shelves more recently            tion test (IAT; Greenwald and Banaji 1995; Greenwald et al.
(holding production date constant).                                     1998), which assesses the degree to which target concepts
    Nonetheless, in the associative-propositional evaluation            (e.g., Old vs. New) and categories (e.g., Worse vs. Better)
model (APE; Gawronski and Bodenhausen 2006), inconsis-                  are mentally associated. To increase the internal and external
tent examples or contexts can exert influences on associative           validity of our findings, we collected data from two different
evaluations, leading to evaluations that are reduced or even re-        samples: 1) undergraduates in a controlled laboratory setting
versed from those that result from the default associations. For        and 2) an online sample representative of the U.S. population.
example, implicit prejudice against minority groups is lower
when people are exposed to admired minorities (e.g., Michael            Methods
Jordan; Dasgupta and Greenwald 2001) or when the minor-
ity group members are presented in a positive context (e.g.,                A student sample of 267 business undergraduates at a
at a family BBQ; Wittenbrink, Judd, and Park 2001). Similar             large public university (preregistered at http://aspredicted.org/
processes can occur for mere newness preference: while expo-            blind.php?13:italic x/13:italic=xg2rg5) and a representa-
sure to a chronologically newer option can activate a “newer            tive sample of 294 U.S. adults from Lucid1 (http://aspredicted.
is better” association, the belief that “wine gets better with          org/blind.php?13:italic x/13:italic=st275c) participated in
aging” may interfere with the default evaluative judgment, re-          the IAT study.2 We designed the IAT using words as stim-
sulting in reduced preference for the newer option. That is,            uli: new (today, current, recent, later, now), old (yesterday,
for product domains in which people believe older products              ancient, past, prior, earlier), positive (better, great, superior,
have great value or quality, we expect the inconsistent be-             quality, superb, excellent), and negative (worse, poor, infe-
lief to interfere with the default “newer is better” association.       rior, cheap, lousy, terrible). Student and general population
Depending on the degree of interference, mere newness pref-             participants spent an average of 7.4 and 9.0 min, respec-
erence in such domains may be reduced, eliminated, or even              tively, in answering 7 blocks of questions.3 Following our pre-
reversed.                                                               registered protocol and standard practice (Carpenter Thomas
    H3: In domains in which older products generally have               et al. 2019; Greenwald, Nosek, and Banaji 2003), we removed
greater value or quality (e.g., antiques, red wine), mere new-          overly-fast responses with over 10% of the responses under
ness preference will be reduced or even reversed.                       300 ms, leaving analyzable samples of 236 (121 female; ages
                                                                        not collected) and 277 participants (151 female; ages 18–84,
                    Overview of research
                                                                          1 Lucid (https:// luc.id/ theorem/ ) provides a demographically representative
    We provide evidence for these hypotheses in eight prereg-
                                                                        sample of Americans based on age, gender, ethnicity, and region.
istered studies. First, we assess the strength and prevalence             2 IAT in Qualtrics was designed using the web-based tool iatgen (http:
of the association between “newer” and “better” (H1) in an              //iatgen.org). Data was analyzed using the iatgen R package, designed to
implicit association test, finding that the vast majority of U.S.       automatically perform Greenwald et al.’s (2003) data cleaning and scoring
consumers (96% in both student and representative U.S. pop-             procedure (Carpenter et al. 2019).
                                                                          3 The seven blocks are Block 1 (Practice Trials, Only New/Old), Block 2
ulation samples) hold this association. Second, we measured
                                                                        (Practice Trials, Only Positive/Negative), Block 3 (Incompatible Block, Prac-
whether consumers hold explicit attitudes that “newer prod-             tice Trials), Block 4 (Incompatible Block, Critical Trials), Block 5 (Practical
ucts are better” in 39 major product categories, finding that           Trials, Positive/Negative with sides reversed from Block 2), Block 6 (Compat-
they hold such explicit attitudes for the majority of product           ible Block, Practice Trials), and Block 7 (Compatible Block, Critical Trials).

                                                                    3
JID: RETAIL
                                                      ARTICLE IN PRESS                                                          [m5+;January 6, 2022;16:54]
Y. Jie and Y. Li                                                                                                         Journal of Retailing xxx (xxxx) xxx

Mage = 47, SD = 17.09), respectively. Analyses using the full                            We recruited 98 Amazon Mechanical Turk partici-
dataset were qualitatively similar.                                                  pants from CloudResearch’s Approved Panel (https:
                                                                                     // www.cloudresearch.com/ , 51 female; Mage = 43.79,
                                                                                     SD = 12.74, preregistered at https://aspredicted.org/
Results                                                                              blind.php?13:italic x/13:italic=gy5jz7). Participants rated
                                                                                     these 39 types of products based on “whether you think
    We processed the IAT data using the D-score algo-                                products in this category with older or newer production
rithm4 (Greenwald, Nosek, and Banaji 2003; Lane Kristin                              dates are better, or whether production date doesn’t matter.”
et al. 2007), which calculates standardized response time dif-                       The presentation order of the 39 product categories was
ference between compatible and incompatible trials. Fig. 1                           randomized.
shows the distributions of D-scores (Greenwald, Nosekand,                                Fig. 2 shows the frequency of “newer is better” versus
and Banaji 2003). The average D-score was 0.77                                       “older is better” ratings, with three apparent clusters emerg-
(t(235) = 34.80, p < 0.001) in the student sample and 0.82                           ing. For the largest cluster of 21 products (blue dots), most
(t(276) = 35.22, p < 0.001) in the U.S. population sample,                           participants held explicit attitudes that newer options are bet-
both significantly greater than zero. About 96% of participants                      ter. On the other hand, participants rated that older is better for
in each sample exhibited a positive D-score, consistent with                         a cluster of 8 products (red dots), 6 of which are collectibles
them believing “newer is better” and/or “older is worse,” and                        and 2 of which we included because of prior participants list-
about 80% of participants in each sample exhibited a medium                          ing them as examples of “older is better” (wine and whisky).
or larger D-score (D ≥ 0.5; Greenwald et al. 2003). The size                         For a third cluster of 9 products (gray dots), most participants
of the average association is considered large by accepted                           thought that production date did not matter. Finally, attitudes
IAT conventions (Cohen 2013; Nosek, Greenwald, and Ba-                               toward cheese (black dot) were somewhat of an outlier: par-
naji 2005).                                                                          ticipants diverged, with 46% thinking that newer cheese is
    The IAT results suggest that roughly four in five con-                           better and 33% thinking the opposite—suggesting a mix of
sumers hold a medium or larger association between “older”                           freshness and aging considerations.
and “worse” whereas fewer than 5% (weakly) hold the op-                                  We therefore conclude that consumers generally hold ex-
posite association. While these results are quite suggestive,                        plicit attitudes that newer products are better except when old-
implicit associations do not always translate to explicit judg-                      ness explicitly increases quality (wine and whisky) or value
ments (Gawronski and Bodenhausen 2006). We therefore con-                            (collectibles). Between these explicit attitudes and the implicit
ducted a second pilot study of people’s explicit attitudes about                     ones found in the first pilot study, we expect consumers to
“newer” or “older” being better for a variety of product do-                         generally prefer newer options.
mains.                                                                                   Although our IAT results were large in magnitude, they
                                                                                     may not be surprising due to the validity of such an associa-
 Pilot study 2: Explicit attitudes about “newer is better”                           tion as demonstrated in this second pilot study. We therefore
                                                                                     turn to experimental studies to show how such an association
    We designed this study to explore whether people hold ex-                        can impact preferences if overgeneralized to contexts where
plicit attitudes about newer options being better. To gather a                       that relationship should not hold.
broad, representative sample of products, we used the 36 ma-
jor product categories listed on eBay. In addition, we added                                              Study 1: Headphones
cheese, whisky, and wine—three specific examples many par-
ticipants listed as products where “older is better” in an open-                        Study 1 offered participants a choice between two simi-
ended pretest.                                                                       lar headphones. We manipulated the newness of the choice
                                                                                     options by randomly assigning incidental chronological cues,
                                                                                     so that newness was unrelated to each product’s quality or
  4 D-scores are calculated “using each participant’s block means—once for
                                                                                     features. That is, we made one option merely newer than the
practice combined blocks (Blocks 3 + 6) and once for the critical combined
blocks (Blocks 4 + 7). These are divided by their inclusive standard devia-
                                                                                     other using incidental newness cues but nonetheless expect
tions (i.e., SD of ‘Block 3 merged with 6’ and SD of ‘Block 4 merged with            participants to prefer the newer option (H2a).
7’), generating two scores per participant. These are then averaged, creating
a single D score.” (Carpenter et al. 2019, p. 2197).Following Greenwald,             Methods
Nosek, and Banaji (2003) and Carpenter et al. (2019), we calculated the D-
score by making full use of the practice trials (Blocks 3 and 6). The original
procedure discarded the two practice blocks, and only uses the two critical
                                                                                        We recruited 306 MTurk participants (154 females;
blocks (Blocks 4 and 7). This procedure of calculating D-scores is done by           Mage = 36.53, SD = 11.18; preregistered: http://aspredicted.
dividing the differences between incompatible blocks and compatible blocks           org/blind.php?13:italic x/13:italic = x469kh) to make a
by the standard deviation of all the latencies in the two blocks. D-scores           choice between two headphones: “Suppose your friend wants
are similar to Cohen’s d. The differences lie in the computation of the stan-        to buy Beats Wireless headphones. You accompanied him to
dard deviation: while Cohen’s d computes pooled within-treatment standard
deviation, D-score computes standard deviation from both blocks ignoring
                                                                                     an electronics store. The salesperson has informed you that
their membership. More information can be found in Greenwald, Nosek, and             the store manager has a randomly ordered spreadsheet with all
Banaji (2003, p. 201).                                                               headphones they sell and chose one product to promote each

                                                                                 4
JID: RETAIL
ARTICLE IN PRESS [m5+;January 6, 2022;16:54]
Y. Jie and Y. Li Journal of Retailing xxx (xxxx) xxx
Fig. 1. D-Score distribution for IAT between “older” and “worse” in a) student sample and b) U.S. population sample.
day as ‘Product of the Day.’ ” We counterbalanced which mendation, participants were asked to explain why they chose
headphones were today’s versus yesterday’s promotion. Half what they chose in a free response format.
read that the Beats Solo3 is today’s “Product of the Day”
and the Beats Studio3 is yesterday’s “Product of the Day,” Results
while the other half read the reverse. We then showed partic-
ipants the headphones’ specifications and product images (see Overall, 58.2% of participants (χ 2 (1) = 7.85, p = 0.005,
Fig. 3), explicitly specifying that there is no price discount for against null hypothesis of 50% if chronological cues do not
the “Product of the Day” and that both cost $250. Participants matter) chose the option designated as today’s “Product of
were asked to provide their friend with their recommendation the Day” rather than yesterday’s, significantly greater than ex-
of which headphones to buy. Option orders were randomized pected by chance. Participants also preferred the Beats Solo3
in this and all subsequent studies. After they made a recom- over the Beats Studio3 (62.7% vs. 37.3%, χ 2 (1) = 19.38, p <
5JID: RETAIL
ARTICLE IN PRESS [m5+;January 6, 2022;16:54]
Y. Jie and Y. Li Journal of Retailing xxx (xxxx) xxx
Fig. 2. Number of participants (out of 98) thinking “newer is better” (vertical axis) versus “older is better” (horizontal axis) across 39 product categories.
Note: We informally clustered product categories as “newer is better” (blue), “older is better” (red), and “production dates did not matter” (gray).
0.001). Despite this overall product preference, 71.3% of par- types of reasons provided between those who chose new ver-
ticipants chose the Beats Solo3 when it was today’s “Product sus old options (χ 2 (5) = 9.37, NS). We found that 50% of
of the Day,” compared with only 54.5% when the Solo3 was participants reported they based their choices on product fea-
yesterday’s “Product of the Day.” This significant difference tures and another 15% based their choices on feature-related
in choice percentages (16.8%, χ 2 (1) = 8.58, p = 0.003) sug- inferences. That is, participants’ choice rationales were mostly
gests that the incidental chronological cue of promotion date related to product features and unrelated to whether one op-
mattered above and beyond the objective quality of the op- tion was newer or older. Even among the 198 participants
tions. who provided feature-related reasons, 75% chose the Beats
Solo3 when it was today’s “Product of the Day” compared
Reasons for choice with only 61% when it was yesterday’s “Product of the Day”
We asked two research assistants blind to our hypothe- (χ 2 (1) = 3.79, p = 0.05). That is, despite explicitly choos-
ses to independently code participants’ self-reported reasons ing based on product features, this subset of participants
for choosing what they chose. Coders were asked to clas- were nonetheless influenced by which option was inciden-
sify reasons into six predetermined categories: 1) Product tally newer. Similar mere newness preference was found for
features—anything directly in the product description or im- the remaining 108 participants in the other categories (66.1%
age (e.g., “I like the longer battery life.”); 2) Inferences from vs. 39.1%, χ 2 (1) = 6.72, p = 0.01).
the product features—anything needing one or more steps of Study 1 adopted a paradigm of choices between chrono-
logic to arrive at a claim (e.g., “seemed like it had more logically older and newer options and provided initial evi-
prestige and award winning technology.”); 3) Just because dence consistent with a “newer is better” implicit association
it’s newer/older (e.g., “It’s today’s special.”); 4) Inferences influencing consumer choices, as opposed to explicit infer-
based on being newer/older (e.g., “New is better.”); 5) Feel- ences about the newer options’ substantive benefits. That is,
ing/ intuition/random (e.g., “because this is how I feel” or although participants’ self-reported rationales largely focused
“I really didn’t have a preference.”); and 6) Anything else on the features offered by each option, their choices were
(nonsense responses). Inter-rater agreement was high (Co- nonetheless influenced by which option was newer on an in-
hen’s κ = 0.86) and raters reconciled any differences by cidental chronological cue. In the next studies, we changed
discussion. our dependent measure to willingness-to-pay (WTP) in order
We present the distribution of each type of self-reported to determine the extent to which consumers place a premium
reasons in Table 1. Overall, there was no difference in the on even merely newer options (H2b).
6JID: RETAIL
ARTICLE IN PRESS [m5+;January 6, 2022;16:54]
Y. Jie and Y. Li Journal of Retailing xxx (xxxx) xxx
Fig. 3. Stimuli for study 1 featuring actual product screenshots from Beats website. Note: Today’s and yesterday’s “Product of the Day” were
randomized.
Table 1
Coding of participants’ self-reported reasons for study 2 choice.
Choice Feature Feature-related Newness Newness /Oldness Gut feeling, intuition, Other Overall
inference /oldnessper se related inference or random
Older 70 19 0 2 15 22 128
Option (54.7%) (14.8%) (0%) (1.6%) (11.7%) (17.2%) (41.8%)
Newer 83 26 8 9 23 29 178
Option (46.6%) (14.6%) (4.5%) (5.1%) (12.9%) (16.3%) (58.2%)
Overall 153 45 8 11 38 51 306
(50.0%) (14.7%) (2.6%) (3.6%) (12.4%) (16.7%)
Note that only eight participants based their choices on “newness per se,” whereas none based their choice on “oldness per se.” We also found that less than
4% of participants made inferences based on chronological newness cues, presumably because the actual product features were more salient, which reduced
participants’ need to rely on inferences from newness or oldness to justify their choices. Nonetheless, their choices were impacted by which option was
randomly assigned a newer incidental chronological cue.
Study 2: WTP for books Method
We designed study 2 to test if consumers’ preference for Two-hundred and sixty-six undergraduates at a large public
merely newer options can translate into higher WTP, us- university (124 females; Mage = 21.19, SD = 1.77; http:
ing an incentive-compatible procedure. We again manipulated // aspredicted.org/ blind.php?13:italic x/13:italic = w4fe68)
mere newness by assigning incidental newness cues. We also read the following information (bolding and underlining in
switched to another product category in which consumers original):
are likely to encounter chronological cues in day-to-day pur- This year on January 1st, 2018, the Goodreads website
chases, books. automatically picked 12 “Books of the Month” for each book
7JID: RETAIL
ARTICLE IN PRESS [m5+;January 6, 2022;16:54]
Y. Jie and Y. Li Journal of Retailing xxx (xxxx) xxx
genre by randomly selecting from the top 100 books in each
genre as rated by their users. That means there’s a Business
Book of January, February, etc., each randomly drawn from
the same pool of top 100 business books published 2017 and
earlier.
In this study, we are giving you the opportunity to
bid on two highly-rated Business books: the "Book of the
Month" randomly selected for last month and the "Book
of the Month" randomly selected for this month. We
will not reveal the titles of these books until after the
study.
Participants then read instructions about the BDM pro-
cedure (Becker Gordon, DeGroot, and Marschak 1964),
a commonly-used incentive-compatible method to measure
WTP (Wang, Venkatesh, and Chatterjee 2007). Participants
specified their maximum WTP or “bid” for each book. Par-
ticipants’ bids would be compared to a price randomly de-
termined by rolling a 20-sided die for each book. If a bid is
higher than the randomly-determined price, then the partic-
ipant pays that price (not the bid); otherwise, nothing hap-
pens. Participants also read that we would randomly select
two students to receive $20 and play out their bids for
real. Participants provided their university email addresses
to be eligible for selection as one of the two students to
receive $20 and have their bids played out for real. Fi-
nally, they indicated their WTP bids for the “Book of the
Fig. 4. Choice scenario screenshot for study 3.
Month” for this month and for last month on separate slid-
ers ranging from $0 to $20 in $1 increments, with order
counterbalanced. Study 3: WTP for chocolates
Methods
Results and discussion
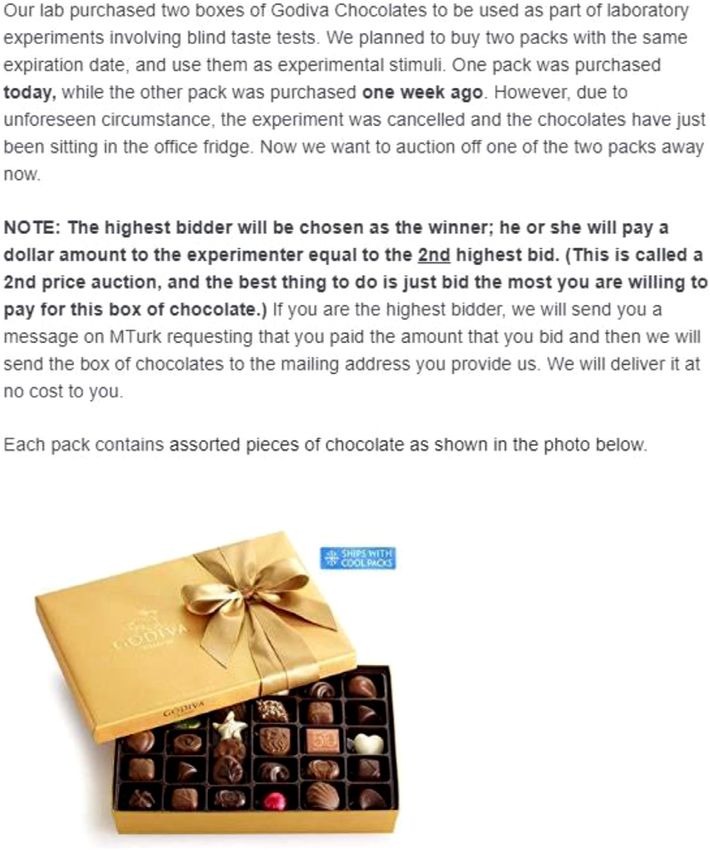
Study 3 manipulated chronological newness in a between-
Overall, participants were willing to pay an average of subjects design. As pre-registered, 204 MTurks (106 females;
$10.93 for this month’s book, $1.50 higher than the $9.43 they Mage = 37.63, SD = 11.72; https:// aspredicted.org/ blind.
were willing to pay for last month’s book (t(265) = 8.09, p php?13:italic x/13:italic=tu8df7) reported their WTP for
< 0.001), a 16% mere newness premium. A non-parametric a box of Godiva chocolates purchased either today or 1 week
Wilcoxon signed-ranked test also yielded a significant dif- ago for an experiment but which had gone unused because
ference in WTP (v = 12,260, p < 0.001). We also asked the experiment had been canceled. Importantly, the purchase
participants to report their gender, age, how many books date only made one box merely newer than the other, since
they buy every year, and how many books they read every we explicitly stated that both boxes had the same expiration
year. An ANOVA treating month as a within-subjects vari- date and that they were stored in a fridge. To make choices
able and these individual differences as between-subjects vari- incentive-compatible, we informed participants that the high-
ables yielded only an effect of newness (F(265) = 65.47, p est bidder would pay the experimenter and actually receive
< 0.001), while no other predictors were significant (ps > the box of chocolates by mail (see Fig. 4 below).
0.05).
In studies 1 and 2, we examined mere newness preference Results
in within-subjects designs. In studies 3 and 4, we adopted
between-subjects designs to rule out the possibility that our Participants’ average WTP for the more newly purchased
effect is driven by demand effects.5 chocolates was $11.93, a 43.6% premium over the aver-
age WTP of $8.31 for the chocolates purchased 1 week
ago (t(202) = 2.53, p = 0.01). A regression controlling
5 In fact, if it is a demand effect or participants because inferred meaning
for individual differences in age, gender, and preference
(Grice 1975) in the information provided by the experimenter, this should be for chocolates found effects for purchase date (β = 3.67,
reflected in their self-reported reasons for choice. Only a small percentage of
participants mentioned chronological cues as their reason for choice. More
t(199) = 2.67, p = 0.008) and chocolate preferences
importantly, it still begs the question as to why participants think they should (β = 3.21, t(199) = 4.33, p < 0.001). As a robustness check,
prefer the newer option and not the older one. we also analyzed a subset of 120 more attentive participants
8JID: RETAIL
ARTICLE IN PRESS [m5+;January 6, 2022;16:54]
Y. Jie and Y. Li Journal of Retailing xxx (xxxx) xxx
who spent at least 1 min on the choice scenario page and Mcontrol = 60.82, t(188) = 8.31, p < 0.001) and old con-
found similar results (WTPnew = 12.55, WTP old = 7.56, ditions (Mold = 44.06, t(174) = 14.53, p < 0.001). Par-
t(118) = 2.63, p < 0.01). ticipants in the old condition also perceived the product to
be older than in the control condition (t(190) = 4.46, p
Discussion < 0.001). Despite the significant interaction effect, the pat-
tern of perceived newness ratings was similar across question
Study 3 found a newness premium for a more recently orders, which is consistent with a successful manipulation
purchased box of chocolates, despite it having the same ex- (product beliefs first: Mnew = 88.15 > Mcontrol = 65.55 >
piration date as another box purchased 1 week ago. Studies 2 Mold = 40.28; WTP first: Mnew = 90.79 > Mcontrol = 56.17
and 3 therefore provided consistent support for consumers not > Mold = 47.00). Note that the median participant in the
only preferring merely newer products but even being willing control condition thought the product was produced in 2018
to pay a premium for them. (M = 2017.17, SD = 2.96), which is consistent with these
One potential weakness of study 3 is that we used a food ratings.
domain, which may have accentuated the importance of fresh-
ness concerns. Although we tried to reduce such concerns by Product beliefs
keeping expiration dates the same and specifying that both We formed a product “goodness” index by combining the
boxes were stored in the same fridge, freshness concerns may four product belief items (alpha = 0.83). A 3 (production
still have inflated the size of the newness premium relative date: new vs. old vs. control) × 2 (WTP order: before vs. af-
to more durable product domains. Arguably, the quality of ter product beliefs) ANOVA on the product “goodness” index
many durable goods (e.g., office stationery) does not deteri- found a marginal effect of production date (F(2, 273) = 2.29,
orate over relatively short time spans, which is why retailers p = 0.10) but no effects of question order (F(1, 273) = 1.15,
do not price durables differentially based on their production ns) or date × order interaction (F(2, 273) = 1.10, ns). Al-
dates (i.e., older products do not get marked down when new though the omnibus ANOVA found only a marginal effect
stock arrives). We therefore examined mere newness premi- of production date, pairwise comparisons revealed a signif-
ums in the office stationery domain in our next study. icant difference in product “goodness” between new versus
old conditions (Mnew = 273 vs. Mold = 249, t(174) = 2.05,
Study 4: WTP for post-its p = 0.042), suggesting that participants potentially made in-
ferences about reduced product benefits in the older condi-
Methods tion. The differences between the new and control conditions
(Mnew = 273 vs. Mcontrol = 267, t(188) = 0.58, p = 0.56)
We assigned 279 MTurks into one of three condi- and between the control and old conditions were not signifi-
tions in a between-subjects design (https://aspredicted.org/ cant (t(190) = 1.51, p = 0.13). We thus focus our mediation
blind.php?13:italic x/13:italic = 2qp7k5, 151 females; analyses below on the contrast between the new and old con-
Mage = 39.97, SD = 12.97). Participants indicated their WTP ditions.
for a 24-pack of Post-Its differing in production date (Febru-
ary 2017 vs. February 2020 vs. no-info control). To examine WTP
the role of inference, we also measured participants’ beliefs Most importantly, did production date affect participants’
about product quality, usefulness, as well as predicted joy and WTP for this durable product? A 3 (production date: new
excitement about using the product. The order of the WTP vs. old vs. control) × 2 (WTP order: before vs. after prod-
and product belief questions was counterbalanced. The study uct beliefs) ANOVA found that participants’ WTP differed
also included a perceived newness manipulation check, on a across production dates (F(2, 273) = 15.66, p < 0.001) but
scale from 0 (very old) to 100 (very new), after both WTP found no effect of question order (F(2, 273) = 0.40, ns)
and product belief questions. or date × order interaction (F(2, 273) = 1.48, ns). Par-
ticipants in the new production date condition were will-
Results ing to pay $17.26 for the box of Post-Its, versus $14.42
in the control condition and $12.43 in the old condition
Manipulation check (new vs. old: t(174) = 5.54, p < 0.001; new vs. control:
We first checked whether our between-participants manip- t(188) = 3.48, p < 0.001; old vs. control: t(190) = −2.34,
ulation of production date was successful. A 3 (production p = 0.02), implying a 38.9% ($4.83) newness premium be-
date: new vs. old vs. control) × 2 (question order: WTP be- tween the new and old conditions. Alternatively, we could
fore vs. after product beliefs) ANOVA on participants’ per- view the difference between date conditions as consisting of
ceived newness ratings showed differences across the three a 19.7% ($2.84) newness premium and a 13.8% ($1.99) old-
date conditions (F(2, 273) = 84.24, p < 0.001), with no ness penalty relative to the control condition with no chrono-
question order effect (F(1, 273) = 0.04, ns) but a significant logical cue. Similarly, a regression controlling for individual
date × order interaction effect (F(2, 273) = 3.05, p = 0.049). differences in product need, usage frequency, gender, and age
Participants in the new condition perceived the product to found that, compared to the control condition, the new con-
be newer than in both the control (Mnew = 89.61 vs. dition had $2.53 higher WTP (t(272) = 3.10, p = 0.002)
9JID: RETAIL
ARTICLE IN PRESS [m5+;January 6, 2022;16:54]
Y. Jie and Y. Li Journal of Retailing xxx (xxxx) xxx
Discussion
Study 4 showed that even for more durable goods like
Post-its, consumers are willing to pay more for chronologi-
cally newer products. Importantly, we found both a newness
premium and an oldness penalty compared to the control con-
dition, suggesting that both “newer is better” and “older is
worse” associations contribute to mere newness preference.
Furthermore, the moderated mediation analysis suggested that
this effect is largely not driven by explicit inferences about
the benefits of newness.
So far, we have shown that consumers generally associate
chronologically newer with better and consistent with that,
they choose newer options (H2a) and are willing to pay more
for them (H2b). Next, we used moderation to test the associ-
ation mechanism by using stimuli from product categories in
which older products are associated with being better versus
categories with the more common “newer is better” associ-
Fig 5. Moderated mediation model in study 4. (Note: Production date was ation (H3). Based on pilot study 2, we selected two similar
dummy coded with new = 1 and old = 0; Perceived Newness and Product products with different associations, beer (newer is better) and
“Goodness” were standardized; bootstrapped 95% confidence intervals are wine (older is better). Study 5 used a consequential design
shown in brackets). and randomly assigned incidental newness cues.
and the old condition $1.68 lower WTP (t(272) = −2.06, Study 5: Moderation for red wine versus beer
p = 0.04).
Methods
Mediation analysis
We assigned 301 MTurk participants (179 female;
Next, we examined whether explicit product beliefs ex-
Mage = 37.90, SD = 12.02; preregistered at http://
plained the WTP difference between the new and old con-
aspredicted.org/blind.php?13:italic x/13:italic = 3qk3p2)
ditions. We used the lavaan package in R to estimate the
into either beer or wine conditions. Participants learned that
moderated mediation model depicted in Fig. 5 (Model 14,
our lab had purchased two bottles of beer (red wine) as ex-
Hayes 2018). Fig. 5 also shows the estimation results of this
perimental stimuli, and those bottles were randomly allocated
moderated mediation analysis with 5,000 bootstrapped resam-
for either yesterday’s or today’s experiment. “The experiments
ples. We highlight three main findings from this model. First,
were canceled due to unforeseeable circumstances,” so we
when product beliefs were measured before WTP, we found a
were giving them away. Participants chose between bottles
mediation effect of newer production date→goodness→WTP
originally allocated for yesterday’s experiment or today’s ex-
(indirect effect = $0.59, 95% CI [0.07, 1.55]). Second,
periment. To make choices incentive-compatible, participants
when product beliefs were measured after WTP, the medi-
learned that “one participant will be randomly selected to have
ation effect was completed negated (moderated mediation in-
their chosen bottle sent to him or her.”
dex/effect = -$0.63, 95% CI [−1.83, −0.04]; Hayes 2018).
Although the mediation effect suggests that inferences due to
production date help explain the WTP difference between the Results
old and new conditions, the “full” moderated mediation in the
alternate order suggests that demand effects or desire for in- A manipulation check following the main choice showed
ternal consistency may play a role when product beliefs were that most participants agreed that wine gets better as it gets
elicited before WTP. Third, we found a substantial remaining older (88.04% at least somewhat agree), but disagreed that
direct effect of production date on WTP (c’ = $4.57, 95% CI beer gets better as it gets older (75.08% at least somewhat
[2.87, 6.34], direct effect explains 94.6% of the total effect), disagree; Mwine = 5.61 vs Mbeer = 2.68, t(300) = 28.62,
again suggesting that explicit product beliefs explained little p < 0.001). Consistent with these differences in belief and
of the newness premium. therefore presumably different activated associations for wine
Collectively, the moderated mediation model findings sup- versus beer, participants showed less mere newness preference
port the overgeneralized association mechanism, which does for red wine than for beer: 64.9% (χ 2 (1) = 12.82, p < 0.001)
not require explicit inferences about the substantive benefits of participants chose today’s bottle of red wine whereas
of newness to find mere newness preference (i.e., as revealed 78.0% (χ 2 (1) = 45.93, p < 0.001) of participants chose to-
by the large percentage of the total effect of production date day’s bottle of beer, a significant difference (χ 2 (1) = 6.33,
on WTP being explained by its direct effect). p = 0.01).
10JID: RETAIL
ARTICLE IN PRESS [m5+;January 6, 2022;16:54]
Y. Jie and Y. Li Journal of Retailing xxx (xxxx) xxx
Discussion Methods
Consistent with our preregistered hypothesis, study 5 found We randomly assigned 201 CloudResearch-approved
mere newness preference was reduced when choosing be- MTurk participants (89 females; Mage = 39.00, SD = 11.49;
tween bottles of wine compared to beer. This is consistent preregistered at https:// aspredicted.org/ 4v8zy.pdf) to positive
with consumers’ “older is better” beliefs for wine, as found or negative conditions. Participants read:
in pilot study 2 and in most participants’ stated beliefs in this Our lab is currently selecting short videos to induce spe-
study. cific positive (negative) emotions, such as happiness, grat-
It is important to distinguish between incidental chronolog- itude, and awe (sadness, disgust, and fear). Our research
ical cues and those which offer substantive inferences here. assistants compiled a large list of 60-second videos from
For wine, the date of an experiment for which the wine was TikTok and we are pre-testing what emotions each video
allocated is incidental, whereas production date is not. There- makes people feel and how strongly they feel it. We have
fore, people prefer newer options in the former case, but they been testing one randomly-selected video from this list each
prefer older options in the latter case (as found in pilot study day. However, the most recent test samples were too small
2). Importantly, our results suggested that the irrelevant as- (due to a programming error) and we need more participants
sociation “wines with older production dates are better” may for the videos tested yesterday and the day before yester-
interfere with the default “newer is better” association, thus day. We are asking you to view and rate your feelings for
reducing the mere newness preference for wine as opposed ONE 60-second video that may cause you to feel various
to beer. happiness, gratitude, and awe (sadness, disgust, and fear)
While we believe overgeneralized association is one im- emotions.
portant driver of mere newness preference, it may not be the Participants then chose between yesterday’s video and the
only one. We therefore introduce and test a potential alterna- day before yesterday’s video. They also rated their anticipated
tive mechanism in study 6. emotions for watching each video from −100 (very negative)
to 100 (very positive), with the order of choice and anticipated
emotion questions randomized.
Study 6: Testing an alternative explanation of
psychological distance
Given our focus on choices over existing options (as op- Results and discussion
posed to future options), chronologically newer options are
closer to the present and thus may feel psychologically closer Replicating earlier findings, we found that participants
than chronologically older ones. How might this potential preferred to watch the newer positive video (71.2%,
difference in psychological distance (Trope and Liberman χ 2 (1) = 17.78, p < 0.001). We also found the same degree
2003) affect choices between chronologically newer and older of mere newness preference for watching the newer negative
options? One possible effect of psychological closeness is video (78.4%, χ 2 (1) = 30.06, p < 0.001) with no difference
emotional intensification: research suggests that psychologi- between conditions (χ 2 (1) = 1.37, p = 0.241). This result is
cal distance decreases experienced and anticipated emotional inconsistent with psychological distance decreasing emotional
intensity (Ayduk and Kross 2008; Van Boven et al. 2010; intensity but is consistent with an overgeneralized association
Williams, Stein, and Galguera, 2014). For example, partici- mechanism.
pants asked to imagine receiving an Amazon gift certificate A repeated-measure ANOVA on anticipated emotion rat-
tomorrow expected to have more positive emotional reactions ings revealed a main effect of valence (F(1, 397) = 370.31,
to the gift certificate than participants asked to imagine re- p < 0.001), but no effect of either newness (F(1,
ceiving the gift certificate in a year (Williams et al. 2014, 397) = 1.56, ns) or valence × newness interaction (F(1,
Study 1a). 397) = 0.044, ns). More specifically, participants’ antici-
If psychological closeness intensifies emotional intensity, pated emotions were more positive for both the newer posi-
we would expect greater liking for chronologically newer tive video (Myesterday = 45.76 vs. Mdaybeforeyesterday = 40.43,
positive stimuli, consistent with our findings. However, emo- paired t(103) = 5.33, p = 0.025) and the newer nega-
tional intensification would also predict greater disliking for tive video, although this latter difference was not signif-
chronologically newer negative stimuli. That is, psycholog- icant by conventional standards (Myesterday = −25.47 vs.
ical distance would suggest a reversal of mere newness Mdaybeforeyesterday = −29.26, paired t(96) = 1.44, p = 0.154).
preference for negative stimuli. In contrast, the overgener- Following our preregistration, we tested whether the valence
alized association mechanism suggests that people will still manipulation affected participants’ choices via the differ-
exhibit mere newness preference for negative stimuli. We ences in anticipated emotions. Bootstrapped mediation tests
thus designed a study that crosses chronological newness indicated that there was no mediation effect (β = −0.001,
with stimulus valence. We also again switched product do- 95% CI = [−0.022, 0.005]). These findings again cast doubt
mains, from tangible products in previous studies to digital on the intensification hypothesis predicted by psychological
products. distance.
11JID: RETAIL
ARTICLE IN PRESS [m5+;January 6, 2022;16:54]
Y. Jie and Y. Li Journal of Retailing xxx (xxxx) xxx
General discussion the passage of time confers additional value or quality, such
as antiques, art, and wine. Nonetheless, it seems that prefer-
Consumers are often drawn to newer products because of ences for older products are less common than preferences
their novelty or because they are different from existing prod- for newer product and perhaps more domain-specific. In con-
ucts, which makes them substantively better. The present work trast, results from our first pilot study and study 5 suggest
demonstrates that consumers may also prefer newer prod- that preferences for newer products occur at a more general
ucts that are chronologically newer without being substan- level, owing to a strong default association between newer
tively better. Unlike with traditionally-defined new products and better.
(i.e., novelty-based newness), it is possible for chronolog-
ically newer products to be merely newer if that newness Relation to order effects
does not confer or imply any substantive benefits. For ex-
ample, many packaging updates explicitly keep the underly- The present work also relates to research on order effects.
ing product the same (e.g., “New look, same great taste”). A chronologically newer option is usually a sequentially later
However, even in these cases in which newness is not as- option as well. Research on order effects has found support
sociated with substantive benefits, consumers may nonethe- for both primacy and recency effects (i.e., preferring sequen-
less show a preference for newer options. In six experimental tially earlier or later items) (Carney and Banaji 2012; de Bruin
studies (total n = 1557), we found that consumers prefer and Keren 2003; Li and Epley 2009), suggesting both prefer-
even merely newer options, exhibiting mere newness prefer- ence for earlier (older) and later (newer) options. For two mar-
ence. We proposed and found evidence that mere newness keting related examples of primacy effects, Pandelaere, Millet,
preference is driven at least in part by an overgeneralized as- and Van den Bergh (2010) found that consumers prefer earlier
sociation between newer things being better (and older things versions of songs over a similar version heard later. Similarly,
being worse). Mantonakis, Rodero, Lesschaeve, and Hastie (2009) found
that most consumers preferred earlier samples of wine over
Preferences for newer versus older options later ones. These findings of preferences for earlier stimuli
again seem to demonstrate an oldness preference. However, an
Consumers preferring merely newer options is reminiscent important conceptual difference explains the apparent discrep-
of the logical fallacy of argumentum ad novitatem—arguing ancy between these primacy effect findings and ours. These
that something is better just because it is new. There is also a primacy effects occurred after participants sequentially ex-
sister fallacy with relevance for decision making, argumentum perienced stimuli (e.g., after hearing the songs or tasting the
ad antiquitatem—arguing that something is better based on wine), whereas mere newness preference arises while evaluat-
appeals to tradition, antiquity, or common practice. That is, ing choice options. In other words, these primacy effects were
people may infer that if something has been around for a long found in post-consumption judgments, whereas mere newness
time or if something has always been done a certain way, it preference occurs in pre-consumption judgments.
must be good (e.g., traditional medicines). We see evidence of
this logic in the marketplace: Just as new products advertise Managerial implications
their newness, older products and companies may advertise
their oldness (e.g., Coca-Cola’s “since 1886 ). Practically, this paper can help managers better understand
Consistent with this inference, Eidelman, Pattershall, and the extent to which consumers place a premium on chronolog-
Crandall 2010, 2014 documented a “longevity bias”: prefer- ically newer products, even if there are no substantive benefits
ring things that have existed longer. The apparent contradic- conferred by that newness. Firms can use consumers’ mere
tion between longevity bias and the preference for chronolog- newness preference to their advantage. According to signal-
ically newer options may be reconciled by differences in the ing theory, sellers can send pre-purchase quality signals to
time ranges studied (today vs. yesterday or 10 years ago vs. consumers when buyers and sellers possess asymmetric qual-
100 years ago) and specific study designs. Indeed, one lim- ity information (Boulding and Kirmani 1993). One strategy
itation of our studies is that we have pitted chronologically is therefore to prominently display how chronologically new
newer options against older options that are only somewhat a product is in terms of how recently it was produced, la-
older. Perhaps extremely old products can benefit from old- beled, packaged, shipped, etc. For example, a beekeeper at a
ness in a similar way as collectibles. Notably, the longevity farmer’s market may emphasize that their honey was bottled
bias seems in many cases to be driven by inferences that older this morning, regardless of whether the freshness of honey
products have withstood the test of time. For example, con- relates to its taste or nutritional content.
sumers prefer older drugs over newly launched ones because Our studies suggest that marketers can leverage mere new-
of higher inferred safety (Jie, 2020). In contrast, we deliber- ness preference by using chronological cues to signal newness
ately designed our studies to avoid any substantive inferences in various ways. In retail settings, as in our study 1, stores can
about newness or oldness. generate incidental newness cues with “Product of the Day”
In addition to the “tried and true” inference, our second displays to sell specific products even if no promotion is of-
pilot study’s results (Fig. 2) also suggest that consumers’ pref- fered (e.g., “soup of the day”). This also suggests that retailers
erences for older products generally exist in domains in which should have daily or weekly promotions rather than monthly
12You can also read