Transcriptional programs regulating neuronal differentiation are disrupted in DLG2 knockout human embryonic stem cells and enriched for ...
←
→
Page content transcription
If your browser does not render page correctly, please read the page content below
ARTICLE
                  https://doi.org/10.1038/s41467-021-27601-0                 OPEN

                  Transcriptional programs regulating neuronal
                  differentiation are disrupted in DLG2 knockout
                  human embryonic stem cells and enriched for
                  schizophrenia and related disorders risk variants
                  Bret Sanders1, Daniel D’Andrea 2, Mark O. Collins 3, Elliott Rees2, Tom G. J. Steward 4, Ying Zhu1,
                  Gareth Chapman1, Sophie E. Legge 2, Antonio F. Pardiñas 2, Adrian J. Harwood1, William P. Gray 1,
1234567890():,;

                  Michael C. O’Donovan 2, Michael J. Owen 1,2, Adam C. Errington1, Derek J. Blake 2,
                  Daniel J. Whitcomb 4, Andrew J. Pocklington 2 ✉ & Eunju Shin 1,5 ✉

                  Coordinated programs of gene expression drive brain development. It is unclear which
                  transcriptional programs, in which cell-types, are affected in neuropsychiatric disorders
                  such as schizophrenia. Here we integrate human genetics with transcriptomic data from
                  differentiation of human embryonic stem cells into cortical excitatory neurons. We identify
                  transcriptional programs expressed during early neurogenesis in vitro and in human foetal
                  cortex that are down-regulated in DLG2−/− lines. Down-regulation impacted neuronal dif-
                  ferentiation and maturation, impairing migration, morphology and action potential generation.
                  Genetic variation in these programs is associated with neuropsychiatric disorders and cog-
                  nitive function, with associated variants predominantly concentrated in loss-of-function
                  intolerant genes. Neurogenic programs also overlap schizophrenia GWAS enrichment pre-
                  viously identified in mature excitatory neurons, suggesting that pathways active during
                  prenatal cortical development may also be associated with mature neuronal dysfunction. Our
                  data from human embryonic stem cells, when combined with analysis of available foetal
                  cortical gene expression data, de novo rare variants and GWAS statistics for neuropsychiatric
                  disorders and cognition, reveal a convergence on transcriptional programs regulating exci-
                  tatory cortical neurogenesis.

                  1 Neuroscience and Mental Health Research Institute, Cardiff University, Cardiff CF24 4HQ, UK. 2 MRC Centre for Neuropsychiatric Genetics and Genomics,

                  Cardiff University, Cardiff CF24 4HQ, UK. 3 Department of Biomedical Science, University of Sheffield, Sheffield S10 2TN, UK. 4 Bristol Medical School,
                  University of Bristol, Bristol BS1 3NY, UK. 5 School of Life Sciences, Keele University, Keele ST5 5BG, UK. ✉email: pocklingtonaj@cardiff.ac.uk;
                  e.shin@keele.ac.uk

                  NATURE COMMUNICATIONS | (2022)13:27 | https://doi.org/10.1038/s41467-021-27601-0 | www.nature.com/naturecommunications                               1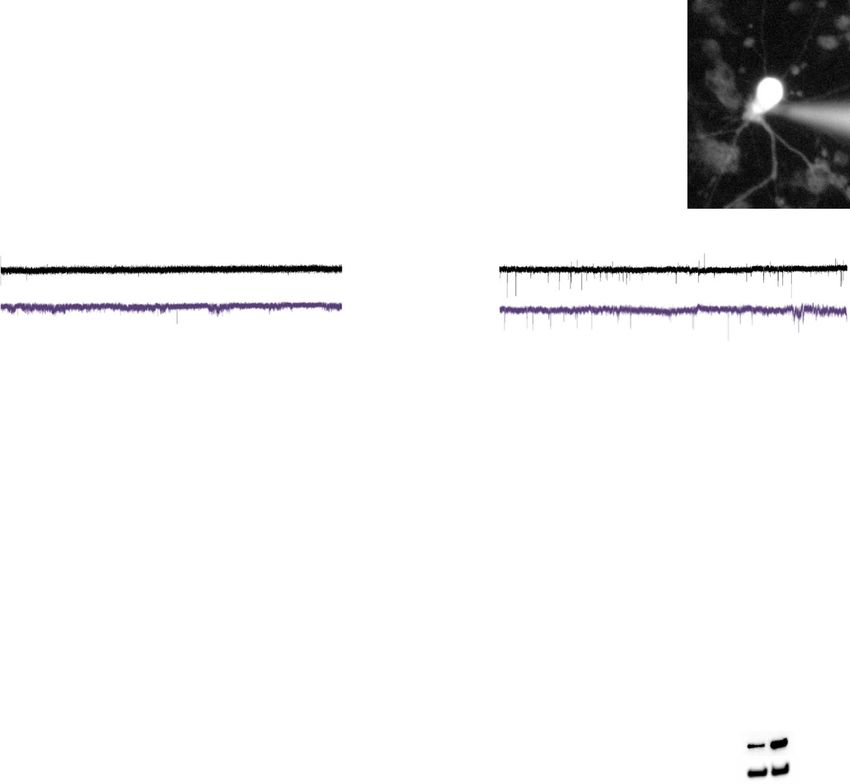
ARTICLE                                                                 NATURE COMMUNICATIONS | https://doi.org/10.1038/s41467-021-27601-0

S
       chizophrenia (SZ) is a highly heritable1,2 psychiatric dis-           developmental and mature neuronal pathways enriched for
       order, with genetic variation ranging from common poly-               common variant association. Finally, we explored whether
       morphisms (SNPs) to rare mutations contributing to                    disease-associated neurogenic programs identified in vitro pos-
disease risk3–7. Rare variant studies consistently implicate dis-            sessed a similar profile of expression across neurodevelopmental
ruption of postsynaptic signaling complexes in SZ etiology4,5,8–11,          cell-types in human fetal cortex.
however the cellular pathways mediating common variant risk
(an estimated 30–50% of the total genetic contribution to                    Results
liability5) remain unclear. Genome-wide association studies                  Knockout generation and validation. DLG2 contains three PDZ
(GWAS) have shown SZ common variant enrichment in broad,                     domains, an SH3 and a GK domain, all involved in protein
synapse-related gene sets12,13, but these sets only capture a                binding. Two DLG2−/− lines were created from H7 hESCs using
modest proportion of the overall common variant association                  the CRISPR/Cas9-D10A nickase system targeting the first PDZ
signal12. In contrast, nearly 50% of genic SNP-based heritability is         domain, generating a frameshift and premature stop codon in
captured by loss-of-function intolerant (LoFi) genes12. Being                both alleles (Supplementary Fig. 1). Sequencing of predicted off-
under extreme selective constraint, LoFi genes are likely to play            target sites revealed no mutations (Methods, Supplementary
important developmental roles. Indeed, LoFi genes are enriched               Fig. 2, Supplementary Data 1). All subsequent analyses compared
for rare variants contributing to autism spectrum disorders (ASD)            these lines to an isogenic WT sister line that underwent the same
and intellectual disability/severe neurodevelopmental delay (ID/             procedure but remained genetically unaltered.
NDD)14, conditions that manifest early in life. Rare variation in               DLG2−/− and WT lines were differentiated into cortical
LoFi genes, including many of those implicated in ASD and ID/                excitatory neurons using a modified dual SMAD inhibition
NDD, also contributes to SZ11,15,16. We hypothesized that a                  protocol28,29; RNA was extracted in triplicate from each line at 4
significant proportion of SZ common variants may contribute to                timepoints spanning cortical excitatory neuron development and
disease via the disruption of neurodevelopmental pathways har-               gene expression quantified (Fig. 1b, Supplementary Fig. 3). A
boring a concentration of LoFi genes.                                        significant decrease in DLG2 mRNA was observed for exons and
   Supporting a neurodevelopmental role for SZ common variants,              transcripts spanning the first PDZ domain, indicating degrada-
there is growing evidence that many such risk factors impact gene            tion via nonsense-mediated decay in DLG2−/− lines (Supple-
expression in the fetal brain17–20 and are enriched in cell-types at         mentary Fig. 4). Quantitative mass spectrometry of peptide-
multiple stages of cortical excitatory neuron development21. This            affinity pulldowns using the NMDA receptor NR2 subunit PDZ
raises the question: do SZ common variants converge on specific               peptide ligand30 identified DLG2 in WT only, confirming the
gene expression programs that are normally activated or repressed            absence of DLG2 in KO lines (Fig. 1c–f, Supplementary Data 2).
during fetal cortical excitatory neuron development? Mutations               Genotyping revealed no CNVs in either DLG2−/− line relative to
disrupting regulators of such programs would be expected to have             WT (Supplementary Fig. 5a). Both DLG2−/− lines expressed
a larger effect size and lower allele frequency than risk variants           pluripotency markers OCT4, SOX2 and NANOG at 100% of WT
impacting individual genes within the program. We therefore                  levels (Supplementary Fig. 5b). Cells were extensively character-
sought rare, single-gene mutations linked to SZ where the affected           ized for their cortical identity using western blotting and
gene is expressed in human fetal brain and has the potential to              immunocytochemistry from days 20–60. Over 90% of day 20
regulate developmental processes. This led us to DLG2. Firstly,              cells were positive for FOXG1, PAX6 and SOX2 and 13,000 protein-coding genes
are enriched for rare mutations in SZ cases4,5,8–11. This raises the         expressed at each timepoint, ~7% displayed altered expression at
possibility that DLG2 may be required for the normal operation of            day 15, rising to 40–60% between days 20 and 30 then decreasing
both adult and developmental signaling pathways relevant to SZ               to ~25% by day 60 (Fig. 1g, Supplementary Data 3).
pathophysiology.
   To explore the role of DLG2 in neurodevelopment we engi-                  Common risk variants implicate disruption of neurogenesis in
neered hESCs with homozygous loss-of-function DLG2 muta-                     SZ. We next tested whether genes differentially expressed in
tions (DLG2−/−) using the CRISPR-CAS9 system. DLG2−/−                        DLG2−/− lines at each timepoint were enriched for SZ common
knockout (KO) and isogenic sister wild-type (WT) hESC lines                  risk variants. Taking summary statistics from the most recent
were differentiated into cortical excitatory neurons and cells were          SZ GWAS available12, we utilized the competitive gene-set
characterized at multiple developmental timepoints to identify               enrichment test implemented in MAGMA31. As expected for
phenotypes and gene expression changes in KO lines (Fig. 1a).                cells of neural lineage, the set of all genes expressed at one or
Neurodevelopmental gene expression programs dysregulated in                  more timepoint in DLG2−/− or WT lines (allWT+KO) was
DLG2−/− lines were identified and analyzed for risk variant                   enriched for common variant association (P = 8.03 × 10⁻²¹,
enrichment, first for SZ and then for related disorders. We                   Ngene = 14,274). To investigate whether genes up-/down-
explored the biological function of disease-associated programs,             regulated at each timepoint displayed SZ association above that
both computationally and experimentally, and evaluated the                   seen for neurodevelopmentally expressed genes in general,
contribution of LoFi genes to common and rare variant associa-               we tested them for association conditioning on allWT+KO.
tions. Returning to SZ, we investigated the relationship between             This revealed enrichment solely for genes down-regulated at day 30

2                NATURE COMMUNICATIONS | (2022)13:27 | https://doi.org/10.1038/s41467-021-27601-0 | www.nature.com/naturecommunications
NATURE COMMUNICATIONS | https://doi.org/10.1038/s41467-021-27601-0 ARTICLE
(30down−/−: Pcorrected = 9.5 × 10⁻⁸ Fig. 2a), coinciding with active Data 5). Iterative refinement via conditional analyses identified
neurogenesis (Fig. 1b). Conditioning on timepoint-specific expres- 23 terms with independent evidence for over-representation
sed genes gave the same result (Supplementary Data 4). (Fig. 2b, Methods). This suggests that loss of DLG2 dysregulates
Compared to allWT+KO, 30down−/− genes were over- transcriptional programs underlying neurogenesis (neuronal
represented in Gene Ontology (GO) terms related to neuronal differentiation, migration and maturation) and implicates these
development, function and migration (Methods, Supplementary processes in SZ etiology.
a
Rare mutation Dlg-Scrib Identification & analysis of
neurogenic transcriptional programs
Foetal brain expression
DLG2 Early-increasing-/-
Gene expression
CRISPR/CAS9 Cell polarity
Differentiation Late
Migration -/-
DLG2-/- & isogenic WT hESCs
Early-stable-/- down-regulated
in DLG2-/- (D30)
Cortical excitatory neuron differentiation Early-transient-/-
D20 D30 D60
NSC NPC Newborn neuron Developing neuron
SZ GWAS
D15 D20 D30 D60
Loss of function (LoF) intolerant genes
RNA seq
DEG: SZ GWAS + GO analysis
Overlap
DLG2-/- (D30: early neurogenesis) Genetic enrichment
de novo LoF (rare) GWAS (common)
- NDD - ASD
Validation
- ASD - ADHD
Cellular phenotypes - SZ - SZ
Cortical deep layer markers
- SIB (control) - BP
Morphological complexity
- MDD
Neuronal Migration
- IQ
Action potential maturity - AD (control)
In vivo neurodevelopmental cell-type expression
Pyramidalhigh - CA1 pyramidal 'specific' genes
Overlap
SZ GWAS
Early-transient-/- Early-stable-/- Early-increasing-/- Late - pyramidalhigh enriched not enriched
b g
Substrate Matrigel Fibronectin Poly-D-lysine + Laminin 4500 up
down
N gene (protein coding)
4000
Media N2B27 without RA N2B27 with RA 3500
LDN +SB 3000
Factors
2500
Processes Neural Induction Neurulation Neurogenesis Synaptogenesis 2000
Newborn Neurons (NNs) Developing Neurons 1500
Cell Types hESCs/NSCs NSCs NPCs
+ NPCs + NNs + NPCs
1000
RNAseq 500
* * * *
0
days 0 5 10 15 20 25 30 35 40 45 50 55 60 Day 15 Day 20 Day 30 Day 60
c Day 30 d Day 30 e Day 60 f Day 60
5×10⁷ 15 5×10⁸ 15
LFQ intensity of DLG2
LFQ intensity of DLG2
DLG2 peptides
DLG2 peptides
4×10⁷ 4×10⁸
No. of unique
No. of unique
10 10
3×10⁷ 3×10⁸
2×10⁷ 5 2×10⁸ 5
1×10⁷ * * 1×10⁸ ** **
**** **** 0 **** **** 0
0 0
-1×10⁷ -5 -1×10⁸ -5
WT KO1 KO2 WT KO1 KO2 WT KO1 KO2 WT KO1 KO2
NATURE COMMUNICATIONS | (2022)13:27 | https://doi.org/10.1038/s41467-021-27601-0 | www.nature.com/naturecommunications 3ARTICLE NATURE COMMUNICATIONS | https://doi.org/10.1038/s41467-021-27601-0
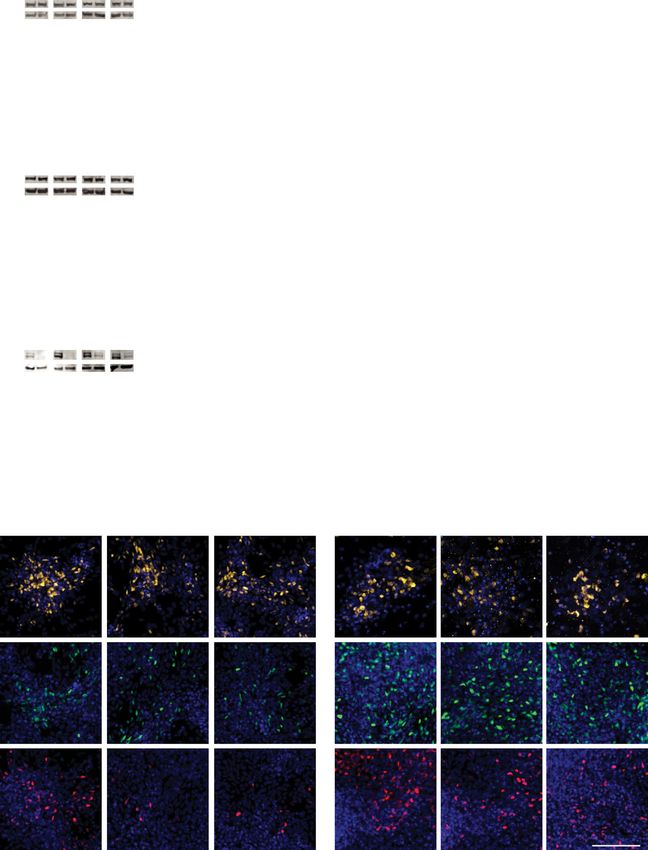
Fig. 1 Study design and number of differentially expressed genes. a Study summary. DLG2−/− and wild-type (WT) hESCs were differentiated into cortical
excitatory neurons and RNA collected at multiple timepoints: predominant cell types shown for each timepoint (NSCs, neural stem cells; NPCs, neural
precursor cells). Genetic analysis of differentially expressed genes (DEG) revealed SZ GWAS enrichment in genes down-regulated at day 30 in DLG2−/−
lines, coinciding with early neurogenesis: corresponding phenotypes predicted via GO term analysis were validated experimentally. Transcriptional
programs active during neurogenesis were identified based on differential gene expression between successive developmental timepoints. Schizophrenia
(SZ) common variant risk was concentrated in two early neurogenic programs down-regulated in DLG2−/− cells. Loss of function intolerant (LoFi) genes
were over-represented in early neurogenic (but not late) programs. LoFi genes in early neurogenic programs were enriched for common/rare variants
contributing to mental disorders (ASD Autism spectrum disorder; ADHD attention-deficit hyperactivity disorder; BP Bipolar disorder; MDD major
depression disorder) and cognition (IQ), but not unaffected siblings of ASD cases (SIB) or Alzheimer’s disease (AD). Overlap with early and late
neurogenic programs captures SZ GWAS association previously reported for genes with high expression in CA1 pyramidal neurons relative to other brain
cell-types (pyramidalhigh). The expression profile seen for each disease-associated neurogenic program in vitro was recapitulated across
neurodevelopmental cell-types from human fetal cortex. b Overview of cortical differentiation protocol with approximate timings of key developmental
processes and predominant cell types present in culture. Asterisks indicate timepoints selected for RNA sequencing. c–f Label free quantification (LFQ) of
DLG2 protein levels in PDZ-ligand (NR2 C-terminus) affinity pulldowns (n = 4 biological repeats each) in day 30 and 60 WT and DLG2−/− cells using LC-
MS/MS analysis. One-way ANOVA with Bonferroni multiple comparison correction applied to c (F2,9 = 45.54, P = 1.96 × 10⁻⁵) and e (F2,9 = 172.9,
P = 6.59 × 10⁻⁸). Kruskal–Wallis test with Dunn’s multiple comparison correction applied to d (H(2) = 10.46, p = 0.0061) and f (H(2) = 11.00,
p = 0.0061). *p < 0.05; **p < 0.01; ****p < 0.0001 vs. WT. g Number of protein coding genes differentially expressed in DLG2−/− cells relative to WT at
each timepoint. Source data are provided as a Source Data file.
DLG2−/− delays cortical cell-fate expression in newborn neu- (Fig. 3b). Total neurite length did not differ (Fig. 3c), leading to a
rons. To validate disruption of neurogenesis in DLG2−/− lines clear DLG2−/− phenotype of longer, relatively unbranched pri-
and investigate whether this leads to differences in the number or mary neurites (Fig. 3e). There was no significant difference in
type of neurons produced, we compared the expression of cell- soma area (Fig. 3d). Day 40 DLG2−/− neurons had a slower speed
type specific markers in DLG2−/− and WT lines from days 30–60 of migration (Fig. 3f) and reduced displacement from their origin
via immunocytochemistry (ICC) and Western blotting after 70 h (Fig. 3g, h). In summary, DLG2−/− neurons show clear
(Fig. 2c–i). From ICC it was clear that DLG2−/− cells are able to abnormalities in both morphology and migration, validating the
differentiate and produce postmitotic neurons expressing char- GO term analysis.
acteristic neuronal markers such as NEUN and TUJ1 plus cor-
tical deep layer markers TBR1 and BCL11B (CTIP2) (Fig. 2c–i,
Supplementary Fig. 7). Western blot of NEUN (Fig. 2c) and DLG2-regulated transcriptional programs enriched for SZ
MAP2 (Supplementary Fig. 7) and quantification of NEUN+ genetic risk. We postulated that loss of DLG2 inhibits the acti-
cells following ICC (Fig. 2f) revealed no difference in the per- vation of transcriptional programs driving neurogenesis, which
centage of neurons produced by DLG2−/− cultures. This is in starts between days 20 and 30 and steadily increases thereafter. If
line with the comparable percentage of cells in the cell cycle/ this is the case, SZ association in 30down−/− should be captured by
neural progenitors at days 30–60 in DLG2−/− and WT cultures genes normally upregulated between days 20 and 30 in WT
indicated by a similar proportion of KI67+ and SOX2+ cells cultures (20–30upWT). Analyzing differential expression between
(Supplementary Fig. 7). At these early timepoints we would not WT samples at successive timepoints, we found risk variant
expect to see the generation of upper layer neurons, which enrichment only in 20–30upWT (conditioning on all WT-
express markers such as SATB2. Although we could identify a expressed genes, Fig. 4a). Most 20–30upWT genes overlapped
small percentage of SATB2+ cells in both WT and KO lines, all 30down−/− (3075 genes, 85%) and this overlap captured the signal
co-expressed CTIP2 (Supplementary Fig. 7) indicating their deep in both sets (Poverlap = 3.23 × 10⁻¹⁰; 30down−/− only P = 0.44;
layer identity32. An analysis of deep layer markers TBR1 and 20–30upWT only P = 0.62). This was not simply due to the size of
CTIP2 revealed a significant decrease in CTIP2+ cells but a the overlap as the regression coefficient for this set (β = 0.14),
comparable proportion of TBR1+ neurons for all timepoints which reflects magnitude of enrichment, was significantly greater
investigated (Fig. 2d, e, g–i). On average the proportion of than for genes unique to 30down−/− (β = 0.006, Pgreater = 0.00077)
CTIP2+ cells recovered from 15% of the WT level on day 30 to or 20–30upWT (β = −0.015, Pgreater = 0.0023). Thus, it is neuro-
50% by day 60, although there was notable variation between genic transcriptional programs that are typically upregulated in
DLG2−/− lines (Supplementary Fig. 8); total CTIP2 protein levels WT but down-regulated in DLG2−/− lines that are enriched for
also recovered to some extent, but at a slower rate (Supple- SZ common variants.
mentary Fig. 8). Thus, DLG2−/− does not affect the rate at which To more precisely identify SZ-associated transcriptional
neurons are produced but delays the expression of subtype programs active during neurogenesis, we classified 20–30upWT
identity in newborn deep layer neurons. genes based on their subsequent WT expression profiles
(Fig. 4b, Methods). These included early-increasing genes,
whose expression continues to rise between days 30 and 60;
DLG2−/− lines display deficits in neuron morphology & early-stable genes, whose expression stays at a relatively
migration. Given the over-representation of 30down−/− genes in constant level; and early-transient genes, whose expression is
terms related to neuron morphogenesis and migration (Fig. 2b), later down-regulated. We also defined a set of late genes, whose
we sought to experimentally validate these phenotypes. Immature expression only increases significantly after day 30. These were
(day 30) and mature (day 70) neurons were traced and their further partitioned into genes that were down-regulated at day
morphology quantified (Fig. 3). At both timepoints DLG2−/− 30 in DLG2−/− lines (e.g., early-stable−/−) and those that were
neurons displayed a simpler structure than WT, characterized by not (e.g., early-stableWT only). The sole exception to this was the
a similar number of primary neurites projecting from the soma late set, which had minimal overlap with 30down−/− (62 out of
(Fig. 3a) but with greatly reduced secondary neurite branching 1399 genes) and was therefore left intact.
4 NATURE COMMUNICATIONS | (2022)13:27 | https://doi.org/10.1038/s41467-021-27601-0 | www.nature.com/naturecommunicationsNATURE COMMUNICATIONS | https://doi.org/10.1038/s41467-021-27601-0 ARTICLE
Early-stable−/− and early-increasing−/− sets were robustly remained highly associated when conditioning on fetal neuron-
enriched for SZ association (Fig. 4c). To more precisely control expressed genes (Supplementary Data 6). Furthermore, allWT+KO
for association specifically in neuron-expressed genes, we identified displayed association that was not captured by fetal neuron-
genes expressed in newborn and developing cortical excitatory expressed genes. We therefore continued to condition genetic
neurons from a recent single-cell RNAseq study of human fetal analyses on allWT+KO, as this best captures the broad SZ signal
brain tissue32 (Methods). Early-stable−/− and early-increasing−/− from neuronal-lineage genes present in our dataset.
a 9 up
b
8 down GO term Noverlap OR P overlap overlap
Pcorrected
7 (DLG2-/- vs WT DEG)
-log10(PGWAS)
6 DNA binding transcription factor activity RNA polymerase II specific 504 1.86 5.71x10⁻²³ 2.36x10 -19
5
axon 149 3.18 4.76x10⁻²⁰ 1.97x10 -16
4
-18
3 Bonferroni P=0.05 regulation of cell morphogenesis 164 2.72 7.44x10 3.07x10 -14
2
positive regulation of neuron projection development 96 3.93 7.99x10⁻¹⁷ 3.30x10 -13
1
0 neuron projection morphogenesis 157 2.60 4.48x10⁻¹⁶ 1.85x10 -12
Day 15 Day 20 Day 30 Day 60
synaptic membrane 80 4.30 1.77x10⁻¹⁵ 7.29x10 -12
c Day 30 Day 40 Day 50 Day 60 kDa
+/+ -/- +/+ -/- +/+ -/- +/+ -/- 3.62x10 -13
1.49x10 -9
NEUN 58 peptidyl serine phosphorylation 82 3.53
GAPDH 6.89x10 -10
2.85x10 -6
32
regulation of small GTPase mediated signal transduction 104 2.39
5 DLG2+/+
DLG2-/- calcium ion regulated exocytosis 23 10.77 1.67x10⁻⁸ 6.90x10 -5
4
9.34x10⁻⁸ 0.00039
NEUN/GAPDH
synapse assembly 38 4.05
3
2 positive regulation of axonogenesis 30 5.02 1.92x10⁻⁷ 0.00079
1 membrane depolarization 27 5.27 4.91x10⁻⁷ 0.0020
0 microtubule end 20 7.80 1.06x10⁻⁶ 0.0044
-1 neurotransmitter receptor complex 26 5.08 1.15x10⁻⁶ 0.0047
Day 30 Day 40 Day 50 Day 60
neuron recognition 22 6.44 1.22x10⁻⁶ 0.0050
d Day 30 Day 40 Day 50 Day 60 kDa
+/+ -/- +/+ -/- +/+ -/- +/+ -/-
80 regulation of adherens junction organization 32 3.95 1.31x10⁻⁶ 0.0054
TBR1
GAPDH modification dependent protein binding 62 2.39 1.60x10⁻⁶ 0.0066
5 32 protein import into nucleus 37 3.34 2.04x10⁻⁶ 0.0084
4 ubiquitin like protein ligase activity 80 2.09 1.93x10⁻⁶ 0.0080
TBR1/GAPDH
3
protein phosphorylated amino acid binding 23 5.38 2.93x10⁻⁶ 0.012
2
regulation of synapse assembly 28 4.10 4.03x10⁻⁶ 0.017
1
0
neuron migration 27 3.95 8.66x10⁻⁶ 0.036
-1 calcium ion transport into cytosol 27 3.95 8.66x10⁻⁶ 0.036
Day 30 Day 40 Day 50 Day 60
e Day 30 Day 40 Day 50 Day 60 kDa f g h
+/+ -/- +/+ -/- +/+ -/- +/+ -/- 132
CTIP2 120 100 50
GAPDH
****
100
32.5 80 40
25
TBR1+ nuclei (%)
NEUN+ nuclei (%)
CTIP2+ nuclei (%)
80
CTIP2/GAPDH
20 60 30
60
****
15 40 40 20
*
***
20
***
10 20 10
****
0
5
0 0
-20
0
-40 -20 -10
Day 30 Day 40 Day 50 Day 60 Day 30 Day 40 Day 50 Day 60 Day 30 Day 40 Day 50 Day 60 Day 30 Day 40 Day 50 Day 60
i WT (DLG2+/+)
Day 30 cortical differentiation
KO1 (DLG2-/-) KO2 (DLG2-/-) WT (DLG2+/+)
Day 60 cortical differentiation
KO1 (DLG2-/-) KO2 (DLG2-/-)
NEUN DAPI
TBR1 DAPI
CTIP2 DAPI
100μm
NATURE COMMUNICATIONS | (2022)13:27 | https://doi.org/10.1038/s41467-021-27601-0 | www.nature.com/naturecommunications 5ARTICLE NATURE COMMUNICATIONS | https://doi.org/10.1038/s41467-021-27601-0
Fig. 2 Common risk variants implicate disruption of neurogenesis in schizophrenia. a Schizophrenia GWAS association in genes up-/down-regulated
(DEG) at each timepoint (DLG2−/− relative to WT), conditioning on all expressed genes. b Gene ontology (GO) terms over-represented amongst genes
down-regulated at day 30 in DLG2−/− lines relative to all expressed genes (one-sided Fisher’s Exact Test). Number of overlapping genes (Noverlap),
enrichment odds ratio (OR), plus raw and Bonferroni-corrected p values are given (Poverlap, Poverlapcorrected), where correction is for the total number of GO
terms tested. c NEUN western blot protein quantification. Neither genotype (F1,90 = 0.1852; P = 0.6680) nor time (F3,90 = 0.5382; P = 0.6573) had
significant effects on NEUN expression (WT n = 10, 9, 10, 9; KO n = 14, 14, 16, 16 biological repeats from 2 independent experiments for each genotype,
days 30, 40, 50 & 60 respectively). d TBR1 western blot protein quantification. Neither genotype (F1,95 = 0.3899; P = 0.5338) nor time (F3,35 = 0.5052;
P = 0.6793) had significant effects on TBR1 expression (WT n = 10, 10, 9, 10 biological repeats, days 30, 40, 50 & 60 respectively; KO n = 16 biological
repeats at each timepoint; from 3 independent experiments for each genotype). e CTIP2 western blot protein quantification. Genotype (F1,86 = 39.89;
P = 1.14 × 10⁻⁸) and time (F3,86 = 5.262; P = 0.0022) had significant effects on CTIP2 expression (WT n = 10, 7, 7, 10; KO n = 17, 12, 13, 18 biological
repeats; from 2 independent experiments for each genotype, days 30, 40, 50 & 60 respectively). f ICC quantification of NEUN+ cells. Time (F3,52 = 7.018,
P = 0.0005) had a significant effect on NEUN expression; genotype (F1,52 = 1.687; P = 0.1998) did not (WT n = 6 biological repeats; KO n = 9 biological
repeats from 2 independent experiments at each timepoint for each genotype). g ICC quantification of TBR1+ cells. Time (F3,58 = 4.738, P = 0.0050) had a
significant effect on TBR1 expression; genotype (F1,58 = 1.664; P = 0.2022) did not (WT n = 7, 6, 6, 7; KO n = 11, 9, 9, 11 biological repeats from 3, 2, 2, 3
independent experiments for each genotype, days 30, 40, 50 & 60 respectively). h ICC quantification of CTIP2+ cells. Genotype (F1,67 = 101.8;
P = 4.46 × 10⁻¹⁵) and time (F3,67 = 18.93; P = 5.33 × 10⁻⁹) had significant effects on CTIP2 expression (WT n = 10, 6, 6, 7; KO n = 17, 9, 9, 11 biological
repeats from 3, 2, 2, 3 independent experiments for each genotype, days 30, 40, 50 & 60 respectively). i Representative ICC images of NEUN, TBR1 and
CTIP2 with DAPI nuclear counterstain. Western blotting (c–e) and ICC data (f–h) were analyzed by two-way ANOVA with post hoc comparisons using
Bonferroni correction, comparing to WT controls. Stars indicate Bonferroni-corrected p values, *P < 0.05; **P < 0.01; ***P < 0.001; ****P < 0.0001 vs. WT
control. Source data are provided as a Source Data file.
In summary, SZ GWAS association during early neurogenesis expression of sub-type specific properties and would be
is restricted to 2 transcriptional programs down-regulated in predicted to regulate early-increasing−/− genes. Since early-
DLG2−/− lines. transient−/− is hypothesized to initiate the cascade, we predicted
that early-increasing−/− would be enriched for indirect targets
of CHD8 – genes not directly regulated but whose expression is
Transcriptional cascade predicted to drive early neurogenesis. down-regulated in CHD8 knockdown cells36. We also predicted
We next investigated the biological function of early neurogenic that genes in the earliest, most transitory phase of the cascade
programs dysregulated in DLG2−/− lines. Each was over- (i.e., early-transient−/−) would not be enriched for targets
represented for a coherent set of GO terms indicating a distinct of terminal phase regulators (BCL11B and TBR1). FMRP
biological role (Supplementary Data 7): early-transient−/− for represses the translation of its mRNA targets, facilitating their
histone/chromatin binding and transcriptional regulation; translocation to distal sites of protein synthesis41,45, and its
early-stable−/− for signal transduction, transcriptional regula- function is known to be important for axon and dendrite
tion, neurogenesis, cell projection development, migration growth46. We therefore predicted that early-stable−/− (but not
and differentiation; and early-increasing−/− for axon guidance, early-transient−/−) would also be enriched for FMRP targets.
dendrite morphology, components of pre- and post-synaptic Over-representation tests confirmed these predictions, support-
compartments and electrophysiological properties. These ing the existence of a regulatory cascade driving early
functions suggest a linked, time-ordered cascade of transcrip- neurogenic programs disrupted in neuropsychiatric disorders
tional programs spanning early neurogenesis. This begins with (Fig. 4d). In addition, the targets of TCF4, FMRP, BCL11B and
an initial phase of chromatin remodeling (early-transient−/−) TBR1 were more highly enriched for SZ association than other
that establishes neuron sub-type identity and leads to activation genes in early-increasing−/− (Fig. 4d), highlighting specific
of a longer-term program guiding the growth and migration of pathways through which these known risk genes may contribute
newborn neurons (early-stable−/−). This in turn promotes the to disease.
development and fine-tuning of sub-type specific neuronal
structure, function and connectivity as cells enter the terminal
phase of differentiation (early-increasing−/−). Convergence of genetic risk on perturbed action potential
To test support for the existence of such a cascade and its generation. We next tested whether biological processes over-
disruption in disease, we identified disease-associated regula- represented in early-stable−/− or early-increasing−/− (Supple-
tory genes from each program whose downstream targets have mentary Data 7) captured more or less of the SZ association in
been experimentally identified or computationally predicted these programs than expected (Methods). Iterative refinement
(Methods). Reflecting our hypothesis that dysregulation of identified 13 GO terms with independent evidence for over-
these pathways is likely to play a role in multiple neurodeve- representation in early-stable−/−. Genetic association for these
lopmental disorders, we sought regulators linked to SZ, ASD terms did not differ substantially from early-stable−/− as a
and ID/NDD. This led us to chromatin modifier CHD833–37 whole (Supplementary Data 8), indicating that risk factors are
from early-transient−/−; transcription factor TCF412,38–40 and distributed relatively evenly between them. None of the 16
translational regulator FMRP12,41,42 from early-stable−/−; and independent terms identified for early-increasing−/− showed
transcription factors (and deep layer markers) TBR142,43 and evidence for depleted association, suggesting that diverse bio-
BCL11B (CTIP2)12,13,42,44 from early-increasing−/−. logical processes regulating neuronal differentiation, morphol-
To link successive phases of the cascade, we predicted that ogy and function are perturbed in SZ. However, somatodendritic
each program would be enriched for direct targets of regulators compartment and membrane depolarization during action
in the immediately preceding program: early-stable−/− for potential were more highly associated than early-increasing−/−
CHD8 targets, early-increasing−/− for TCF4 and FMRP. TBR1 as a whole (Fig. 4e). Enhanced enrichment in action potential
and BCL11B play important roles in the developmental (AP) related genes is noteworthy: while postsynaptic complexes
6 NATURE COMMUNICATIONS | (2022)13:27 | https://doi.org/10.1038/s41467-021-27601-0 | www.nature.com/naturecommunicationsNATURE COMMUNICATIONS | https://doi.org/10.1038/s41467-021-27601-0 ARTICLE Fig. 3 DLG2−/− lines display deficits in neuron morphology & migration. a The number of primary neurites (projecting from the soma). Neither genotype (F1,126 = 1.591; P = 0.2095) nor time (F1,126 = 2.278; P = 0.1337) had significant effects the numbers of primary neurites. b The number of secondary neurites (projecting from primary neurites). Genotype (F1,126 = 18.78, P = 2.97 × 10⁻⁵) had a significant effect on number of secondary neurites, while time (F1,126 = 1.082, P = 0.3003) did not. c The total neurite length. Both genotype (F1,126 = 4.568; P = 0.0345) and time (F1,126 = 26.33; P = 1.06 × 10⁻⁶) had significant effects on total neurite length. However, post hoc analysis showed no significant differences at individual timepoints. d The soma area. Neither genotype (F1,136 = ; P = 0.9170) nor time (F1,136 = 1.399; P = 0.2390) had a significant effect on soma area. For a–d WT n = 32, 38 cells from 3 independent experiments, days 30 & 70 respectively; KO n = 32, 28 cells from 3 independent experiments, days 30 & 70 respectively. e Representative traces showing the neuronal morphology. f The average speed of neuronal migration over 70 h, from day 40 of cortical differentiation. DLG2−/− neurons showed significantly decreased average migration speed compared to WT (t52 = 6.1175; P = 1.26 × 10⁻⁷; n = 27). For f–g both WT & KO n = 27 cells from 3 independent experiments. g The displacement of neurons at 70 h migration. DLG2−/− neurons showed significantly decreased displacement compared to WT (t52 = 3.244; P = 0.0021; n = 27). h Representative traces of neuronal migration from a given origin over 70 h. Morphology data sets (a–d) were analyzed by two-way ANOVA with post hoc comparisons using Bonferroni correction, comparing to WT controls. Migration data sets (f, g) were analyzed by unpaired two-tailed Student’s t test. Stars above bars represent, **P < 0.01; ****P < 0.0001 vs. WT control (Bonferroni-corrected for morphology analyses). Source data are provided as a Source Data file. regulating synaptic plasticity are robustly implicated in membrane potential (Fig. 5a). Upon stepped current injection, SZ4,5,8–11, this suggests that the molecular machinery underlying 80% of WT neurons but only 43% of DLG2−/− neurons showed AP generation is also disrupted. We therefore sought to confirm AP firing (Fig. 5c). APs produced by DLG2−/− neurons were the disruption of APs in DLG2−/− lines (Fig. 5a–j), also inves- characteristic of less mature neurons (Fig. 5d), having smaller tigating the impact of DLG2 loss on synaptic transmission amplitude, longer half-width and a slower maximum rate of (Fig. 5l–n). depolarization and repolarisation (δV/δt) (Fig. 5e–h). We found no In line with the above, DLG2−/− neurons were found to be change in AP voltage threshold, rheobase current (Fig. 5i, j) or less excitable, with immature AP waveforms. Day 50 DLG2−/− input resistance (Fig. 5b). In addition, the percentage of neurons neurons displayed a significantly more depolarized resting displaying spontaneous excitatory postsynaptic currents (EPSCs) NATURE COMMUNICATIONS | (2022)13:27 | https://doi.org/10.1038/s41467-021-27601-0 | www.nature.com/naturecommunications 7
ARTICLE NATURE COMMUNICATIONS | https://doi.org/10.1038/s41467-021-27601-0
was comparable at days 50 and 60 (Fig. 5n) as was EPSC frequency Neurogenic programs capture genetic association in LoFi
and amplitude (Fig. 5l, m). Lack of effect on synaptic transmission genes. Having identified neurodevelopmentally expressed path-
may reflect compensation by DLG4, whose expression shows a ways enriched for common SZ risk variants and investigated the
trend towards an increase in synaptosomes from day 65 DLG2−/− phenotypic consequences of their dysregulation in DLG2−/−
neurons (Fig. 5o). In summary, developing DLG2−/− neurons have lines, we sought to test our hypothesis that these pathways cap-
a reduced ability to fire and produce less mature APs. ture a significant proportion of the SZ GWAS enrichment seen in
a b
(N gene) Early-increasing
9
Up 20-30upWT and 30-60upWT
8 (3624) Down
Late
-log10(PGWAS)
7
30-60upWT not 20-30upWT
6
Expression
5
20-30upWT Early-stable
4
20-30upWT and 20-60upWT
3 Bonferroni
P=0.05 (2122) not 30-60upWT
2
(2042)
1 (2121) Early-transient
(2058) (3492)
0 20-30upWT not 20-60upWT
D20 vs 15 D30 vs 20 D60 vs 30 Day 20 Day 30 Day 60
c Gene expression profile N tested β SE P GWAS GWAS
Pcorrected
Late 1348 0.0025 0.0031 0.47 1
Early-increasing-/- 526 0.23 0.051 5.31x10⁻⁶ 3.72x10⁻⁵
Early-increasingWT only 181 0.0014 0.086 0.49 1
Early-stable-/- 1672 0.16 0.029 1.04x10⁻⁸ 7.25x10⁻⁸
Early-stableWT only 207 0.012 0.076 0.44 1
Early-transient-/- 796 -0.014 0.040 0.64 1
Early-transientWT only 129 -0.079 0.097 0.79 1
d Regulator targets N expressed N overlap OR P overlap overlap
Pcorrected β PGWAS GWAS
Pcorrected
-20 -19
BCL11B targets (predicted) 695 81 3.81 2.52x10 5.28x10 0.39 0.0035 0.035
TBR1 targets (predicted) 280 55 6.88 1.15x10⁻²⁴ 2.42x10⁻²³ 0.44 0.0039 0.039
Early FMRP targets 816 143 7.07 9.14x10-59 1.92x10-57 0.34 0.00067 0.0067
increasing-/- TCF4 targets (direct) 3544 231 2.39 2.60x10⁻²¹ 5.45x10⁻²⁰ 0.33 6.01x10 -5 0.00060
(536) CHD8 targets (indirect, up) 562 8 0.36 1 1
CHD8 targets (indirect, down) 315 37 3.60 6.83x10⁻¹⁰ 1.43x10⁻⁸ -0.33 0.086 0.86
CHD8 midfoetal targets (direct) 2549 88 0.90 0.82 1
overlap
Regulator targets N expressed N overlap OR P overlap Pcorrected β P GWAS GWAS
Pcorrected
BCL11B targets (predicted) 695 132 1.78 2.92x10⁻⁸ 6.14x10⁻⁷ 0.021 0.85 1
TBR1 targets (predicted) 280 43 1.34 0.051 1
Early FMRP targets 816 306 5.15 7.60x10-85 1.60x10-83 0.018 0.79 1
stable-/- TCF4 targets (direct) 3544 594 1.73 7.87x10⁻²³ 1.65x10⁻²¹ 0.13 0.0079 0.079
(1713) CHD8 targets (indirect, up) 562 23 0.30 1 1
CHD8 targets (indirect, down) 315 53 1.50 0.0064 0.13
-48
CHD8 midfoetal targets (direct) 2549 537 2.40 1.8x10 3.78x10-47 0.031 0.52 1
overlap
Regulator targets N expressed N overlap OR P overlap Pcorrected β P GWAS GWAS
Pcorrected
BCL11B targets (predicted) 695 31 0.75 0.95 1
TBR1 targets (predicted) 280 8 0.47 0.99 1
Early FMRP targets 816 49 1.04 0.41 1
transient-/-
TCF4 targets (direct) 3544 200 0.97 0.67 1
(826)
CHD8 targets (indirect, up) 562 13 0.38 1 1
CHD8 targets (indirect, down) 315 19 1.05 0.46 1
CHD8 midfoetal targets (direct) 2549 231 1.87 8.05x10⁻¹⁴ 1.69x10⁻¹² 0.050 0.49 1
e GO Term N β SE P GWAS GWAS
Pcorrected
Calcium ion regulated exocytosis 11 -0.098 0.36 0.79 1
Positive regulation of filopodium assembly 7 1.28 0.48 0.0079 0.13
Glutamate receptor activity 8 -0.57 0.45 0.21 1
Solute cation antiporter activity 7 0.32 0.38 0.41 1
Postsynaptic specialization membrane 9 0.64 0.42 0.13 1
Positive regulation of axon extension 6 0.62 0.42 0.14 1
Membrane depolarization during action potential 8 1.48 0.44 0.00072 0.011
Regulation of neurotransmitter secretion 12 -0.049 0.30 0.87 1
Regulation of dendrite morphogenesis 11 0.46 0.35 0.19 1
Postsynaptic membrane 22 0.33 0.28 0.23 1
Axon guidance 24 0.27 0.24 0.25 1
Modulation of chemical synaptic transmission 43 0.29 0.18 0.11 1
Anterograde trans synaptic signaling 44 0.15 0.17 0.37 1
Presynapse 32 0.20 0.21 0.35 1
Somatodendritic compartment 47 0.81 0.18 4.26x10⁻⁶ 6.82x10⁻⁵
Generation of neurons 95 0.33 0.12 0.0059 0.094
8 NATURE COMMUNICATIONS | (2022)13:27 | https://doi.org/10.1038/s41467-021-27601-0 | www.nature.com/naturecommunicationsNATURE COMMUNICATIONS | https://doi.org/10.1038/s41467-021-27601-0 ARTICLE Fig. 4 DLG2 regulates a cascade of transcriptional programs driving neurogenesis & differentiation. a Enrichment for common schizophrenia risk variants in genes up- & down-regulated between each successive pair of timepoints in wild-type (WT), conditioning on all WT-expressed genes. Dotted line indicates Pcorrected = 0.05 following Bonferroni correction for 6 tests. b Four discrete transcriptional programs initiated following the onset of neurogenesis were identified based upon WT differential expression between timepoints: early-increasing, genes significantly upregulated between days 20 and 30 (20–30upWT) and also days 30 and 60 (30–60upWT); early-stable genes, present in 20–30upWT and 20–60upWT but not 30–60upWT; early-transient (20–30upWT but not 20–60upWT); and late (30–60upWT but not 20–30upWT). c SZ GWAS enrichment in each transcriptional program, further split into genes that are down-regulated in DLG2−/− lines at day 30 (e.g., early-stable−/−) and those that are not (e.g., early-stableWT only). One-sided tests were performed using MAGMA, conditioning on all expressed genes (allWT+KO); raw and Bonferroni-corrected p values are given (PGWAS, PGWAScorrected), where correction is for the 7 gene-sets tested. d A one-sided, Fisher’s Exact Test was used to identify programs over- represented for the targets of key regulators when compared to allWT+KO; both raw and Bonferroni-corrected p values are given (Poverlap, Poverlapcorrected), where correction is for the 21 tests performed (3 programs x 7 regulators). All 10 program-regulator enrichments with corrected P < 0.05 were taken forward for genetic analysis. Two-sided tests were performed in MAGMA to investigate whether regulator targets were more highly enriched for SZ association than other genes in that program, conditioning on allWT+KO and the program as a whole. Raw and Bonferroni- corrected p values are given (PGWAS, PGWAScorrected), where correction is for the 10 sets tested. e SZ GWAS enrichment in GO terms with independent evidence of over-representation amongst early-increasing−/− genes, two-sided tests were performed using MAGMA, conditioning on all expressed and all early-increasing−/− genes. Raw and Bonferroni-corrected p values are given (PGWAS, PGWAScorrected), where correction is for the 16 terms tested. Bold indicates tests surviving Bonferroni correction. Source data are provided as a Source Data file. LoFi genes12. We predicted that LoFi genes would primarily be (Fig. 6c–f). Dysregulation of transcriptional programs under- concentrated in earlier transcriptional programs where the impact lying cortical excitatory neurogenesis thus contributes to a wide of disruption is potentially more severe. LoFi genes were over- spectrum of neuropsychiatric disorders. Furthermore, robust represented in all early neurogenic programs but notably depleted enrichment of early-stable−/− and early-increasing−/− for IQ in the late set (Fig. 6a). LoFi SZ association was captured by the association (Fig. 6e, f) suggests that perturbation of neurogenic overlap with early-stable−/− and early-increasing−/−, localizing programs may contribute to the emergence of cognitive the GWAS signal to a fraction of LoFi genes (less than a third) symptoms in these disorders. located in specific neurogenic pathways (Fig. 6b). Under our proposed model, early-transient−/− initiates activation of other early neurogenic programs, thus its SZ association seen in mature neurons captured by neurogenic dysregulation has the potential to cause more profound programs. DLG2 plays an essential role26 in scaffolding mature developmental deficits. We speculated that – while displaying postsynaptic complexes implicated in SZ4,5,8–11. Our data no evidence for SZ GWAS association – LoFi genes in early- indicates that it also regulates early developmental pathways transient−/− would be enriched for rare mutations linked to SZ harboring SZ genetic risk. To further explore the relationship and/or more severe neurodevelopmental disorders. All early between developmental and adult disease mechanisms, we neurogenic programs displayed a markedly elevated rate of de investigated the extent to which genes from neurogenic pro- novo LoF mutations relative to allWT+KO that was captured by grams contribute to SZ-associated biology in mature excitatory LoFi genes: early-transient−/− for mutations identified in NDD neurons. GWAS association has previously been noted in genes and ASD cases47; early-stable−/− for NDD, ASD and SZ16; and with relatively high expression in CA1 pyramidal neurons early-increasing−/− for NDD (Fig. 6c). De novo LoF mutations compared to other brain cell-types13,54. Although different to from unaffected siblings of ASD cases47 showed no elevation. the sub-types generated by our in vitro protocol, we reasoned In all three programs, a clear gradient of effect was evident that developmental processes shared between these two dorsal from NDD (largest elevation in rate) to ASD to SZ, forebrain-derived neuronal types are likely to account for a visible only in LoFi genes (Fig. 6d). A modest gradient was substantial proportion of the neurogenic programs we have also evident for LoFi genes lying outside early neurogenic identified. Taking the 10% of genes with the highest CA1 programs (‘Other LoFi genes’, Fig. 6d), despite de novo rates pyramidal neuron specificity score54 (pyramidalhigh) we inves- not being robustly elevated here. This suggests the existence of tigated their overlap with neurogenic programs. Pyramidalhigh additional biological pathways harboring disease-associated genes were over-represented in early-stable−/−, early- LoFi genes. increasing−/− and late sets (Fig. 7a). This overlap captured Given the robust rare variant enrichment across multiple GWAS association in pyramidalhigh, but not early-stable−/− or disorders, we investigated whether neurogenic programs are early-increasing−/− (Fig. 7b). In contrast to the late program as also enriched for common variants contributing to disorders a whole (Figs. 4c and 6a), genes in the late-pyramidalhigh other than SZ, analyzing a range of conditions with which SZ is overlap were enriched for SZ association (Fig. 7b) and LoFi known to share heritability: ASD48; attention-deficit/hyperac- genes (OR = 1.43, P = 0.035). Late-pyramidalhigh genes also tivity disorder (ADHD)49; bipolar disorder (BP)50; and major displayed a pattern of enrichment for regulatory targets almost depressive disorder (MDD)51. Since altered cognitive function identical to that of early-increasing−/− (Figs. 4d and 7c), is a feature of all these disorders, we also tested enrichment linking this subset into the terminal phase of the hypothesized for common variants linked to IQ52. All disorders showed transcriptional cascade. evidence for common variant enrichment in one or more early These analyses suggest that the SZ association seen in neurogenic program that was again captured by LoFi genes pyramidal excitatory neurons13,54 may arise from molecular (Fig. 6e, f). In contrast, common variants conferring risk for pathways contributing to early neurogenesis that remain active the neurodegenerative disorder Alzheimer’s disease (AD)53 in post-natal life. To investigate the nature of these pathways, were not enriched. Whereas rare variant enrichment was we performed a functional analysis of SZ-associated gene-sets concentrated towards the initial stages of the transcriptional from Fig. 7b. Pyramidalhigh genes overlapping early-stable−/−, cascade, GWAS association was confined to later stages early-increasing−/− and late sets were over-represented for GO NATURE COMMUNICATIONS | (2022)13:27 | https://doi.org/10.1038/s41467-021-27601-0 | www.nature.com/naturecommunications 9
ARTICLE NATURE COMMUNICATIONS | https://doi.org/10.1038/s41467-021-27601-0
terms linked to dendrite/spine development, calcium-mediated activity (Supplementary Data 9). Thus it appears to be
exocytosis, postsynaptic signaling and synaptic plasticity primarily postsynaptic processes regulating the formation,
(Supplementary Data 9). In contrast, genes unique to early function and plasticity of synaptic connections throughout
neurogenic programs were over-represented for terms linked to development (from the pre-natal period into adulthood) that
the regulation of transcription/neurogenesis, axonogenesis, underlies the mature neuronal contribution to SZ encapsulated
axon guidance, pre-synaptic function and sodium channel by pyramidalhigh.
a Resting membrane potential b Input resistance c Percentage of cells firing APs
0 2.0 Train
DLG2+/+ DLG2-/- DLG2+/+ Train DLG2-/- Single
Single
No AP No AP
-20 1.5
7%
20% 20%
-40 1.0
GΩ
mV
57% 36%
-60 0.5 60%
DLG2+/+ DLG2-/-
-80
* 0.0 n=15 n=14
d e AP height f AP half-width
20mV
80
** 10 ***
5ms
8
60
DLG2+/+ DLG2-/-
mV
ms
! #" 6
! #" 40
#$ #50mV
$ 4
0mV
200ms 20
120pA
2
-60mV
DLG2+/+ DLG2-/- DLG2+/+ DLG2-/-
-60pA
0 0
1s
g Depolarisation h Repolarisation i Spike threshold voltage j Rheobase current k Patch example
δV/δt maximum δV/δt maximum 0 150
150 30
* ** -10
100
100 20 -20
pA
mV
mV/ms
mV/ms
-30
50
50 10
-40
50 μm
-50 0
0 0 DLG2+/+ DLG2-/- DLG2+/+ DLG2-/-
+/+ -/- +/+ -/-
DLG2 DLG2 DLG2 DLG2
l D50 DLG2+/+ m D60 DLG2+/+
D50 DLG2-/- D60 DLG2-/-
40 pA
1 sec 40 pA
1 sec
1.0 1.0 1.0 1.0
0.8 0.8 0.8 0.8
Cummulative probability
Cummulative probability
Cummulative probability
Cummulative probability
60 0.5 60 2.5
0.6 0.6 0.6 0.6
Frequency (Hz)
Frequency (Hz)
Amplitude (pA)
Amplitude (pA)
50 0.4 50 2.0
40 40
0.3 1.5
0.4 30 0.4 0.4 30 0.4
0.2 1.0
20 20
0.2 10 0.2 0.1 0.2 10 0.2 0.5
0 0.0 0 0.0
DLG2+/+ DLG2-/- DLG2+/+ DLG2-/- DLG2+/+ DLG2-/- DLG2+/+ DLG2-/-
0.0 0.0 0.0 0.0
10 20 30 40 50 60 70 80 90100 0 10 20 30 40 50 60 70 80 10 20 30 40 50 60 70 80 90100 0 10 20 30 40 50 60 70 80
Amplitude (pA) Inter-Event Interval (sec) Amplitude (pA) Inter-Event Interval (sec)
n D50 DLG2+/+ D50 DLG2-/- D60 DLG2+/+ D60 DLG2-/- o DLG4 in D65 synaptosomes
0.6
DLG4/CALNEXIN
+/+ -/-
0.4 kDa
100 DLG4
53% 47% 61% 39% 48% 52% 53% 47%
100
CANX
0.2
75
n=34 n=36 n=31 n=30 0.0
DLG2+/+ DLG2-/-
Active Non-active
10 NATURE COMMUNICATIONS | (2022)13:27 | https://doi.org/10.1038/s41467-021-27601-0 | www.nature.com/naturecommunicationsNATURE COMMUNICATIONS | https://doi.org/10.1038/s41467-021-27601-0 ARTICLE
Fig. 5 Electrophysiological properties of DLG2−/− neurons. a Resting membrane potential (t27 = 2.151, P = 0.0406) and b input resistance (t27 = 0.3366,
P = 0.7390) of day 50 WT and DLG2−/− neurons (n = 15 and 14, respectively, unpaired two-tailed t test). c Percentage of cells firing action potentials
(APs) upon current step injection. d Example traces of first overshooting AP and APs evoked by current step injection (−60 pA to 120 pA, increment
20 pA, duration 1 s). e AP height (t16 = 3.661, P = 0.0021), f AP half-width (t16 = 4.462, P = 0.0004), g AP maximum depolarizing speed (t16 = 2.463,
P = 0.0255), h AP maximum repolarising speed (t16 = 3.728, P = 0.0018), i spike threshold voltage (t16 = 0.004093, P = 0.9968) and j rheobase current
(t16 = 0.4061, P = 0.6900) of day 50 WT and DLG2−/− neurons (n = 12 and 6, respectively, unpaired two-tailed t test) are shown. k Example of day 50
neuron being whole-cell patch clamped with fluorescent dye injection. Spontaneous excitatory postsynaptic current (sEPSC) examples from day 50 (l) and
60 (m) neurons. Both the amplitude and frequency of day 50 and 60 neurons from WT and DLG2−/− neurons were comparable by unpaired two-tailed t
test (day 50, amplitude: t68 = 0.6974, P = 0.4879, n = 34 and 36 for WT and KO; frequency: t66 = 0.5467, P = 0.5865, n = 33 and 35 for WT and KO; day
60 amplitude: t59 = 1.021, P = 0.3114, n = 31 and 30 for WT and KO; frequency: t58 = 0.7671, P = 0.4464, n = 30 each for WT and KO). n Percentage of
cells displaying sEPSCs. o Western blot analysis of DLG4 in synaptosomes of day 65 WT and DLG2−/− neurons, displaying trend towards increased DLG4
expression in DLG2−/− neurons (t2 = 2.157, P = 0.1637, n = 2, unpaired two-tailed t test). *p < 0.05; **p < 0.01; ***p < 0.001. All data presented as
mean ± SEM and are from two independent experiments. Source data are provided as a Source Data file.
Neurogenic programs identified in vitro are expressed in during neurogenesis. Based on our findings we propose that they
human fetal cortex. Early neurogenic programs are enriched for form a transcriptional cascade regulating neuronal growth,
variants contributing to cognitive function and the pathogen- migration, differentiation and network formation (Fig. 8a).
esis of neuropsychiatric disorders. However, these programs Computational analyses of gene/mRNA regulatory interactions
were identified from bulk RNAseq data in vitro and it remains implicate known neurodevelopmental disorder risk genes (CHD8,
to be shown that their constituent genes are actively co- TCF4, FMRP, BCL11B and TBR1) as regulators of this cascade
expressed in the appropriate cell-types during cortical excita- and reveal pathways through which they may contribute to dis-
tory neurogenesis in vivo. To address this, we extracted gene ease (Fig. 4d). Supporting this model, down-regulation of neu-
expression data for cell-types spanning cortical excitatory rogenic programs in DLG2−/− lines is accompanied by deficits
neurodevelopment from a single-cell RNAseq study of human that match their predicted function: impaired migration; simpli-
fetal brain32. After normalizing the expression for each gene fied neuronal morphology; immature action potential generation;
across all cells, we calculated the average expression for each and delayed expression of cell-type identity (reduced expression
gene in each cell-type/stage of development available: early of CTIP2 protein (Fig. 2e, h, i) and TBR1 mRNA (Supplementary
radial glia (early RG), RG, intermediate progenitor cells (IPCs), Data 3)). Interestingly, voltage-gated sodium and L-type calcium
transitioning cells (intermediate between progenitors and channels present in early neurogenic programs are not only
neurons), newborn and developing neurons (Methods). We involved in the generation and control of action potentials56, but
then plotted the expression of each program (mean and stan- are also known to impact neuronal growth and migration57,58.
dard error of gene-level averages) in each cell-type/stage and Further experimental work is required to more precisely delineate
tested for differences in expression between successive types/ phenotypes associated with the disruption of individual programs
stages (Fig. 7d, Supplementary Data 10). The expression profile and the risk genes they harbor, and to map out regulatory
seen for each program in vitro was recapitulated across neu- interactions shaping their expression and activity, testing pre-
rodevelopmental cell-types from human fetal cortex (Fig. 7d). dictions (Fig. 8a). Here we focus on phenotypes expressed by
Notably, while other programs in the cascade were significantly individual newborn excitatory neurons; in future studies it will be
upregulated during the transition from progenitors to neurons, important to investigate the persistence of these phenotypes and
early-transient−/− expression was found to be low in early RG, explore longer-term effects on neuronal circuit formation and
rising in more mature neural progenitor cells (NPCs) then function.
declining in neurons. This is consistent with its predicted role A clear pattern of enrichment was evident across early neuro-
in shaping neuronal sub-type identity, which recent evidence genic programs (Fig. 6c–f). Rare damaging mutations contributing
indicates is determined by the internal state of NPCs immedi- to more severe disorders were concentrated in initial stages of the
ately prior to their exit from the cell-cycle55. cascade, impacting both progenitors (early-transient−/−, Fig. 7d)
and neurons. Common variant association was restricted to neu-
ronally expressed pathways (early-stable−/−, early-increasing−/−).
Discussion It has been proposed that adult and childhood disorders lie on an
A complex choreography of cell proliferation, specification, etiological and neurodevelopmental continuum, the more severe the
growth, migration and network formation underlies brain disorder the greater the contribution from rare, damaging muta-
development. To date, limited progress has been made pin- tions and the earlier their developmental impact59–61 (Fig. 8b). Our
pointing aspects of this process disrupted in neuropsychiatric data support this model and ground it in developmental neuro-
disorders. Here we uncover distinct gene expression programs biology, embedding genetic risk for multiple disorders in a common
expressed during early excitatory corticoneurogenesis in vitro and pathophysiological framework.
in human fetal cortex (Fig. 7d). These programs are enriched for Genetic risk for all disorders was concentrated in LoFi genes,
variants contributing to a wide spectrum of disorders and cog- indicating wider relevance for these genes than previously
nitive function (Fig. 6). The consistency of these enrichments is appreciated and providing insight into their pathophysiological
noteworthy, with multiple associations identified for each early roles. Being under high selective constraint, LoFi genes pro-
neurogenic program. These programs harbor well-supported risk foundly impact development through to sexual maturity. It has
genes for complex and Mendelian disorders, some of which are not been clear whether LoFi genes harboring pathogenic muta-
highlighted in Fig. 8a. This convergence of genetic evidence tions are distributed across diverse pathways shaping pre-/post-
suggests that these programs play an etiological role in a wide natal growth or are concentrated in specific pathways and/or
range of psychiatric disorders. stages of development. Our analyses reveal that not all neuro-
Each program has a unique gene expression profile and developmental pathways are enriched for LoFi genes (Fig. 6a),
molecular composition, indicating a distinct functional role and that the subset of LoFi genes (~40%) concentrated in early
NATURE COMMUNICATIONS | (2022)13:27 | https://doi.org/10.1038/s41467-021-27601-0 | www.nature.com/naturecommunications 11You can also read