TRAFFIC SIGNAL PERFORMANCE MEASURES - TSM&O Workshop Support March2017 In fulfillment of - NET
←
→
Page content transcription
If your browser does not render page correctly, please read the page content below
TRAFFIC SIGNAL PERFORMANCE

MEASURES
FINAL REPORT

                                         In fulfillment of

                             TSM&O Workshop Support

                                           March2017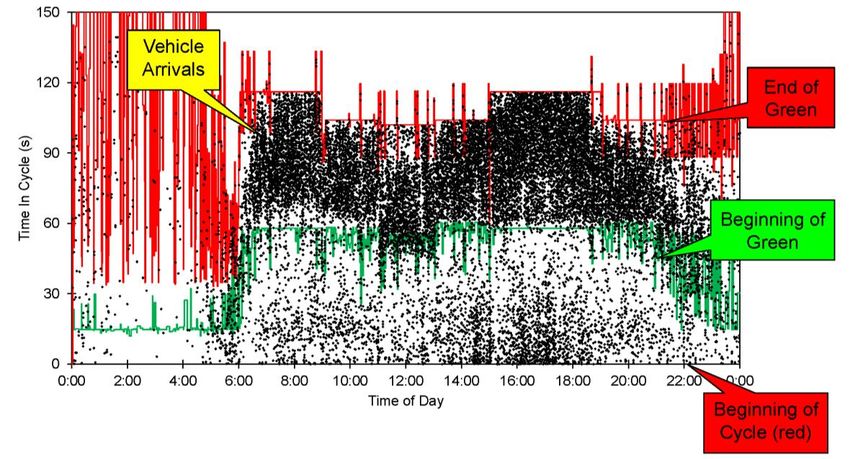
Traffic Signal Performance Measures – Final Report

Table of Contents
Executive Summary....................................................................................................................................... 1
1.0 Introduction to Traffic Signal Performance Measures ........................................................................... 3
2.0 Overview of Traffic Signal Performance Measures ................................................................................ 4
   Purdue Phase Termination ....................................................................................................................... 6
   Purdue Coordination Diagram .................................................................................................................. 7
   Approach Volume Visualization ................................................................................................................ 8
   Volume-to-Capacity Ratio Charts.............................................................................................................. 9
   Approach Speed ...................................................................................................................................... 10
   SPM Dashboard....................................................................................................................................... 11
3.0 System Requirements .......................................................................................................................... 12
   Detection Devices ................................................................................................................................... 12
   High-Resolution Controller ..................................................................................................................... 12
   Communications ..................................................................................................................................... 12
   Data Storage............................................................................................................................................ 13
4.0 Benefits ................................................................................................................................................ 14
5.0 Challenges to TSPM Implementation................................................................................................... 16
6.0 Recent Developments with TSPM Implementation & Application ...................................................... 17
7.0 Decision Framework for Agencies Considering TSPMs ........................................................................ 18
Appendix ..................................................................................................................................................... 19
   List of Performance Measures ................................................................................................................ 19
   Literature Review .................................................................................................................................... 20
   Peer Review: Interview Notes ................................................................................................................. 21
       Departments of Transportation Interviewees .................................................................................... 21
       City / County Jurisdiction Interviewees .............................................................................................. 28
       University / Academic ......................................................................................................................... 31
   Interview Guides ..................................................................................................................................... 34
       Non-Florida Agencies .......................................................................................................................... 34
       Florida-based Agencies ....................................................................................................................... 34
       Universities ......................................................................................................................................... 35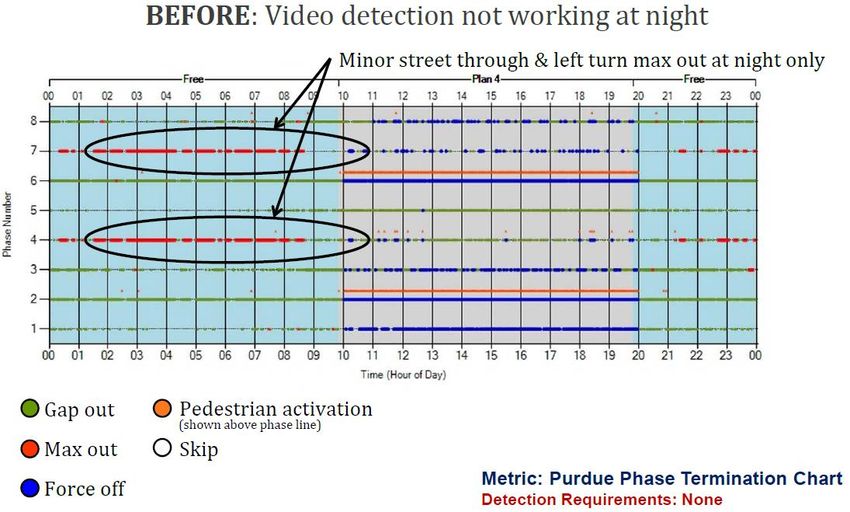
Traffic Signal Performance Measures – Final Report

Table of Figures
Figure 1: Example of Performance Measure Pyramid (2). ............................................................................ 4
Figure 2: Example of Phase Termination Chart (3) ....................................................................................... 6
Figure 3: Example of Purdue Coordination Diagram (4) ............................................................................... 7
Figure 4: Volume Plots (5) ............................................................................................................................. 8
Figure 5: Example of Volume-to-Capacity Ratio chart. (6) ........................................................................... 9
Figure 6: Approach Speeds. (2) ................................................................................................................... 10
Figure 7: Utah DOT Signal Performance Metrics online “Dashboard.”
          http://udottraffic.utah.gov/ATSPM/. .......................................................................................... 11
Figure 8: Decision Chart for TSPM Consideration by Local Agencies ......................................................... 18
Figure 9: TSPM Implementation Process Chart .......................................................................................... 18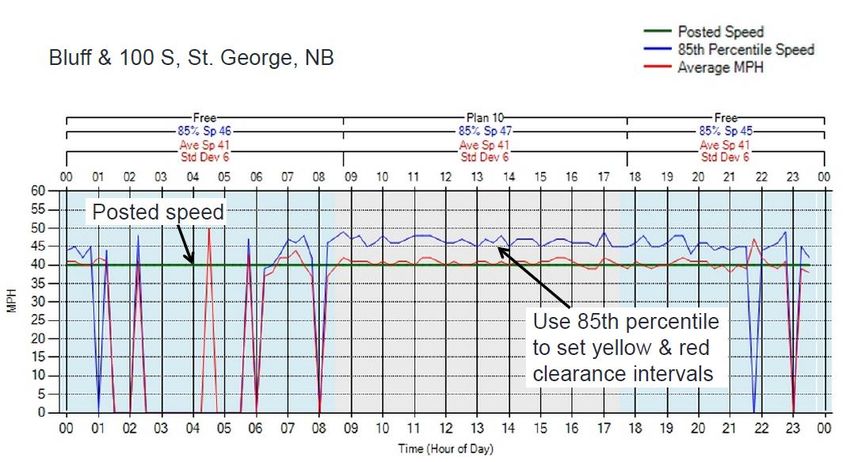
Traffic Signal Performance Measures – Final Report
Executive Summary
This report provides an overview of Traffic Signal Performance Measures (TSPMs), highlighting the
potential benefits and challenges that they pose for local traffic control agencies. The authors conducted
a literature and peer review of the applications of TSPMs from jurisdictions across the United States in
an effort to characterize not just the potential of TSPMs, but the experience that agencies have had with
them to date. As part of this effort, the authors consulted academic literature related to the
development and implementation of TSPMs, and documentation developed by agencies that have
implemented TSPMs. Additionally, interviews were conducted with a number of jurisdictions and
academics involved with TSPMs, including:
Charlie Wetzel, Seminole County Public Works, Florida
Vik Bhide, City of Tampa, Florida
Chris Day, Purdue University
Mark Taylor and Jamie Mackey, Utah Department of Transportation
Jim Sturdevant, Indiana Department of Transportation
Aleksandar Stevanovic, Florida Atlantic University
Alan Davis, Georgia Department of Transportation
Steve Misgen, Minnesota Department of Transportation
Shital Patel, Regional Transportation Commission of Southern Nevada
Results from the peer and literature reviews indicate that TSPMs are primed to take on a greater role in
signal maintenance and performance as they are deployed more widely among agencies, and as TSPM
software and documentation improves. On the whole, agencies see benefits from the implementation of
TSPMs in the form of reduced cost and streamlined signal maintenance operations, as well as a public
benefit from a reduction in signal-related travel delays, decreases in travel times, and public safety
improvements.
From an implementation standpoint, a centralized signal management system is not a requirement for a
jurisdiction to implement TSPMs and experience its benefits. However, response to certain TSPMs in
making signal timing adjustments in real-time is facilitated by a central system connection.
Implementation costs vary, but depending on an agency’s existing Intelligent Transportation System
(ITS) infrastructure and data storage capacity, implementation costs can be relatively low, especially
when compared to the costs associated with the deployment of an adaptive signal system. Of greater
concern to prospective jurisdictions is having the in-house technical expertise to carry out TSPM
implementation, in addition to the engineering expertise to fully take advantage of the measures.
The following are the key findings that are discussed in more detail in this document:
Benefits from TSPMs include:
o System intelligence and remote signal monitoring
o Travel time savings and reduction in delays
o Public safety
o Maintenance cost efficiencies
o Additional verification of signal performance
o Public information
1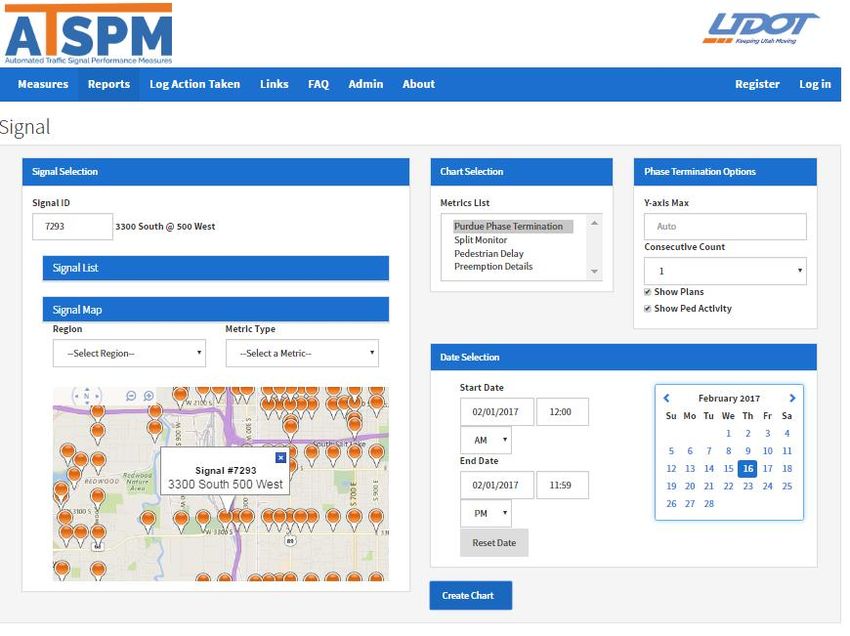
Traffic Signal Performance Measures – Final Report
o Low-cost implementation
Challenges include:
o IT staff support and system documentation
o Cultivating an understanding and appreciation of TSPM benefits among on-the-
ground engineers and technicians
o Allocating sufficient staff time for TSPM implementation, monitoring, and making
periodic improvements
o Data storage
An update to the Utah Department of Transportation (UDOT) TSPM source code is freely
available, allowing small agencies to implement TSPMs more easily.
The number of signal performance measures are increasing, creating additional value to
small agencies (reports, etc.)
TSPMs present an opportunity for traffic signal data to become aggregated with additional
transit and transportation metrics to create powerful and effective transportation system
improvement tools.
2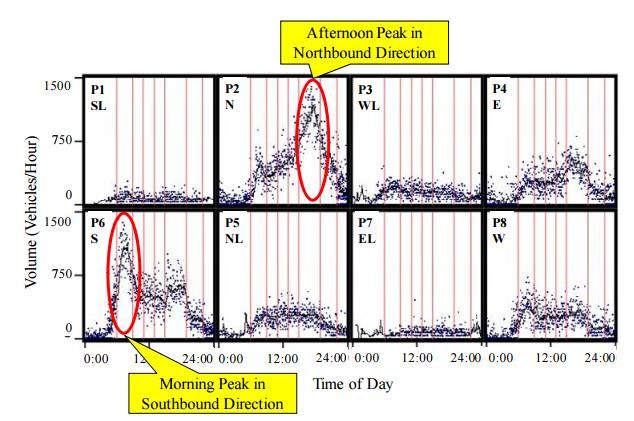
Traffic Signal Performance Measures – Final Report

1.0 Introduction to Traffic Signal Performance Measures

The development of Traffic Signal Performance
Measures (TSPMs) emerged out of a                           What are Traffic Signal Performance
recognized need for better urban traffic                                Measures?
control system performance. Presently, most
traffic control jurisdictions in the United States        “Automated signal performance
implement traffic signal timing plans based on            metrics show real-time and historical
observed traffic counts and travel time and               functionality at signalized
delay surveys during typical conditions (10).             intersections. This allows traffic
The usefulness of a one-time traffic count or             engineers to measure what they
survey diminish over time as conditions                   previously could only model. Accurate
change, and in most cases do not consider                 decision-making about signal
periodic variations in demand. Typically, years
                                                          performance and timing helps signal
go by before signals are re-timed, as signal
                                                          management personnel identify
timing maintenance is labor intensive and
                                                          vehicle and pedestrian detector
driven primarily by driver complaints.
                                                          malfunctions. This cost effective
Even as more and more jurisdictions equip                 solution also measures vehicle delay
signals with communications capabilities and              and the volume, speeds and travel
centralized software systems that make signal             time of vehicles. Your agency can use
timing operations more systematic, metrics for            these metrics to identify operational
evaluating the performance of individual                  deficiencies, optimizing mobility and
signals or a network of signals has lagged.               helping manage traffic signal timing
                                                          and maintenance. Evaluating your
The TSPMs reviewed in this report are
                                                          traffic signals helps you reduce
predominantly those that were developed out
                                                          congestion, save fuel costs and
of a partnership by Purdue University and
                                                          improve safety.”
Indiana DOT beginning as early as 2002 as part
of an effort to evaluate the effectiveness of
                                                            -AASHTO Innovation Initiative (1)
various vehicle detection devices. Since the
initial TSPMs were released at that time,
system developers have added additional performance measures and updated the software source code
to make it easier and quicker for agencies to install and implement. Most agencies that have deployed
TSPMs are now using a software system developed by UDOT and made available for free to any agency.
As this review is being conducted, UDOT is poised to release an updated version of their TSPM software,
along with documentation to help agencies install and operate it.

The following sections will highlight the benefits obtained through TSPMs, what the system
requirements and costs are, as well as the experiences of jurisdictions throughout the country.

                                                                                                         3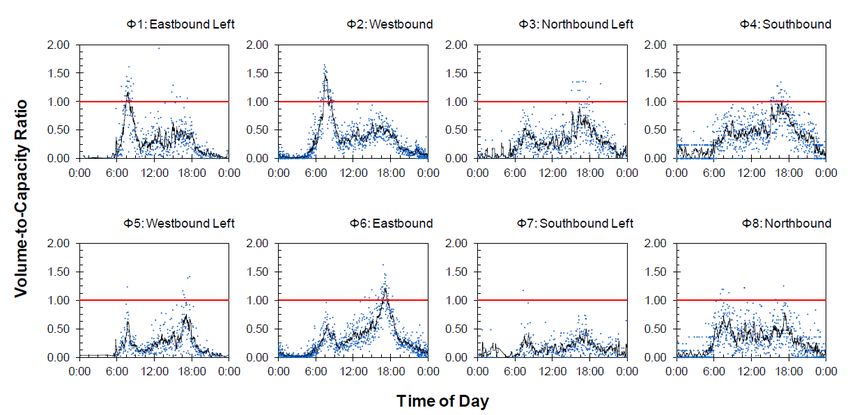
Traffic Signal Performance Measures – Final Report

2.0 Overview of Traffic Signal Performance Measures

There are more than a dozen traffic signal performance measures in use by various agencies. Some of
these measures are standard ones developed by Purdue researchers or part of UDOT’s widely-available
TSPM software package. Other measures have been custom-tailored by agencies for specific purposes
and may become more widely available. This section will discuss some of the key measures in detail,
along with relevant illustrations.

                                  Performance Measure Pyramid

                                               The “Performance Measure Pyramid,” shown here,
                                               illustrates the hierarchy of considerations that local
                                               agencies must make to efficiently manage their traffic
                                               signal networks. In interpreting the pyramid, agencies
                                               can ask themselves the following questions, which
                                               correspond to each step. Implementing TSPMs can help
                                               an agency advance to higher steps along the pyramid.

                                                   1. Communications: Is communication working?
                                                   2. Detection: Are detectors working?
                                                   3. Timing: Is there adequate green time on each
                                                      phase?
                                                   4. Coordination: Are most vehicles arriving on
                                                      green?

                        Figure 1: Example of Performance Measure Pyramid (2).

The detection devices that operate at a given intersection dictate the number of performance measures
that can be obtained from that location. Table 1 lists key traffic signal performance measures, organized
by the relevant detection devices required to obtain them.

                                                                                                         4
Traffic Signal Performance Measures – Final Report
Table 1: Common Performance Measures and Detection Needs
Detection Type Required Common Performance Measure
High-resolution controller only (No Purdue Phase Termination
Additional Detection Needed) Split Monitor
Pedestrian Actuation / Delay
Preempt Duration
Advanced Count Detection (400 feet Purdue Coordination Diagram
behind stop bar) Approach Volume
Volume-to-Capacity Ratio
Purdue Link Pivot
Platoon Ratio
Arrivals on Red
Approach Delay
Executive Summary Reports
Advanced Detection with Speed Approach Speed
Lane-by-lane Count Detection Turning Movement Counts
Red / Yellow Actuation
Lane-by-lane Presence Detection Split Failure (future)
Probe Travel Time Data Purdue Travel Time Diagram
The following are key traffic signal performance measures used most commonly by the agencies
interviewed for this report.
5Traffic Signal Performance Measures – Final Report
Purdue Phase Termination
Additional Detection None
Requirements
Purpose Displays the reason for phase termination in a
conventional controller.
Benefits Generally useful for visualizing which of the possible
reasons for phase termination occurred at a given
time. The chart has most often aided agencies in
investigating public complaints of long wait times
during overnight hours, as shown in Figure 2, below.
Figure 2: Example of Phase Termination Chart (3)
6Traffic Signal Performance Measures – Final Report
Purdue Coordination Diagram
Additional Detection Advanced Count Detection
Requirements
Purpose Shows the volume of vehicles that arrive at various
traffic signal phases over the course of a specific time
period (usually one day).
Benefits The Purdue Coordination Diagram is considered to be
one of the most instructive of the TSPMs. The chart
allows the one to quickly indicate if the majority of
vehicles during a particular time period are arriving at
a signal during the green or red phases and can re-
time the signal if necessary.
Figure 3: Example of Purdue Coordination Diagram (4)
7Traffic Signal Performance Measures – Final Report
Approach Volume Visualization
Additional Detection Advanced Count Detection
Requirements
Purpose Graphically illustrates vehicle count figures over the
course of a given period of time, on a directional or
lane-by-lane basis, depending on the detector devices
in place.
Benefits In addition to evaluating potential capacity
constraints at particular intersections, this measure
has proved useful to local planning and economic
development officials interested in vehicle
movements that might be related to special events or
changes in land use.
Figure 4: Volume Plots (5)
8Traffic Signal Performance Measures – Final Report
Volume-to-Capacity Ratio Charts
Additional Detection Advanced Count Detection
Requirements
Purpose Displays the ratio of vehicle volumes to lane or
directional capacity at a given intersection.
Benefits Allows traffic managers to quickly understand where
traffic volumes are approaching or exceeding the
calculated roadway capacity.
Figure 5: Example of Volume-to-Capacity Ratio chart. (6)
9Traffic Signal Performance Measures – Final Report
Approach Speed
Additional Detection Advanced Detection with Speed
Requirements
Purpose Shows the speed at which the average vehicle, or
vehicles at the 85th percentile are traveling as they
pass through a given intersection.
Benefits The chart produced by this metric can identify
signalized intersections that pose a safety risk due to
having a high proportion of drivers arriving at high
speeds. The tool can help engineers identify locations
at which a longer all-red time may be appropriate.
Figure 6: Approach Speeds. (2)
10Traffic Signal Performance Measures – Final Report
SPM Dashboard
Developed by the team at UDOT, the TSPM “Dashboard” provides an accessible way for members of the public and other users to access
performance measures at specific signals and during specific days / times. Users can choose from the available measures so as to customize the
data and information made available to them.
Figure 7: Utah DOT Signal Performance Metrics online “Dashboard.” http://udottraffic.utah.gov/ATSPM/.
11Traffic Signal Performance Measures – Final Report
3.0 System Requirements
In contrast to other large-scale traffic systems implementations, TSPMs do not require advanced
equipment and detection devices beyond what most traffic control agencies already have in place.
Additionally, an advantage of TSPMs is that the technology was developed to be vendor-neutral, so no
specific controller, detection device, or communications equipment is required. Instead, there are four
key system requirements needed to transmit, process, and store controller/detector-generated data in a
manner that can support TSPM analysis.
Detection Devices
As indicated in the previous section, detection devices vary widely by agency and by the given signalized
intersection being monitored. An agency with advanced and specialized detection devices (such as
setback count detectors, speed detectors, turning movement counters, etc.) is able to obtain a greater
number of TSPMs, however some agencies report that the most valuable TSPMs can be achieved
without special detection devices (Purdue Phase Termination and Split Monitor) (3).
High-Resolution Controller
High-resolution traffic signal controllers, capable of recording events at the 0.1 second interval are
required for robust TSPMs. Because of the efforts of Purdue University researchers in convening groups
of controller manufacturers to collaborate on data specifications, TSPMs can be achieved with nearly
any high-resolution controller that an agency might have, including models from Econolite, Peek,
Siemens, Intelight, Trafficware, and McCain.
Communications
Although some type of communications infrastructure is generally required to implement real-time
TSPMs and achieve all of the benefits, the requirements are flexible and some agencies have, in fact,
implemented TSPMs without a communication platform in place. The following are the three
communications options that agencies have deployed to implement TSPMs:
Fiber connection: The most reliable yet more expensive way to transmit controller data back to
a central server is through a fiber connection. Fiber is common in many signal systems in urban
areas.
Cellular modem: If fiber connection is not available, traffic signals in the field can relay signal
performance data to a central location via cellular modems. Agencies have reported that cellular
modems represent a cost-effective way to deploy the communications infrastructure needed to
realize TSPMs.
SneakerNet: Even without communications capabilities at signals, some jurisdictions are
nonetheless forging ahead with TSPMs. Through this configuration, data from the signal
controller is stored on an SD memory card in the cabinet and retrieved periodically to upload to
a central server, or otherwise reviewed only in the case of signal complaints.
12Traffic Signal Performance Measures – Final Report
Data Storage
Data storage capability on a central server is another system requirement that agencies must have to
implement TSPMs. Large agencies typically have server capability at TMCs or other locations, but for
some smaller agencies, data storage can be a challenge. Even agencies with existing servers that can be
utilized for TSPMs have reported that providing enough storage to accommodate TSPM data from
signals in the field can be difficult, especially as more and more signals become equipped with TSPM
capability.
13Traffic Signal Performance Measures – Final Report
4.0 Benefits
The various measures that agencies have been able to extract from the deployment of TSPMs have
achieved a number of significant benefits. Although some agencies have been able to quantify the
benefits in the form of signal maintenance cost savings or travel time savings to the public, most
agencies describe the benefits as more generally the ability to obtain data that is invaluable for traffic
engineers to be able to accomplish their goal of providing efficient and effective traffic control systems
to the traveling public. The following are the key benefits that emerged from a review of TSPM literature
and through interviews with a range of jurisdictions that have deployed TSPMs.
System intelligence and remote signal monitoring: In various ways, interviewees who have
experience with TSPM implementation describe its principal benefit as the ability to gather data
and develop intelligence without the need to travel to the field (20). Importantly, signals can be
evaluated and adjusted remotely so that valuable field technician time can be allocated to
intersections where it is most needed for maintenance purposes.
Travel time savings and reduction in delays: Most agencies did not report that travel time
savings was the primary or even a significant benefit of TSPMs, however they acknowledged
that when signals are more reliable and functioning correctly, travel times likely exhibit a
marginal improvement. Other agencies point to reductions in delays as a comparable benefit
that results from well-functioning signals, although the impact on measurable travel times is
hard to determine (17). Nonetheless, Indiana DOT has calculated the travel time savings related
to an arterial re-timing project that was conducted as a result of data from TSPMs and found an
annual savings of $2.7million for only a single, nine-mile corridor (6).
Public Safety: Not all agencies with TSPM experience reported verifiable public safety
improvements, however anecdotal evidence from some agencies of TSPM data being deployed
for various signal improvement projects suggests that the safety benefits can be significant. For
example, the Regional Transportation Commission of Southern Nevada is deploying a new
measure called Red Light Running which reports on how many vehicles are running red lights at
specific signals. The report can be used to calibrate the all-red time at the intersection or to
inform law enforcement on which intersections exhibit dangerous light-running patterns (18).
Another TSPM that has valuable safety implications is the Speed During Green, which measures
approach speeds. UDOT officials have used this measure to identify intersections at which the
85th percentile speeds do not match the posted speed limits, and have thus adjusted the yellow
interval time accordingly (16).
Maintenance cost efficiencies: Related to the benefit of remote signal monitoring, many
agencies reported maintenance cost savings as a result of the deployment of TSPMs, due to the
fact that signal re-timings are now performed only on travel corridors that need the most
improvements, rather than by cycling through each and every intersection. Additionally,
monitoring signal and detector performance through TSPMs streamlines an agency’s ability to
identify and repair faulty equipment. UDOT has estimated a cumulative cost-savings to the state
of $1.5million as a result of this benefit (4).
14Traffic Signal Performance Measures – Final Report
Additional verification of signal performance: Agencies have reported that TSPMs have allowed
them to validate the work of their consultant partners who are sometimes tasked with signal
maintenance and re-timing tasks (13). Similarly, jurisdictions with more advanced, adaptive
traffic signals are able to use TSPMs to evaluate their performance.
Public information: Agencies who have struggled in the past to communicate to the public
around traffic signal performance have benefited from the ability of TSPMs to provide them
with verifiable data on how the traffic system is performing. As an example, a jurisdiction in
Indiana installed a “No Turn on Red” sign at an intersection in response to an increase in crashes
at the location. This change led to a number of complaints from drivers to local officials, claiming
unreasonable wait times at the red light. With TSPM data, the jurisdiction was able to
demonstrate to city officials, and communicate to the public at large, that average wait times
were less than 10 seconds.
Low-cost implementation: Unique among traffic signal technology deployments is the fact that
TSPMs cost relatively little to deploy. Especially when compared to adaptive traffic signal
systems, TSPMs can offer equivalent benefits for lower capital and operating costs.
15Traffic Signal Performance Measures – Final Report
5.0 Challenges to TSPM Implementation
Some of the challenges related to TSPM implementation have been alluded to in previous sections of
this report. The following items emerged as the most pressing challenges related to TSPM
implementation by signal control agencies and others.
Technical support and documentation: Small to medium-size agencies have reported difficulty
obtaining the technical capacity to deploy TSPMs to new signals. Although most TSPM software
has been made available to agencies for free, some still struggle to install and troubleshoot
issues related to detector-controller-server communication. Documentation related to the
installation and configuration of the latest version of UDOT TSPM software has only recently
been released, raising expectations that TSPM implementation should be an easier exercise for
local agencies. Nevertheless, few agencies have had experience installing the new software to-
date.
An additional challenge related to technical support can come from agencies’ own internal IT
policies and procedures. Agencies report wide variations in the level of cooperation and support
that they receive from their IT colleagues, who are often asked to authorize signal software such
as TSPMs to be able to operate on agency networks. Some agencies with TSPMs do not have
publicly-available internet dashboards due to IT security concerns (13).
Cultivating an understanding of TSPM benefits from on-the-ground engineers and technicians:
Aside from certain technical challenges to TSPM deployment, many agencies have reported
difficulty in getting traffic engineers to embrace the data-driven value of TSPM, preferring
instead to rely on field visits for traffic monitoring. Despite this, most agencies believe that this
challenge will be overcome with time. An additional challenge related to TSPM “buy-in” from
agencies and staff is related to the role that agencies perceive themselves as playing in traffic
signal maintenance and operations. For example, some agencies that are not as responsible for,
or invested in, efficient traffic signal operations may not welcome or understand the benefits of
TSPMs.
Staff resources for TSPM configuration, review, and improvement: Although TSPM
implementation does not require significant capital or maintenance outlays, agencies
(particularly smaller ones) may struggle to allocate staff resources to TSPM implementation,
monitoring, and improvement. Training on various signal metrics and their applicability to the
local jurisdiction is likewise essential for TSPMs to be deployed successfully. The cost of such
training, in the form of staff time, will vary from agency to agency.
Data storage: As mentioned in previous sections, for some agencies data storage capability or
policies are becoming more of a challenge, particularly as TSPMs are deployed to a growing
number of signals. Large agencies with ample server access struggle less with data storage
constraints, but for smaller agencies that might be obligated by statute to store data for
extended periods of time, this can represent a growing cost over time.
16Traffic Signal Performance Measures – Final Report
6.0 Recent Developments with TSPM Implementation & Application
A number of enhancements to TSPMs have recently been released by UDOT, which are expected to
make the implementation and configuration of TSPMs easier for agencies who wish to experiment with
their application for the first time. Additionally, TSPMs are creating opportunities for agencies to partner
with companies or organizations around innovative traffic management ideas that have the potential to
further improve traffic management in their jurisdiction. The following are several developments that
any agency considering TSPMs will find noteworthy:
UDOT has recently released a new, enhanced version of its TSPM software program which
makes installation and configuration of the system much easier and faster. In addition, UDOT
has added a “Reports” feature with the goal of providing TSPM users the ability to analyze
metrics at the corridor level, rather than signal by signal. Agencies can download the TSPM
source code for free at the following FHWA Open Source Application Development Portal
website: https://www.itsforge.net/index.php/community/explore-applications#/30/129
Detailed documentation on TSPM installation and configuration has been produced by the
Georgia Department of Transportation (GDOT) and made available to agencies for free, with the
goal of easing the process of deploying TSPMs. The documentation is available for download
from the main UDOT TSPM website: http://udottraffic.utah.gov/atspm
Additionally, UDOT hosted a multi-day “Train the Trainer” workshop in Salt Lake City in January
2017 to introduce the enhanced TSPM software and to train local agency personnel on how the
system can be installed and configured. The training sessions were each video recorded and are
available for viewing on UDOT’s TSPM website: http://udottraffic.utah.gov/atspm
As TSPMs continue to be deployed by more and more jurisdictions and to more signals, there
are unique opportunities for innovative agencies to combine and analyze this data along with
other traffic system information to create valuable tools for public officials and the general
public to evaluate the performance of the transportation network as a whole.
As an example of innovative partnerships around traffic performance, the City of Tampa has
recently entered into a partnership with the mobile traffic app, Waze. The app provides the city
with corridor-specific information that the city can verify and then make remote traffic signal
adjustments. In return, the city provides information to Waze about upcoming road closures and
special events so that the app can pass it along with users. FDOT has likewise entered into a
partnership with Waze for incident management support.
Currently, there are two jurisdictions in the State of Florida (Seminole County and the City of
Tampa) that have begun to experiment with TSPM implementation. With the release of the new
UDOT TSPM software, more agencies in the state are expected to implement TSPMs and
experiment with the benefits that they have to offer.
17Traffic Signal Performance Measures – Final Report
7.0 Decision Framework for Agencies Considering TSPMs
To assist agencies in taking the steps to assess their current traffic signal system performance, and
making a determination as far as whether TSPMs are an appropriate tool to deploy, the following
diagram describes the processes and decision points that agencies should follow.
•Does the agency struggle to identify and
1) Assess the prioritize signal re-timing needs?
strengths and •Could the agency benefit from additional
challenges of your ways to inform the public of signal system
issues?
current traffic signal
•Have traffic signal issues led to safety
system concerns at particular intersections?
•What is the agencies communications, Decision
2) Assess current detection, controller, and central system
signal system capabilities?
to Proceed
capabilities •Are any system upgrades under way or with
planned?
TSPMs
3) Assess the •What are the current IT staff and server
requirements and capabilities?
•Do traffic engineering staff have capacity
expected costs of for and interest in TSPMs?
TSPM deployment
Figure 8: Decision Chart for TSPM Consideration by Local Agencies
The following implementation steps should be considered by agencies that wish to deploy TSPMs.
Figure 9: TSPM Implementation Process Chart
18Traffic Signal Performance Measures – Final Report
Appendix
List of Performance Measures
Performance Measure Description
Background Cycle Length Programmed cycle length as measured from time between successive yield
points.
Effective Cycle Length Actual time that it takes to serve all phases in a cycle.
Green Time Actual green time displayed on a phase or overlap.
Capacity Green time scaled by saturation flow rate to derive the provided capacity
g/C Ratio Ratio of green time to effective cycle length.
Vehicle Count Number of vehicles detected on a phase or overlap during a cycle.
Equivalent Hourly Volume Vehicle count scaled to vehicles per hour.
Volume-to-Capacity Ratio Equivalent hourly volume as a proportion of the provided capacity.
Phase Termination Reason for phase termination in each cycle.
Phase Termination Diagram Graphical plot of repeated phase force-offs.
Green Occupancy Ratio Proportion of green time that the detector is occupied.
Red Occupancy Ratio of the Proportion of the first 5 seconds of red that the detector is occupied.
GOR/ROR Diagram Composite plot of GOR and ROR5 with phase termination.
Degree of Intersection Overall utilization of capacity provided by each phase in the critical path of the
Saturation intersection.
Percent on Green Proportion of vehicle arrivals taking place while the intersection is green.
Arrival Type A version of the percent on green that is divided by the green-to-cycle ratio and
fitted to a qualitative 1–6 scale.
Input-Output Delay An estimate of delay on an approach based on relationship between arrival profile
and assumed departure profile.
Purdue Coordination A visualization of individual detector events relative to the status of the
Diagram downstream phase or overlap.
Flow Profile Cyclic distributions of the probability of green and proportion of vehicle arrivals
taking place during a cycle.
Estimated Queue Length Estimated length of queue based on analysis of shockwaves and detector
occupancy.
Pedestrian Cycle Indication of whether a cycle included a pedestrian phase.
Pedestrian Actuation to Time between onset of a call for pedestrian service and beginning of pedestrian
Service Time service.
Pedestrian Conflicting Volume on a movement that conflicts with a pedestrian phase.
Volume
Preemption Event Diagram Visualization of event durations relevant to preemption entry.
Preempt Duration Duration of preemption events.
Priority Time to Green Time between onset of a call for transit priority and beginning of desired phase or
overlap green.
Detector Failure Histogram describing frequency of reported detector failures.
*This list is from the 2014 Purdue monograph, Performance Measures for Traffic Signal Systems: An
Outcome-Oriented Approach. Additional measures may be available with the latest release of the UDOT
software.
19Traffic Signal Performance Measures – Final Report
Literature Review
1. AASHTO Innovation Initiative (2017). Automated Traffic Signal Performance Measures. Retrieved
from http://aii.transportation.org/Pages/AutomatedTrafficSignalPerformanceMeasures.aspx
2. Taylor, M. Overview of UDOT SMP System. Automated Traffic Signal Performance Measures
Workshop. 2016. Retrieved from: http://dx.doi.org/10.5703/1288284316022.
3. Institute of Transportation Engineers (2014). Achieve Your Agency's Objectives Using Automated
Traffic Signal Performance Measures - Webinar (Part 3). Retrieved from
http://aii.transportation.org/Pages/AutomatedTrafficSignalPerformanceMeasures.aspx#additio
nal-resources.
4. Institute of Transportation Engineers (2014). Achieve Your Agency's Objectives Using Automated
Traffic Signal Performance Measures - Webinar (Part 2). Retrieved from
http://aii.transportation.org/Pages/AutomatedTrafficSignalPerformanceMeasures.aspx#additio
nal-resources.
5. Grossman, J., & Bullock, D. M. (2013). Performance Measures for Local Agency Traffic Signals.
Purdue University LTAP Center
6. Bullock, D. Traffic Signal Performance Measures Workshop. Automated Traffic Signal
Performance Measures Workshop. 2016. Retrieved from:
http://dx.doi.org/10.5703/1288284316016.
7. Day, C. M., D. M. Bullock, H. Li, S. M. Remias, A. M. Hainen, R. S. Freije, A. L. Stevens, J. R.
Sturdevant, and T. M. Brennan. Performance Measures for Traffic Signal Systems: An Outcome-
Oriented Approach. Purdue University, West Lafayette, Indiana, 2014. Retrieved from:
http://dx.doi.org/10.5703/1288284315333.
8. Day, C. M., D. M. Bullock, H. Li, S. M. Lavrenz, W. B. Smith, and J. R. Sturdevant. Integrating
Traffic Signal Performance Measures into Agency Business Processes. Purdue University, West
Lafayette, Indiana, 2015. Retrieved from: http://dx.doi.org/10.5703/1288284316063.
9. Haseman, R., Day, C. M., & Bullock, D. M. (2010). Using Performance Measures To Improve
Signal System Performance. Purdue University LTAP Center. Retrieved from
http://rebar.ecn.purdue.edu/ltap1/multipleupload/Signals/Signal%20System%20Performance%
20Measure%20Report.pdf
10. Institute of Transportation Engineers (2014). Achieve Your Agency's Objectives Using Automated
Traffic Signal Performance Measures - Webinar (Part 1). Retrieved from
http://aii.transportation.org/Pages/AutomatedTrafficSignalPerformanceMeasures.aspx#additio
nal-resources.
11. Taylor, M. Automated Traffic Signal Performance Measures. ITS California, Technical Session 9 –
Innovative Technology for Local Cities. 2014. Retrieved from:
http://www.itscalifornia.org/Content/AnnualMeetings/2014/Presentations/TechSession9/1_-
_ITSCA2014_TS9_Innovative_Tech_Taylor.pdf
12. Taylor, M. SPM Basics & Applications Overview. Automated Traffic Signal Performance Measures
Workshop. 2016. Retrieved from: http://dx.doi.org/10.5703/1288284316030.
20Traffic Signal Performance Measures – Final Report
Peer Review: Interview Notes
Departments of Transportation Interviewees
13. ALAN DAVIS, GEORGIA DOT – 11/22/16
Current Involvement
We have been running the old version of the Utah DOT’s ATSPM code. It is cumbersome and
broke our servers several times.
o Update: we have upgraded to the newest open source release (4.0) and it is very stable
and user friendly.
Upon learning that a new version of the code is being developed, we volunteered to develop
documentation that can be shared with agencies across the country. The documentation we are
creating will be released on December 15th and will have three sections:
o Section 1: Explanation of how each application works and runs (e.g., “the Purdue
Coordination Diagram accesses these data points and plots them in this manner.”)
o Section 2: “How-To” work the website and how to run the watchdog service, etc.
o Section 3: Installation guide to the new software.
Currently, GDOT and the City of Johns Creek have implemented ATSPM. Johns Creek has
approximately 100 signals and GDOT has approximately 2,300 signals statewide—500 in metro
Atlanta, and the remainder in outlying districts.
Our communications infrastructure is mostly cellular 4G, with some fiber signals in Atlanta
(approximately 1,500 signals on fiber).
We have not made the Utah dashboard public yet. It is still behind our firewall, but we intend to
make it public once the new software is installed and vetted.
We plan to expand ATSPMs so that every signal that GDOT maintains (about 3,000) will be able
to collect high resolution data. There could be 10K signals running ATSPM in Georgia in the next
few years.
Benefits
As we have integrating ATSPMs into our processes, it has been useful as a validation of
consultant work. We have typically been at the mercy of re-timing contracts with consultants for
which travel time runs were the predominant metric. As you know, this is not best metric. Now,
we can examine the data and make tweaks remotely.
We are also able to target where we put our resources so that we don’t do a full re-timing study
on a corridor that does not display signs of a problem.
ATSPMs allow us to see which detection devices are not working well. We have found that video
detection is the least effective.
Challenges
Initially, integrating with the Centracs system was a problem. The systems did not want to
communicate with one another, but we resolved this.
21Traffic Signal Performance Measures – Final Report
Data storage may become a problem going forward. We have so far stored 800 GB of data but
will continue to receive more and more.
Getting our technical community to sign on to ATSPMs can be an issue. We have some “old-
school” engineers who don’t see the value in data and prefer to conduct field observations.
Costs
I don’t think we’ve spent more than $100K on backend upgrades related to TSPMs (aside from
the separate cost of upgrading controllers, which was a $20M project).
Future Developments
We are excited to have all of this data, but we still don’t have a good sense of what do we do
with it? The real benefit that will come from having the data is to be able to develop analytics.
We want to be able to aggregate all of this data (e.g. Bluetooth travel time data) so that we can
make advancements in how we improve operations going forward. We have been collecting
freeway data for 20 years, but really we don’t do much with it. I believe there will be a market
for consultants to develop tools that integrate this data and package it for use by elected
officials and policy-makers.
14. STEVE MISGEN, MINNESOTA DOT – 11/8/16
Background
Misgen currently serves as the district traffic engineer. Involvement with SPMs began around
2006 as a research project with the University of Minnesota—Professor Henry Liu. The initial
project was to determine if queue lengths could be measured/estimated by using the in-place
detectors at a signalized intersection. Over the years, and through numerous research projects,
different measures were developed which were integrated into the “Smart Signal Product.” We
ultimately incorporated a lot of Purdue measures into our system.
o Impression is that the Utah SPM system is a bit more polished.
We have 120 intersections that have Smart Signal now.
Before TSPMs, signal performance was measured by complaints, field observations or by
collecting data and analyzing in Synchro.
Now, MnDOT has performed three retiming projects using only the data and information
collected in Smart Signal, not Synchro. Before and after measures were collected.
We are now working with Audi to see how we might integrate it into vehicles.
22Traffic Signal Performance Measures – Final Report
Benefits
Agency cost savings – Historically, MnDOT’s Metro District has retimed its major arterials every
3-4 years whether they needed it or not, usually they did. It’s our intent to monitor the signals
on a regular basis to determine when and if the signals need to be retimed.
For the public, the benefits will take the form of better travel times and less delay.
There is a need to create universal measures so that politicians and city management can
evaluate the health of signal operations. Historically, delay or travel time was used but only after
data was collected and analyzed. SPMs can provide as close to a real-time measure of how the
system is doing.
System Components
We have a system that pulls the data logger between 2 and 12-hour increments depending on
the intersection. Everything is on fiber or ethernet modem comm.
Initially we used a separate recording device but transitioned to using the Econolite ASC3 data
logger. We had a few problems with the data logger in the ASC3 locking the communications up
but these issues have been resolved.
Challenges
Our own staff has been the biggest challenge. Getting staff to embrace the technology is tough.
Biggest challenge was our own internal IT people—“the NO people”. Their issues included the
servers, storage volume, firewall, field devices, etc.
With the latest release coming from UDOT, the IT department’s fear is related to open source
software. They don’t want anyone else to have credentials.
“Old-timer” traffic engineers are also slow to embrace SPMs. At first glance, the Purdue
coordination diagram is difficult to interpret.
It would be useful to organize a user’s group of those involved with the pooled study to share
challenges and experiences. Most of the presentations available online are basically success
stories.
Costs
For MnDOT, the capital cost would only be the cost of the servers. The majority (420 of 700) of
the signals are on a central system with constant communications, Ethernet over fiber. The
software has been at no cost to the agency—both Smart Signal & Utah’s SPM system. We are
also upgrading to Intelight’s MaxView which will have SPM integrated into the software.
23Traffic Signal Performance Measures – Final Report
15. JIM STURDEVANT, INDIANA DOT – 11/15/16
Background
Our involvement in TSPM grew out of a collaboration with Purdue University in 2002 when we
were gathering data on how well various types of detection systems operate. Now, we are
involved with the Everyday Counts program (NCHRP 3 – 122)
Involvement in TSPM started in 2002 when evaluating how well various vehicle detection
systems performed. In 2007, we worked with Purdue at the time when the Purdue coordination
diagram was still spreadsheet-based.
Indiana has 2,500 signals under the control of INDOT. Of those, 1,500 are on coordinated
systems. The others are is rural areas and not linked up to any central system or capable of
collecting TSPM. We are limited as far as how many signals we can bring online because we
need to use the repair budget—UDOT has connected all signals with fiber optics comms through
a trading program with the telecommunication industry.
Only 300 signals are running TSPMs. Goal is to triple this number in three years, but some
districts don’t have the budget to connect to the signals.
Have not employed focus groups to collect public feedback.
TSPM System Components
Having widespread comms capability is the biggest issue for us. Cellular modems make this
rather cost-effective (this is what GDOT is doing).
Of the signals we have that currently are comms-equiped, the ones in urban areas are
connected via fiber, and in less-populated areas they are running cellular modems.
Some adaptive signals in Indiana, but not at INDOT (e.g. running Synchro Green or Rhythm) also
have built-in performance metrics, however it is still useful to have additional TSPMs because
they can tell you how truly adaptive the signals are. (“You want to have cruise control and a
speedometer in your car”)
NEMA – some states have NEMA controllers in which the hardware and software is bundled
together. The 2070 model is separate.
Benefits of SPMs
We have used TSPMs to investigate signal performance related to fatalities at railroad crossings,
and to confirm that signals were working. Prior to that, we would not have data to indicate how
the individual that ended up on the tracks.
We have also been able to provide valuable info to city officials when they receive feedback
about traffic systems. For example, we installed a “no turn on red” sign at an intersection with
lots of crashes, which led to an influx of complaints from motorists who claimed they were
waiting at the light for minutes on end. In fact, we were able to show that the average wait time
was 7 seconds.
24Traffic Signal Performance Measures – Final Report
Implementation Challenges
IT can be a major issue. Jurisdictions must have an IT tech and a server to run the system on.
Also must have buy-in from IT staff.
Costs
We use repair parts funds to implement SPMs. There are no additional costs as we already have
a database, and already have a database staffer from IT. Cities can justify the comms costs alone
in the reduction of trips to the field to investigate signals.
Future Plans / Developments
We intend to adopt the UDOT system and run it, along with our existing system which we
developed several years ago, side-by-side. We can compare both systems and see if we get the
same answer.
Going forward, there will be many more ways to capture SPMs in the cabinet. There could be
states that aren’t NEMA states, but there is still devices in controller that can get the PMs. There
could be a situation where they have a system that can’t do PMs, but there is tech coming that
will allow them to get it.
Consultant involvement will allow smaller jurisdictions to engage with SPMs.
16. MARK TAYLOR AND JAMIE MACKEY, UTAH DOT – 11/7/16
Over the past six months, we have partnered with FHWA’s “Everyday Counts.” The fourth
iteration will kick-off next year. As part of this program, we have decided to re-write source
code so that it’s easier for jurisdictions across the country to use. We are going to release the
source code on the FHWA web site within the next week or so. Our hope is that other agencies
will take the source code, incorporate and improve it, and then share it again with us.
We are trying to get away from being tech support for the entire country. Our hope is that the
private sector will become engaged too and help agencies implement the code and TSPM.
The new code is much simpler and will allow other agencies to install it in half a day or less
(down from 1.5 days currently), as well as to configure it easier and add more metrics.
As far as I know there are 17 different agencies that are using UDOT’s TSPM source code.
Some agencies are have tweaked the code, such as Las Vegas, who have added a few additional
measures. Indiana has their own software currently but are going to begin using ours.
Minnesota also has another package.
The National Operations Center of Excellence hosts an online forum for discussing TSPM topics
and issues. Available here: http://forum.transportationops.org/forum/5-traffic-signals/
An online resource specifically for issues related to the installation and configuration of the
UDOT source code is available through a portal on the FHWA’s Open Source Application
Development Portal: https://www.itsforge.net/forum/ATSPM
25Traffic Signal Performance Measures – Final Report
How did your involvement with TSPM begin? How was signal performance being measured before vs.
after?
In 2011, our senior leaders looked at traffic signals as assets to the state. They asked how do you know if
things are getting better or worse, etc.? We put together a quality improvement team and wanted to
have real time measurements of metrics. We teamed up with Purdue and because we already had the
right type of data recorder, we were able to get 100 signals up and running in about a month.
UDOT owns about 1,200 signals. 85% are connected via communication and TSPMs. We own 60% of the
signals in Utah and the cities and counties have 40% of signals. 85% of all traffic signals statewide have
TSPMs. Goal within a couple of years is to be 100%.
What are the most significant benefits from TSPM to your agency?
There are many but the most valuable is the troubleshooting. Ability to identify immediately what the
problem is. We can dispatch the right technician and make sure they are looking at the right problem.
We have an alert system that tells us what the problem is as soon as it happens.
What have cost savings been?
We don’t have any quantitative data on that. Qualitatively we can speak to the reduced number of calls
that we get. A few years back, we estimated the benefits at $3million of user benefit in the form of
reduced delay time.
However, we are moving away from travel time as sometime that will improve… We want to keep travel
time from degrading. The travel time savings are not huge, but arrivals on green have been a significant
improvement.
What is the most common metric to trigger an alert?
Percent max-out between 1 and 5am… It’s hard to tell in the PM peak if you have a detection problem,
but in the early AM hours if the signals are not working you will know.
Public Benefits?
2 years after implementation we did a focus group on TSPM. They were asked if signals were getting
better / worse, etc. After focus group in 2014, we were shocked with result. It showed that people
thought it was getting better. Big shock! Never good when you ask about traffic signals.
26Traffic Signal Performance Measures – Final Report
Safety benefits?
Yellow / Red Actuation metric: This metric looks at vehicles traveling more than 15mph (?)
during yellow and red intervals. The idea is that you can start to see when you’re having a red
light running problem. We have not followed through with this one yet. Idea is that if we see
that red light running is only an issue for 30 mins per day, we can fix it by allowing for more
green time, or maybe we work with local law enforcement, e.g.
o We have not had the opportunity to follow through with issues that have been revealed
via this metric, but we would like to at some point.
Speed during green metric: Looks at approach speeds on green. We have used this to see when
85 percentile speeds don’t match with posted speed limits and adjusted the yellow time
accordingly.
What have the challenges been with regard to implementation of TSPM?
You have to size the server based on your needs and requirements. Do you want to store data for 1 year
– 5 years? We are running 10 – 15MB per day per signal. Seminole county is running much more data for
some reason.
In Utah, we had the hardware, but not software. We had to upgrade the firmware. For other agencies it
depends. Seminole County had hardware.
In Colorado, they are getting ready to switch out all of the controllers and they are supposed to be
vendor neutral. As soon as they get those controllers they will be ready to go. We have met a lot of
people and heard a lot about barriers, but in the next few years, I expect that there will not be as many.
It’s important to change the standards and requirements that anything new you buy will have data
logger built in.
What does it mean that TSPMs are independent of a central system?
A central system is not needed or used for TSPMs. The way it works is that the traffic signal has a data
logger that runs in the background. We are making a direct connection to the data logger and bringing it
to our server.
We have a central system here but that’s independent of TSPMs. We LOVE our central system. We use it
for event management, etc. and thus we do not advocate getting rid of a central system. But it can be
cost a lot to implement if an agency does not already have one.
27You can also read