Tracing online information about wind power in Sweden: An exploratory quantitative study of broader trends
←
→
Page content transcription
If your browser does not render page correctly, please read the page content below
Tracing online information about
wind power in Sweden: An
exploratory quantitative study of
broader trends

               Mistra Environmental Communication

                             « Fighting windmills »
                                   Project report
                                          2023

Jutta Haider
Björn Ekström
Elisa Tattersall Wallin
David Gunnarsson Lorentzen
Malte Rödl
Nora Söderberg

This work is licensed under a Creative Commons Attribution 4.0 International License.
https://creativecommons.org/licenses/by/4.0/

                                              1
2

Contents
INTRODUCTION ............................................................................................................... 5
DATA PRODUCTION AND ANALYSIS ........................................................................... 7
   GOOGLE SEARCH DATASET .................................................................................................................. 7
   FACEBOOK DATASET .............................................................................................................................. 7
   TWITTER DATASET .................................................................................................................................. 8
RESULTS .............................................................................................................................. 9
   GOOGLE SEARCH QUERIES AND SEARCH RESULTS ............................................................................ 9
     Key takeaways ........................................................................................................................................ 9
     Frequency table – domains ...................................................................................................................... 9
     Top domain frequencies ......................................................................................................................... 10
     Frequency table – URLs ...................................................................................................................... 10
     Top URL frequencies ........................................................................................................................... 11
     Google Trends ...................................................................................................................................... 12
     Search queries, autosuggest queries and related searches ........................................................................... 13
     Search results of Swedish geographic location queries ............................................................................... 14
   FACEBOOK INTERACTIONS WITH NEWS MEDIA CONTENT ............................................................. 15
     Key takeaways ...................................................................................................................................... 15
     Frequency table ..................................................................................................................................... 16
     Top news media article interactions ........................................................................................................ 16
     Top domains featured in the dataset ....................................................................................................... 17
     Time series – monthly posts ................................................................................................................... 17
     Interaction relationships ........................................................................................................................ 18
     News media content – Facebook group relations..................................................................................... 20
   FACEBOOK INTERACTIONS WITH YOUTUBE VIDEOS ...................................................................... 21
     Key takeaways ...................................................................................................................................... 21
     Frequency table ..................................................................................................................................... 22
     Top Youtube video interactions .............................................................................................................. 22
     Time series – monthly posts ................................................................................................................... 22
     Interaction relationships ........................................................................................................................ 23
     Youtube videos – Facebook group relations ............................................................................................ 25
   YOUTUBE AUTOSUGGEST TERMS ........................................................................................................ 25
   TWITTER CONVERSATIONS .................................................................................................................. 26
     Key takeaways ...................................................................................................................................... 26
     Key topics and hashtags in the Twitter data............................................................................................ 27
     Zooming in on three themes in the Twitter data ...................................................................................... 29
     Wind power in discussions on Swedish politics, the #svpol example ........................................................ 31
SUMMARY ........................................................................................................................... 33
   GOOGLE SEARCH.................................................................................................................................. 33
   TWITTER ................................................................................................................................................. 33
   FACEBOOK ............................................................................................................................................. 34
   SUMMING UP .......................................................................................................................................... 34
SVENSK SAMMANFATTNING ........................................................................................ 35
REFERENCES .................................................................................................................... 36

                                                                             3
List of figures and tables

Figure 1. Screenshot, Google Trends, 2021-2022, term: vindkraft, location; Sweden            12
Figure 2. Screenshot, Google Trends, September 2022, term: vindkraft, location; Sweden       12
Figure 3. Screenshot, Google Trends, related queries (top)                                   12
Figure 4. Screenshot, Google Trends, related queries (rising)                                12
Figure 5. Monthly average search terms, autosuggest terms and related Google search queries for
vindkraft                                                                                    14
Figure 6. Top 20 domain frequencies for geographic location queries                          15
Figure 7. Monthly distribution of news media content posted in Facebook groups               17
Figure 8. News media content reactions and shares in Facebook groups (n = 440)               18
Figure 9. News media content comments and shares in Facebook groups (n = 440)                19
Figure 10. News media content reactions and comments in Facebook groups (n = 440)            19
Figure 11. News media content reactions, comments, and shares in Facebook groups (n = 440) 20
Figure 12. News media content relations with Facebook groups                                 21
Figure 13. Monthly distribution of Youtube videos posted in Facebook groups                  22
Figure 14. Youtube video reactions and shares in Facebook groups (n = 33)                    23
Figure 15. Youtube video comments and shares in Facebook groups (n = 33)                     23
Figure 16. Youtube video reactions and comments in Facebook groups (n = 33)                  24
Figure 17. Youtube video reactions, comments, and shares in Facebook groups (n = 33)         24
Figure 18. Youtube video relations with Facebook groups                                      25
Figure 19. Youtube autosuggest terms relating to vindkraft                                   26
Figure 20. Full Twitter data word cloud                                                      27
Figure 21. Topic modelling of the Twitter data                                               28
Figure 22. Co-hashtag analysis of the Twitter data                                           28
Figure 23. Words appearing most frequently in relation to the illness keywords.              30
Figure 24. Most frequent words appearing in relation to microplastics keywords.              30
Figure 25. Most frequent words in relation to bisphenol A                                    31
Figure 26. Co-hashtag analysis of the #svpol data and wind power, January 2022               31
Figure 27. Co-hashtag analysis of the #svpol data and wind power, August 2022                32

Table 1. Coding scheme of depictions of wind power news media content and Youtube videos     8
Table 2. Frequencies of domains in SERPs                                                     9
Table 3. Top ten most frequent domains in SERPs                                             10
Table 4. Top ten most frequent domains in SERPs at position 1                               10
Table 5. Frequencies of URLs in SERPs                                                       10
Table 6. Top ten most frequent URLs in SERPs                                                11
Table 7. Top ten most frequent URLs in SERPs at position 1                                  11
Table 8. Top ten monthly average searched terms, autosuggest terms, related search terms    13
Table 9. Frequency table for grouped queries and SERPs                                      14
Table 10. Frequency table of news media content interactions in Facebook groups             16
Table 11. Top ten most interacted news media content in Facebook groups                     16
Table 12. Top ten most interacted news media content domains in Facebook groups             17
Table 13. Frequency table of Youtube video interactions in Facebook groups                  22
Table 14. Top ten most interacted Youtube video URLs in Facebook groups                     22

                                              4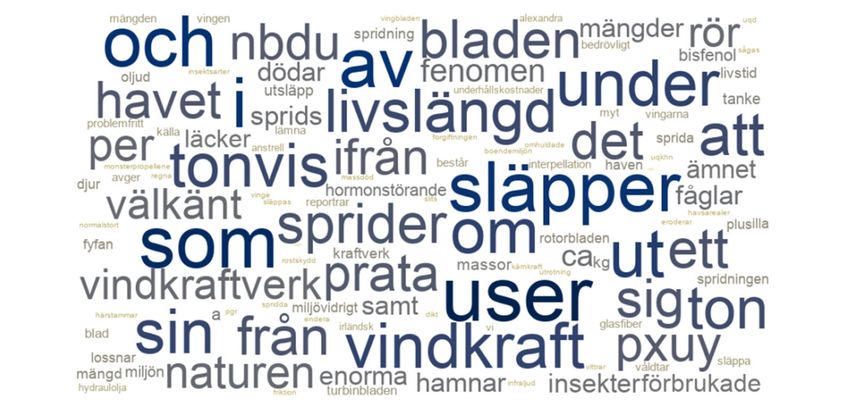
Introduction
This report presents the main findings of an exploratory quantitative study of how information
about wind power circulated online in Sweden between May and November 2022. The focus of
this study is on larger trends, types of claims and dominant relations concerning wind power on
social media, especially Twitter and to a lesser extent YouTube and Facebook, as well as the role of
search engines, specifically Google Search, in these constellations. The study explores the
circulation of both information supported by research and information that is not necessarily
backed up by research-based evidence.
Discussions about wind power are shaped by social norms and influenced by local culture and
history (Karakislak, et al. 2021). They are often antagonistic, politically charged and sometimes
polemical (Borch et al., 2020; Hindmarsh, 2014). In Sweden, public opinion on wind power is
predominantly positive but has become more negative in recent years. The differences in opinion
are consistent with demographic characteristics. For example, women and urban populations
express themselves somewhat more positively and men and rural populations somewhat more
negatively. Furthermore, there is a statistically confirmed alignment of opinion with the political
left-right scale, with opinion on the left more in favour of wind power development and opinion
on the right less so (Jönsson, 2022). Although wind energy is generally considered a sustainable and
renewable energy source (Energimyndigheten, 2021; Wizelius, 2015) and the general opinion is
positive (Jönsson 2021), planned wind farm developments in Sweden are often stopped at the
municipal level (Jönsson, 2022).
It is important to note that several of the points made against wind power can also be made against
other infrastructure developments, such as airports, roads, motorways, railways, or seaports. Many
of these concerns create tensions and call for trade-offs. The reasons for opposition to wind power
are varied and range from feared loss of property value, impact on landscapes, fear of noise and
light pollution, to concerns about harm to wildlife and marine environments, to name just a few
(e.g., Bolin et al. 2021; Bjaerstig et al. 2022). A common concern, which is also the subject of
research, is that wind turbines are harmful to certain species of bats and birds (see: Naturvårdsverket,
n.d. for a list of research and synthesis reports in the Swedish context). At the same time, much ecology and
biology research has found that wind power is the energy source with the least harmful impact on
ecosystems (Anshelm, 2013; Sayed et al. 2021). In Sápmi, criticism relates moreover to the
continued exploitation and industrialisation of Sápmi land for energy production, which has a
negative impact on the landscape and the indigenous Sámi population, for example through the
fragmentation of reindeer herding areas (Eftestøl et al. 2023; Skarin at al. 2021). Similar issues with
public acceptance of wind farms and opposition can be observed in other Scandinavian countries
(e.g., Borch et al., 2020; Heidenreich, 2016), across Europe (e.g., Ruddat, 2022; Sonnenberger &
Ruddat, 2017) or in North America (e.g. Fergen et al. 2021).
Much of the material analysed for this report, but of course not all, presents a critical and sometimes
highly critical view of wind power. It is impossible to provide a comprehensive overview of all the
issues that arise in the present context. As noted above, much of the criticism is well-known and
has already been documented and investigated. Nevertheless, we have chosen to explore the
occurrence of three specific concerns in one of the datasets in this study, namely the notion that
wind turbines are a major source of microplastics, that they are therefore a major source of
bisphenol A in the environment (Bolin et al., 2021), and that they cause various illnesses in people
living near them (Taylor & Klenk, 2019; Karasmanaki, 2020). There is little scientific evidence to
conclusively support either claim. Research that has identified and quantified the main emission
sources of microplastics in the environment in Sweden and other countries shows that the majority
comes from motor traffic (tyres, road markings), artificial turf, laundry, litter and, in the sea, also
from boat hulls and fishing gear (Hann et al. 2019; Swedish Environmental Protection Agency,
2019). Research has not been able to establish a link between living near wind farms and a higher
risk of heart disease, pregnancy problems, stroke, or diabetes, as well as some other health concerns
and diseases. However, there is evidence that prolonged exposure to wind turbine noise can cause
sleep disorders in some people. The most common adverse health effect is annoyance from wind
turbine noise. The experience and level of annoyance also depend on the individual's attitude
towards wind power and increase when wind turbines are visible (Karasmanaki, 2022).
In the literature and public discussion, it is often noted that there are different types of information
and specifically false information: namely misinformation, disinformation, and mal-information.
There is a plethora of different typologies, terms, and concepts to define the phenomenon of false
information and especially its spread online (Kapantai et al. 2021). The most common definitions

                                                     5
are based on the following distinctions: Misinformation is false information that is shared by
mistake, while disinformation is false information that is shared with the intention to mislead. Mal-
information is genuine information that is shared with the intention to mislead. This can include
information that should remain private being shared publicly, or correct information being shared
in a misleading way, for example, content that originally referred to a different time or place (Wardle
& Derakhshan, 2017). These terms are limited in describing the impact that incorrect information
and its dissemination can have on society and individuals. Their usefulness is often limited because
they presuppose knowledge of the intention of a producer or disseminator of information in a
problematic way (Fathaigh et al. 2021). So, although there is good evidence of falsity for some of
the claims that are repeatedly shared about wind power, especially in social media, we are talking
here about larger patterns of information.
The overarching research question of this report is: Which understandings of wind power in
Sweden are prevalent in Google Search and on major social media platforms? The report is
moreover guided by the following questions:
What connections can be identified in Google Search between search terms and search
results, and between search terms, autosuggest terms and related searches?
Which topics are central to Swedish discussions about wind power on Twitter and how
are these topics related to each other?
What role do Facebook groups play in shaping the image of wind power in Sweden
through the dissemination of wind power-related content?
The next section describes the methods and materials that were collected and produced, as well as
how the data were analysed. This is followed by a presentation of the results, focusing on Google
searches and results, Facebook interaction patterns for news media content, Facebook interaction
patterns for YouTube videos and Twitter conversations. A final section summarises the main
findings in relation to the above questions. A summary in Swedish concludes the report.
6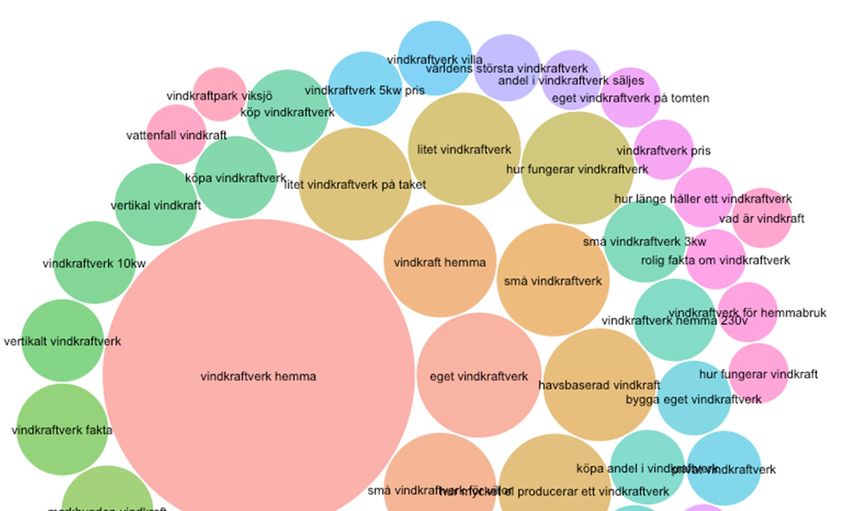
Data production and analysis
The project collected data from several platforms, namely Google Search (incl. Google Trends),
Facebook, YouTube, Twitter, and also online news. The data was collected and compiled between
May and November 2022, in the run-up to and immediately after the Swedish elections. An
additional Twitter dataset covers the period from January to September 2022. The data consists of
hundreds of thousands of data points. They are anonymous and aggregated at a high level. The data
collection was based on the keyword vindkraft (Swedish for "wind power"). It did not aim to capture
positive or negative content. Different digital methods were combined in the creation and analysis
of the dataset. These are "techniques for the study of societal change and cultural condition with
online data" (Rogers, 2019, p. 3). In the following sections, the methods of data collection and
analysis are described in relation to the respective platforms.

Google Search dataset
Data production for the Google Search dataset was initially conducted using the Research
Assessment Tool (RAT) (Lewandowski & Sünkler, 2012, 2013, 2019). The data were retrieved on
22 November and 9 December 2022. Search queries and results were collected by specifying the
search term vindkraft as the first query used to retrieve related search terms from RAT. Each query
was then used to automatically invoke Google Web Search for search results by scraping the search
engine results page (SERP). This produced a dataset that included the search results as Uniform
Resource Locators (URLs), their positions in the search results list, the domain names, and
screenshots of each result. A total of 252 actual search queries were retrieved from RAT, with a
total of 5710 search results retrieved as URLs. The process also provided a dataset listing the
autosuggest terms and related searches, monthly searches, and average monthly searches. A total of
744 autosuggest terms and related search queries were identified. The analysis was then conducted
using the R programming language and associated data science software packages, including
Tidyverse (Wickham et al., 2019), readxl (Wickham et al., 2022), kableExtra (Zhu et al., 2021), Psych
(Revelle, 2022), Packcircles (Bedward et al., 2022) and URLtools (Keyes et al., 2019). The dataset
further includes data on relative search volume for the term vindkraft in Sweden and metrics for
related searches as provided by Google Trends, as well as screenshots of graphs and lists generated by
the Google Trends tool.

Facebook dataset
The Facebook dataset consists of two parts, one to explore the circulation of news media content
about wind power in Facebook groups, and one to understand the circulation of YouTube videos
in Facebook groups.
    -    News media content: Data production for the first part of the dataset was initiated on 15
         September 2022 by scraping the URLs of 100 entries from Google News for each month
         up to the Swedish election, i.e., from January to September (example: vindkraft after:2021-
         12-31 before:2022-02-01). The results include different genres such as news articles,
         editorials, opinion pieces and press releases and come from a variety of sources, ranging
         from the morning and evening press to public service media, and trade journals to news
         aggregator services. Each URL was then submitted to the social monitoring tool
         CrowdTangle Link Checker (CrowdTangle, 2021) provided by Meta Inc. This task was
         completed by 3 October 2022. This provided a dataset that listed the number of Facebook
         interactions, comments, shares and reactions for each article. 440 of these had been shared
         in Facebook groups, which were merged into a single file. News media content without
         Facebook interaction data was omitted. The names of the Facebook groups are not
         disclosed for integrity reasons.
    -    Youtube videos and autosuggest terms: The dataset of Youtube videos about wind power
         was created on 14 September 2022 by compiling a list of the URLs of the 50 most viewed
         YouTube videos in 2022. This list was obtained via the Youtube API in response to
         entering the search query vindkraft into the Youtube search function. Each URL was then
         submitted to Meta Inc's social monitoring tool CrowdTangle Link Checker (CrowdTangle,
         2021) on 15 September. This provided a dataset that listed the number of Facebook
         interactions, comments, shares and reaction numbers for each video. Thirty-three of these
         videos were shared in Facebook groups and the data from these interactions were
         combined into a single file. The names of the Facebook groups are not disclosed for

                                                  7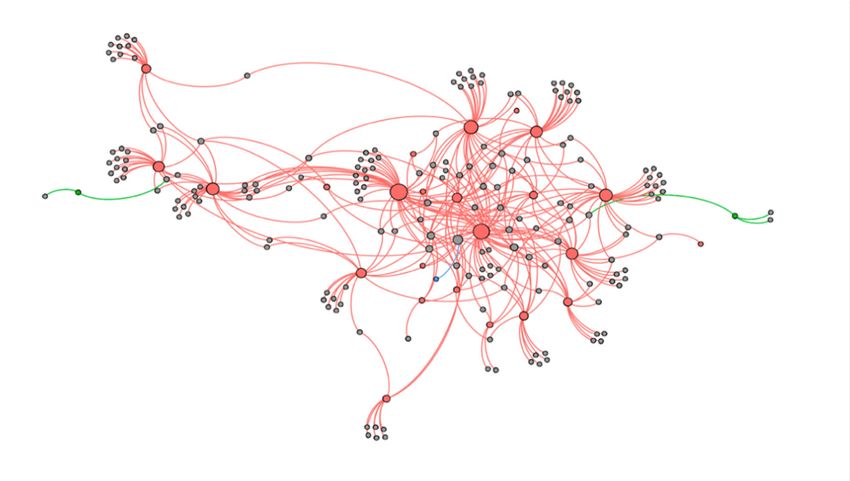
integrity reasons. In addition, the SEO tool You Autocomplete Me (You Autocomplete Me,
         2022) retrieved autosuggest terms for the YouTube search function on 29 September
         2022.
In the two parts of the dataset that emerged from the CrowdTangle data production process,
Facebook interactions are divided into three types: (1) Comments are text expressions written in
response to Facebook posts; (2) Reactions are responses to posts, including thumbs up, thumbs
down and emojis; (3) Shares are interactions where a post has been re-posted or forwarded to other
Facebook pages or groups.
Analysis was performed using the R programming language and associated data science software
packages, including Tidyverse (Wickham et al., 2019), Lubridate (Spinu et al., 2022), kableExtra (Zhu
et al., 2021), Psych (Revelle, 2022), URLtools (Keyes et al., 2019) and Plotly (Sievert et al., 2022).
Network diagrams were created using Gephi (Bastian et al., 2009). Each item of news media content
and Youtube video was then qualitatively classified employing a classification scheme based on a
previous study on Youtube content (Tang et al., 2021), i.e., three broad categories were used:
favourable, general, and unfavourable views on wind power (Table 1).
 Table 1. Coding scheme of depictions of wind power news media content and Youtube videos

        Code                   Description                                       Count
                                                                                   168
        Favourable             Documents portraying wind power
                               benefits.
                                                                                   100
        General                Documents discussing advantages and
                               disadvantages with wind power.
                                                                                   205
        Unfavourable           Documents that describe adverse
                               aspects of wind power or are highly
                               critical of one or more aspects of wind
                               power.

News media content was evaluated based on its headline, byline and lead. The reason for this
decision is that these elements are visible when a link is shared on Facebook without having to click
on it. Youtube videos were classified based on their title and content. Documents, i.e. news media
content and Youtube videos, were classified as unfavourable if they described adverse aspects of
wind power or were highly critical of one or more aspects of wind power. Documents were
classified as general if they addressed both the advantages and disadvantages of wind energy or
neither. Documents were favourable as positive if they predominantly highlighted one or more
advantages of wind power.

Twitter dataset
The Twitter dataset is composed of two parts. The first part was created by searching for the
keyword vindkraft (vindkraft*). The second part of the dataset was created by searching for the
keyword #svpol. It serves to place the results of the analysis of the first part in the broader context
of conversations in the Swedish Twitter space in the run-up to the 2022 election.
    -    The first part of the Twitter dataset was created in two steps. In the first step, we used the
         Tags tool (Hawksey, 2010). The tweets were downloaded automatically, in real-time and
         seven days backwards, starting on 22 May 2022 and ending on 4 October 2022, so the
         data collection ended three weeks after the Swedish general elections. The term initially
         submitted to the tool was vindkraft. The query was eventually extended by the truncated
         query vindkraft* (from 5 September 2022). The final dataset consisted of 72,194 tweets,
         although not all tweets are unique as the dataset also includes retweets. All Twitter handles
         were permanently removed and replaced with generic numbers (such as "User_300") to
         anonymise the data.
    -    The second part of the Twitter dataset was created by searching with the hashtag #svpol
         ("Swedish politics", cf. Larsson, 2014; Gunnarsson Lorentzen, 2017). To search the
         archive and customise the data collection tool, we used the open-source application
         Focalevents (Gallagher, 2022). In this second step, only hashtags, URLs and timestamps

                                                  8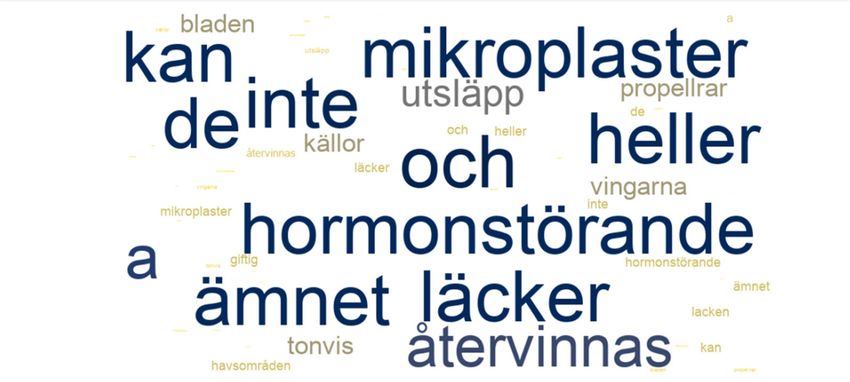
were collected, from 1 January 2022 to Election Day on 11 September. The second dataset
consisted of 834,011 tweets, retweets included.
The tweets were analysed in several steps. The Python programming language was used to prepare
the data for visualisation. For the first set, which contained tweets in full text without stop words,
we performed topic modelling, a statistical method that infers topics from documents and indicates
how much of each topic is present in each document. Each topic consists of a set of words that are
related to each other. Based on this, we created co-occurrence networks in which words of the same
topic are connected as nodes and edges. For the second dataset, we built similar networks based on
co-occurring hashtags.
Subsequently, the visualisation software Gephi (Bastian et al., 2009) was used to visualise the topic
modelling and co-hashtag analyses using network graphs. For additional text analysis of the full
tweet dataset from part one, the corpus analysis software AntConc (Anthony, 2005) was employed
to search the dataset for specific keywords and visualise words that co-occur together with them.
Finally, the Voyant tools application (Sinclair & Rockwell, 2003) helped to create word clouds
visualising the most frequent words in the entire Twitter dataset.
Results
This section provides an overview of the study’s results, broken down by dataset. First, an overview
of Google search queries and search results is given, followed by an analysis of Facebook
interactions with news media content and Youtube videos, including a section on Youtube
autosuggest terms. Finally, some results from the examination of the Twitter dataset are presented.
Google Search queries and search results
This section focuses on how Google search results on wind power come about in terms of search
queries, autosuggest terms and related search queries.
Key takeaways
The domains that appear most frequently on search results pages when searching for wind
power and related terms belong to public authorities, energy companies and news media.
The URLs that appear most frequently on search results pages when searching for wind
power and related terms are of public authorities, interest and advocacy organisations, and
energy companies.
The number of searches for the term vindkraft in Sweden rose sharply in the period leading
up to the election, peaked on 9 September 2022 and then declined. The related search that
saw the strongest increase in September 2022 was nackdelar med vindkraft (disadvantages
of wind power).
The top 10 average monthly search queries relate to four types of queries: Building your
own wind turbine, wind turbine efficiency, wind turbine operation, and offshore wind
power. The query wind turbine at home (vindkraftverk hemma) has the highest number of
average monthly searches (5400).
Swedish geographical location queries mainly retrieved search results from public service,
public authorities, and energy companies.
Frequency table – domains
Table 2. Frequencies of domains in SERPs
Unique Mean SD Min Max
domains
987 5.785208 15.30483 1 236
9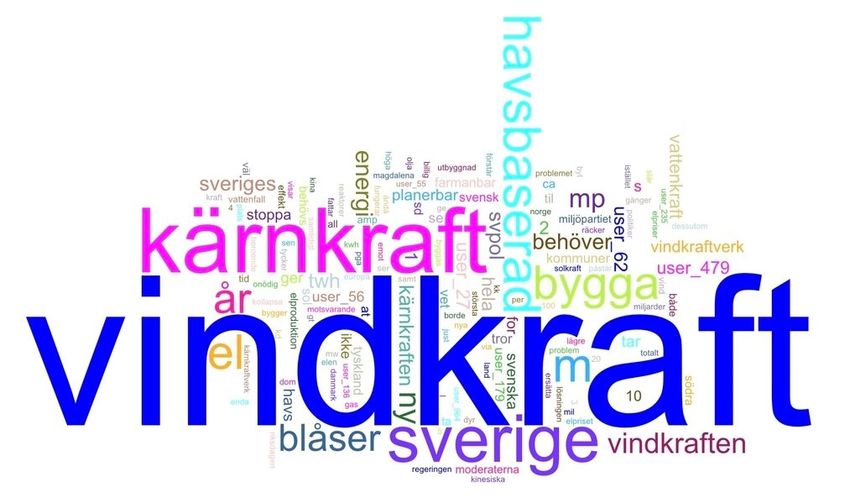
Top domain frequencies
The most common domains in the dataset include government organisations, energy companies,
interest and advocacy organisations, non-profits, news outlets and Wikipedia (Table 3).
                       Table 3. Top ten most frequent domains in SERPs

 Domain                                                                                   Count
 energimyndigheten.se                                                                       236
 group.vattenfall.com                                                                       180
 svenskvindenergi.org                                                                       129
 naturvardsverket.se                                                                        123
 naturskyddsforeningen.se                                                                   109
 vindkraftsnyheter.se                                                                       106
 energiforetagen.se                                                                          93
 svt.se                                                                                      88
 sv.wikipedia.org                                                                            82
 svenskvindkraft.com                                                                         81

Moreover, at position 1 in the SERPs, the most common domains include government
organisations, energy companies, interest and advocacy organisations and news outlets (Table 4).

                Table 4. Top ten most frequent domains in SERPs at position 1

 Domain                                                                                   Count
 energimyndigheten.se                                                                        18
 group.vattenfall.com                                                                        18
 naturvardsverket.se                                                                         12
 windforce.se                                                                                11
 svenskvindenergi.se                                                                         10
 svt.se                                                                                       9
 energiforetagen.se                                                                           7
 naturskyddsforeningen.se                                                                     7
 sunwind.se                                                                                   6
 ox2.com                                                                                      5

Frequency table – URLs

                            Table 5. Frequencies of URLs in SERPs

  Unique URLs            Mean                 SD                Min                Max
       2910             1.962199           3.600344               1                  60

                                              10
Top URL frequencies
The most common URLs in the dataset include interest and advocacy organisations, government
organisations and energy companies (Table 6).
Table 6. Top ten most frequent URLs in SERPs
URL Count
https://www.myfuelcell.se/vindkraft 60
https://www.naturskyddsforeningen.se/artiklar/vanliga-fragor-om-vindkraft/ 56
https://www.energiforetagen.se/energifakta/elsystemet/produktion/vindkraft/ 55
https://svenskvindkraft.com/smaskalig-vindkraft/ 48
https://www.energimyndigheten.se/nyhetsarkiv/2021/ny-statistik-over-installerad- 47
vindkraft-2020/
https://www.bixia.se/energi-i-fokus/vindkraft---en-viktig-del-av- 46
energiomstallningen
https://www.naturvardsverket.se/amnesomraden/vindkraft/ 46
https://www.windforce.se/vindkraftverk.php 41
https://www.boverket.se/sv/PBL-kunskapsbanken/lov-- 34
byggande/anmalningsplikt/bygglov-for-anlaggningar/vindkraftverk/
https://www.scb.se/hitta-statistik/statistik-efter-amne/energi/tillforsel-och- 33
anvandning-av-energi/manatlig-elstatistik-och-byten-av-elleverantor/pong/tabell-
och-diagram/elforsorjning/
At position 1 in the SERPs, we found the most frequent URLs to be energy solution retailers,
interest and advocacy organisations, government authorities, and energy companies (Table 7).
Table 7. Top ten most frequent URLs in SERPs at position 1
URL Count
https://www.sunwind.se/product/show/?id=1793&Vindkraftverk-X400---12V 6
https://www.windforce.se/vindkraftverk.php 6
https://group.vattenfall.com/se/var-verksamhet/vindprojekt/kriegers-flak 5
https://www.energiforetagen.se/energifakta/elsystemet/produktion/ 5
https://www.energimyndigheten.se/nyhetsarkiv/2021/ny-statistik-over-installerad- 5
vindkraft-2020/
https://www.naturvardsverket.se/amnesomraden/vindkraft/ 4
https://www.smhi.se/kunskapsbanken/meteorologi/vind/skalor-for-vindhastighet- 4
1.252
https://www.vattenfall.se/elavtal/energikallor/vindkraft/ 4
https://www.windforce.se/vindkraft-windstar3000.php 4
https://group.vattenfall.com/se/var-verksamhet/vindprojekt/faq-vindkraft/ar- 3
vindkraft-lonsamt
11Google Trends
Figure 1 below is a screenshot from Google Trends (trends.google.com) for the years 2021 and
2022. It shows that the number of searches (relative to all searches) for the term vindkraft (wind
power) in Sweden first rose sharply in the summer and autumn of 2022 and then declined.
Figure 1. Screenshot, Google Trends, 2021-2022, term: vindkraft, location; Sweden
Zooming in on September 2022 (Figure 2) shows that the peak occurred on Friday, September 9,
which was the last workday before the election.
Figure 2. Screenshot, Google Trends, September 2022, term: vindkraft, location; Sweden
According to Google Trends, the top related queries in this period from 1 to 31 September were
vindkraft sverige, vindkraftverk, nackdelar med vindkraft (wind power Sweden, wind turbines,
disadvantages of wind power). Of these three search terms, disadvantages of wind power and wind
turbines recorded the largest increases and are classified as rising searches.
Figure 3. Screenshot, Google Trends, related Figure 4. Screenshot, Google Trends, related
queries (top) queries (rising)
To explain: Related queries are terms (incl. combinations of terms) that users entered into the search
engine during the same search session. Google Trends breaks down those related queries by two
different metrics and this way distinguishes between top searches and rising searches (Google,
2023). Applied to the case of wind power, this means that top searches are the terms that were
searched for most frequently in Sweden during the same search session as the term vindkraft, in the
image above during 1-31 September 2022. Rising searches are terms that were searched for together
with the term vindkraft and had the largest increase in search volume in September 2022. For each
rising search term, the percentage growth of the term compared to the previous period is given.
12The search term vindkraftverk increased by 120%. The phrase nackdelar med vindkraft (disadvantages
of wind power) lacks such a figure and is instead assigned the label breakout. This indicates that it
has increased by more than 5000% (Google, 2023).
Search queries, autosuggest queries and related searches
We also drew on search queries, autosuggest queries and related search queries obtained by querying
the Google Keyword Planner via RAT (Table 8). Queries averaging higher than 5400 were omitted
with the motivation that these only included general search queries on wind power (vindkraft and
vindkraftverk), which skewed the visualisation.
We note that the top 10 average monthly search queries relate to four types of queries: Building
your own wind turbine (examples: eget vindkraftverk, vindkraft hemma), wind turbine efficiency
(examples: hur mycket el producerar ett vindkraftverk), wind turbine operation (examples: hur fungerar
vindkraftverk) and offshore wind power (example: havsbaserad vindkraft). The search query vindkraftverk
hemma stands out in terms of average monthly searches (5400), while the similar search query eget
vindkraftverk records only 880 average monthly searches. The remaining eight search queries in the
list have a monthly average of 720 search queries.
Table 8. Top ten monthly average searched terms, autosuggest terms, related search terms
Query Monthly average searches
vindkraftverk hemma 5400
eget vindkraftverk 880
hur mycket el producerar ett vindkraftverk 720
hur fungerar vindkraftverk 720
små vindkraftverk 720
havsbaserad vindkraft 720
små vindkraftverk för villor 720
vindkraft hemma 720
litet vindkraftverk på taket 720
litet vindkraftverk 720
Next, we visualised the 50 topmost queries and their average monthly searches using a circular
packaging plot (Figure 5). Nodes represent each Google search query, and their sizes represent the
number of average monthly Google searches made.
As per Figure 5, the ten topmost search queries are replicated through the large pink node and the
adjacent pink and orange nodes. The left, green nodes moreover relate to wind turbines coupled
with kilowatt search terms (små vindkraftverk 5 kw, vindkraftverk 10 kw), wind turbine costs (vad kostar
ett vindkraftverk) and queries directed towards a specific geographical location (markbygden vindkraft).
13Figure 5. Monthly average search terms, autosuggest terms
and related Google search queries for vindkraft
Queries relating to the purchasing and development of small wind turbines (vindturbin villa, bygga eget
vindkraftverk) can furthermore be seen in the turquoise and blue nodes, as can queries relating to the
investments regarding wind turbines (köpa andel i vindkraftverk). Apart from the priorly mentioned
forms of queries, we also see queries relating to the persistence of wind turbines as a pink node (hur
länge håller ett vindkraftverk) and general queries relating to wind turbines’ functions and measures
(hur fungerar ett vindkraftverk, hur högt är ett vindkraftverk).
Search results of Swedish geographic location queries
In addition, we manually grouped a subset of the retrieved search terms that included place names.
i.e., geographic locations in Sweden (i.e., vindkraft gotland, vindkraft ripfjället). This provided some
insights into which results are obtained for Google searches about windpower with a local focus.
Table 9. Frequency table for grouped queries and SERPs
Unique Mean SD Min Max
domains
267 2.576779 3.8774342 1 36
As can be seen in Figure 6, searches that included place names mainly retrieved results from public
service, including Sveriges Television (36) and Sveriges Radio (22), public authorities such as the
Swedish Energy Agency (29) or the Swedish Environmental Protection Agency (8), and energy
companies such as Vattenfall (17), Jönköping Energi (9) or OX2 (8). These are the combined results
for all queries in our data set that included place names. The search results for individual queries
pertaining to particular locations differ both from each other and from the combined results below.
14Figure 6. Top 20 domain frequencies for geographic location queries
News websites and aggregators such as Newsworthy (19), Vindkraftsnyheter (15), Sydsvenskan (9)
and the social media platform Facebook (9) are also prominent. Other domains include the
document-sharing platform Docplayer (15), Wikipedia (9) and Regionfakta (9), an aggregation
service for official Swedish statistics.
Facebook interactions with news media content
To clarify which understanding of wind power prevails on major social media platforms, this
subsection describes the spread of Swedish news media content on Facebook during the study
period. The results are used to outline the prevalence and distribution of different views on wind
power, how relationships are established between Facebook groups and URLs, and the distribution
of and relationship between different types of interactions.
Key takeaways
News media content that portrayed wind power unfavourably tended to receive more
Facebook shares and reactions than favourable content.
News media content that portrayed wind power favourably or in general terms tended to
receive more Facebook comments than unfavourable content.
The news media content with the most interactions on Facebook was about a wind turbine
that had fallen apart.
The content with the second and third highest number of interactions contrasted wind
power with nuclear power.
Of the ten pieces of news media content with the most interactions, eight portrayed wind
power unfavourably.
15Frequency table
Table 10. Frequency table of news media content interactions in Facebook groups
Count Mean SD Min Max
Comments 71506 162.51364 604.3768 0 11278
Reactions 196035 445.53409 1342.1267 0 22173
Shares 25604 58.19091 204.6485 0 2620
Top news media article interactions
Looking at the top interactions with news media content in the dataset (Table 11) shows that the
news media content with the most interactions concerns a wind turbine that had fallen apart. The
majority of the ten pieces of news media with the most interactions portrayed wind power
unfavourably and/or held critical views of wind power. The content with the second and third most
Facebook interactions contrasted wind power with nuclear power.
Table 11. Top ten most interacted news media content in Facebook groups
Headline URL Count
Vindkraftverk på Hästkullen https://www.svt.se/nyheter/lokalt/vasternorrl 36071
har rasat ihop and/vindkraftverk-pa-hastkullen-har-rasat-
ihop-ingen-person-skadad
Ni gjorde kärnkraften https://www.gp.se/debatt/ni-gjorde- 14694
olönsam - skyll inte på k%C3%A4rnkraften-ol%C3%B6nsam-skyll-
marknaden inte-p%C3%A5-marknaden-1.79433675
”Vill man få ett stabilt elnät i https://www.sydsvenskan.se/2022-08-01/vill- 7450
södra Sverige går det bara att man-fa-ett-stabilt-elnat-i-sodra-sverige-gar-det-
välja kärnkraft.” bara-att-valja-karnkraft
Vi behöver inte ett enda https://www.gp.se/fria-ord/vi- 5815
vindkraftverk beh%C3%B6ver-inte-ett-enda-vindkraftverk-
1.77333929
Magda har dubbelfel om https://www.expressen.se/ledare/malin- 5672
vindkraft till havs siwe/magda-har-dubbelfel-om-vindkraft-till-
havs/
Stenevi vill fyrdubbla https://www.aftonbladet.se/nyheter/samhalle/ 5551
vindkraften – staten ska a/Rr059A/marta-stenevi-vill-fyrdubbla-
satsa 100 miljoner vindkraften-i-sverige
Elbilars batteri och https://abounderrattelser.fi/elbilars-batteri- 5449
sol/vindkraftverk och-sol-vindkraftverk/
Ytterligare vindkraftverk https://sverigesradio.se/artikel/ytterligare- 5357
avstängda i Björkvattnet vindkraftverk-avstangda-i-bjorkvattnet-efter-
efter att vinge gått av att-vinge-gatt-av
Andreas vädjan till https://www.smalanningen.se/2022-04- 4837
grannarna: ”Arrendera inte 05/andreas-vadjan-till-grannarna-arrendera-
ut för vindkraft” inte-ut-for-vindkraft
”Vi behöver vattenkraft, https://www.svensktnaringsliv.se/sakomraden 4771
vindkraft och kärnkraft” /hallbarhet-miljo-och-energi/vi-behover-
vattenkraft-vindkraft-och-
karnkraft_1187750.html
16Top domains featured in the dataset
Looking at the top domains in the dataset (Table 12), Sveriges Television is the most common top
domain in the dataset. Public service organisations, Sveriges Radio and Sveriges Television, are the
top two domains in the dataset. They are followed by the newspapers Göteborgs-Posten and
Dagens Nyheter.
Table 12. Top ten most interacted news media content domains in Facebook groups
Domain Count
svt.se 79
sverigesradio.se 32
dn.se 24
gp.se 24
alandsradio.ax 15
di.se 14
sydsvenskan.se 13
expressen.se 12
nt.se 10
nyteknik.se 10
Time series – monthly posts
News media content on wind power posted on Facebook during 2022 peaked in February, April,
May, and July (Figure 7).
Figure 7. Monthly distribution of news media content posted in Facebook groups
17From January to September, posts of news media content about wind power fluctuate in waves. A
first wave can be observed in January, followed by two high peaks in mid and late February. Another
peak can be seen in February, followed by a series of posts in May, leading to another peak in the
second half of the month. After a few weeks of lower activity, fluctuations occur again at the end
of June, peaking at the end of July. There is little to no activity in early August, with a few smaller
waves of Facebook posts occurring towards the end of the month and in September.
Interaction relationships
The following scatterplots show the distribution of interaction types in comments, shares and
reactions to news media content concerning wind power in Facebook groups. Each data point
represents a piece of news media content. Figure 8 shows the distribution of reactions compared
to shares. Figure 9 shows comments compared to shares. Figure 10 also shows the distribution of
reactions versus comments. Figure 11 shows the distribution of reactions, comments, and shares
in total.
The news media content with the most shares in the dataset presents wind power in a negative light.
In particular two pieces of news media content that depict wind power unfavourably stand out in
terms of reactions and shares. The local estimated scatterplot smoothing shows a curve towards
reactions.
Figure 8. News media content reactions and shares in Facebook groups (n = 440)
Moreover, news media content portraying wind power unfavourably tends to be shared more often
than news media content offering a favourable view of wind power (Figure 9).
18Figure 9. News media content comments and shares in Facebook groups (n = 440)
On the other hand, content with favourable views on wind power tends to receive more comments
than unfavourable depictions. One news media article depicting wind power unfavourably is a clear
outlier in terms of comments and shares. The local estimated scatterplot smoothing shows an even
increase with a curve towards comments for outliers. Our data do not allow any conclusions to be
drawn about the content or character (e.g., favourable, or unfavourable) of the comments.
Concerning reactions compared to comments, news media content with unfavourable views of
wind power tends to get more reactions than news media content portraying wind power favourably
(Figure 10).
Figure 10. News media content reactions and comments in Facebook groups (n = 440)
19News media content offering favourable views on wind power tends to get more comments than
news media content with unfavourable views. In particular, one news media item presenting wind
power unfavourably stands out in terms of the number of comments and reactions. The local
estimated scatterplot smoothing shows an even increase with a curve towards comments for
outliers.
The distribution of the three variables (reactions, comments, shares) is also visualised as a 3D plot
(Figure 11). It shows that news media content depicting wind power unfavourably tends to get
more reactions compared to shares and comments.
Figure 11. News media content reactions, comments, and shares in Facebook groups (n = 440)
News media content with favourable views of wind power tends to be even in terms of comments
and reactions, but not as widely shared. News media content depicting wind power in general terms
tends to serve as a middle ground. The pieces of news media content with most interactions portray
wind power unfavourably. Some are clear outliers in terms of reactions and shares.
News media content – Facebook group relations
In the network below (Figure 12) news media content is visualised in terms of the extent of
interaction with it in Facebook groups. Grey nodes represent Facebook groups. Red nodes
represent news media content with unfavourable portrayals of wind power. Blue nodes represent
news media content that talks about wind power in general terms. Green nodes represent news
media content with favourable portrayals of wind power. The size of the nodes represents the
number of relationships, and the centrality implies link interrelation.
20Figure 12. News media content relations with Facebook groups
In the main cluster, several Facebook groups tend to interact with several of the unfavourable pieces
of news media content. There is a core that posts news media content that associates wind power
with negative implications. Green, i.e., positive representations are more likely to be found in the
lower part of the network plot. The same is the case for blue, i.e., general representations. The
general and favourable representations have in common that they occasionally mix with the
unfavourable core. The relationships between Facebook groups - and news media content - are
predominantly unfavourable, i.e., red, with occasional favourable outliers and general outliers.
Facebook interactions with Youtube videos
As in the previous section on Facebook interactions with news media content, this section presents
Facebook interaction patterns for Youtube videos on wind power. The distribution of interactions
with Youtube videos is explained, as well as the relationships between Facebook groups and
Youtube video URLs, and the relationship between different forms of interactions.
Key takeaways
The majority of the 50 most viewed Youtube videos retrieved when searching for vindkraft
portrayed wind power in a negative light. Interaction data of the 33 most-watched Youtube
videos were gathered in the dataset.
The ten Youtube videos with the most Facebook interactions depicted unfavourable/critical
views.
Arguments mentioned in the unfavourable/critical Youtube videos concern unprofitability,
inefficiency, environmental concerns, and costs.
Unfavourable depictions of wind power in Youtube videos were prominent in terms of
reactions, shares, and comments.
21Frequency table
Table 13. Frequency table of Youtube video interactions in Facebook groups
Count Mean SD Min Max
Comments 19789 599.6667 759.1327 1 2770
Reactions 98273 2977.9697 4739.4446 0 22687
Shares 35390 1072.4242 1291.1064 1 5710
Top Youtube video interactions
The Youtube video on wind power that was most interacted with on Facebook in our dataset
contrasts hydropower with wind power (Table 14). Most Facebook interactions with Youtube
videos about wind power in our dataset relate to unfavourable portrayals of wind power. The two
topmost Youtube videos on wind power in terms of Facebook interactions have more than 20 000
interactions each.
Table 14. Top ten most interacted Youtube video URLs in Facebook groups
URL Count
https://www.youtube.com/watch?v=nrMuTTULKe4 27664
https://www.youtube.com/watch?v=CJcIXznbsV4 23668
https://www.youtube.com/watch?v=gckqg-r_oFs 12235
https://www.youtube.com/watch?v=SD0e5y1pDnc 12169
https://www.youtube.com/watch?v=ksuR15ulMsI 9173
https://www.youtube.com/watch?v=4Ob5Lfc7LVY 9116
https://www.youtube.com/watch?v=WzsjcCrQ26E 7622
https://www.youtube.com/watch?v=3TQE0Kch48k 6038
https://www.youtube.com/watch?v=wk9URPZ-BOk 5644
https://www.youtube.com/watch?v=ugkaUOzsjvs 5337
Time series – monthly posts
Facebook group posts of Youtube videos concerning wind power peaked in April, May, June, July,
and September 2022 (Figure 13).
Figure 13. Monthly distribution of Youtube videos posted in Facebook groups
22Interaction relationships
The following scatter plots show the distribution of types of interactions across comments, shares
and reactions to Youtube videos on wind power in Facebook groups. Each data point is a piece of
news media content. Figure 14 shows the distribution of reactions compared to shares. Figure 15
shows comments compared to shares. Figure 16 shows the distribution of reactions versus
comments. Figure 17 illustrates the distribution of reactions, comments, and shares overall.
Unfavourable portrayals of wind power in Youtube videos are prominent in terms of both the
number of reactions and the number of shares (Figure 14).
Figure 14. Youtube video reactions and shares in Facebook groups (n = 33)
The local estimated scatterplot smoothing shows an even increase with a slight curve towards
reactions for outliers. Accordingly, unfavourable portrayals of wind power in Youtube videos are
prominent in terms of both the number of comments and the number of shares (Figure 15).
Figure 15. Youtube video comments and shares in Facebook groups (n = 33)
23One Youtube video, in particular, stands out, both in terms of the number of comments and the
number of shares. The local estimated scatterplot smoothing shows an even increase with a slight
curve towards comments. In addition, unfavourable portrayals of wind power in Youtube videos
are conspicuous in terms of both the number of comments and the number of reactions (Figure
16).
Figure 16. Youtube video reactions and comments in Facebook groups (n = 33)
The local estimated scatterplot smoothing shows a slope towards reactions for outliers. Two
Youtube videos stand out in terms of both the number of comments and reactions. Visualised as a
3D plot (Figure 17), Youtube videos portraying wind power unfavourably tend to get the most
reactions, comments, and shares.
Figure 17. Youtube video reactions, comments, and shares in Facebook groups (n = 33)
24Youtube videos in which wind power is portrayed in a favourable or general way usually have a low
response in Facebook reactions, shares and comments. The Youtube videos with the most
interactions portray wind power unfavourably, with some of them being clear outliers in terms of
reactions and shares.
Youtube videos – Facebook group relations
In addition, the Youtube videos are visualised in relation to the extent of interaction with them in
Facebook groups (Figure 18). Grey nodes represent Facebook groups. Red nodes represent
Youtube videos with unfavourable portrayals of wind power. Blue nodes represent Youtube videos
in which wind power is portrayed in a general way. Green nodes represent Youtube videos with
favourable portrayals of wind power.
Figure 18. Youtube video relations with Facebook groups
In the main cluster, several smaller clusters of Facebook groups tend to redistribute some of the
Youtube videos that portray wind power in an unfavourable light. The network prominently
features unfavourable (i.e. in red), relations with occasional favourable and general outliers.
Youtube autosuggest terms
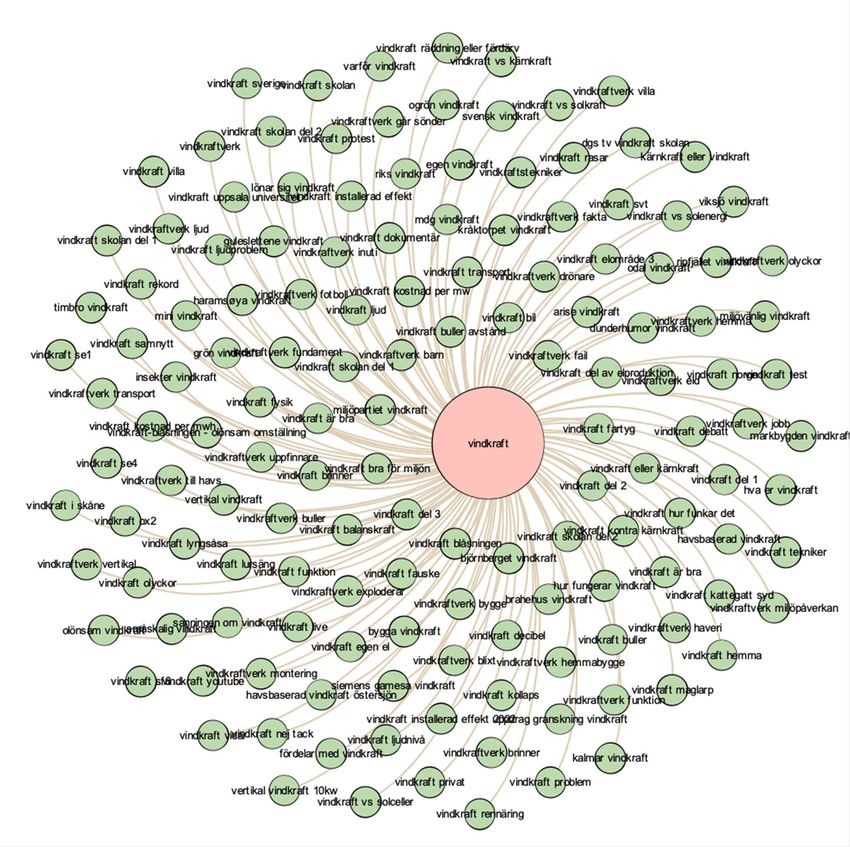
We also plotted Youtube autosuggest terms related to queries on vindkraft (Figure 19). The search
terms relate mainly to local wind power projects (examples: vindkraft lyrgsåsa, kråktorpet vindkraft,
björnberget vindkraft), forms of energy production pitted against each other (examples: vindkraft vs
kärnkraft, vindkraft eller kärnkraft, vindkraft vs solkraft), information about how wind power works
(examples: vindkraft fysik, hur fungerar vindkraft, vindkraftverk fakta), problems with wind
turbines(examples: vindkraftverk haveri, vindkraft buller, vindkraftverk brinner, olönsam vindkraft) and
installing wind turbines at home (examples: vindkraft, privat, vindkraft hemma, mini vindkraft, vindkraft
villa).
25Figure 19. Youtube autosuggest terms relating to vindkraft
Twitter conversations
This section deals with wind power narratives on Twitter. The results of our first Twitter dataset
are examined to establish which words, topics and hashtags appear most frequently. We then zoom
into three themes to see which words appear in specific claims about wind power. Finally, we
examine the second Twitter dataset to look at the positioning of the hashtag #vindkraft in
conjunction with the hashtag #svpol to see where wind power featured in Swedish political
conversations on Twitter in the run-up to the 2022 general election.
Key takeaways
Tweets about wind power frequently also mention nuclear power.
The use of hashtags (#) is relatively uncommon in the dataset, at roughly 9 per cent. The most
used hashtags are related to Swedish politics and energy production.
Zooming in on three themes found in the general online discussion on wind power showed
that illness is mainly used as a metaphor for wind power, but it is also mentioned as an effect
of wind power. Turbine blades are often related to microplastics and bisphenol A.
The use of the #vindkraft hashtag in Swedish political discussions on Twitter increased in the
lead-up to the 2022 general elections. The hashtag #vindkraft occurs in tweets together with
other hashtags related to energy production, fuel prices and transport, showing the context of
these discussions.
26To provide an overview of the Twitter dataset, Figure 20 below shows the most frequently
occurring words in the collected tweets, excluding stop words (e.g., prepositions, common verbs
etc.) in the form of a word cloud. This figure was created using Voyant tools.
Figure 20. Full Twitter data word cloud
The keyword used in the creation of the dataset was vindkraft, which also makes it the most common
term in the word cloud. Looking at the visualisation, we see that the second most common term is
kärnkraft ("nuclear power"), followed by Sverige (Sweden), havsbaserad (offshore), el (electricity), bygga
(build) and blåser (blows ). If we zoom in further, we can also see, for example, that certain users
are mentioned frequently. Since we have permanently deleted the user handles, these only appear
in the dataset in pseudonymised form (e.g. user_56). However, this still indicates that specific users
were prominent and possibly dominant in discussions about wind power on Twitter. Also
mentioned in the dataset are several political parties, which is reflected in the word cloud.
Key topics and hashtags in the Twitter data
Topic modelling was performed to gain an idea of the topmost topics within the dataset. The
following figure (Figure 21) shows a network graph of the terms and topics prevalent in the dataset,
created in Gephi.
The map below shows not only the most common topics, but also how the topics are connected.
With the layout algorithm chosen, words that are connected to many other words tend to be
positioned centrally, but the strength of the connections also influences the positioning. An
example of this is vindkraft (wind power), the most frequently occurring word in the dataset with
numerous connections. However, this word has many connections with words that themselves have
fewer connections, so both they and vindkraft are on the periphery of the network. Meanwhile,
kärnkraft (nuclear power) forms its own central cluster in the wind power dataset because it has
stronger connections to other words, which in turn have many other connections. Similarly,
offshore wind power (havsbaserad) is closer to nuclear power in the centre because of its many
connections. At the edges of the diagram, there are some smaller clusters related to wind power
and energy production in neighbouring Scandinavian countries. For example, there is a small
Norwegian cluster in the upper right corner. Tweets in these languages were collected in our dataset
because vindkraft (wind power) is spelled the same in several Scandinavian languages. This also
shows that there is some degree of overlap between languages and contexts in Twitter.
27You can also read