Towards a Characterization of Background Music Audibility in Broadcasted TV
←
→
Page content transcription
If your browser does not render page correctly, please read the page content below
International Journal of
             Environmental Research
             and Public Health

Article
Towards a Characterization of Background Music Audibility in
Broadcasted TV
Roser Batlle-Roca 1, * , Perfecto Herrera-Boyer 1 , Blai Meléndez-Catalán 2 , Emilio Molina 2 and Xavier Serra 1

                                            1   Music Technology Group, Universitat Pompeu Fabra, 08002 Barcelona, Spain
                                            2   BMAT Music Innovators (BMAT Licensing, S.L.), 08028 Barcelona, Spain
                                            *   Correspondence: roser.batlle@upf.edu

                                            Abstract: In audiovisual contexts, different conventions determine the level at which background
                                            music is mixed into the final program, and sometimes, the mix renders the music to be practically
                                            or totally inaudible. From a perceptual point of view, the audibility of music is subject to auditory
                                            masking by other aural stimuli such as voice or additional sounds (e.g., applause, laughter, horns),
                                            and is also influenced by the visual content that accompanies the soundtrack, and by attentional
                                            and motivational factors. This situation is relevant to the music industry because, according to
                                            some copyright regulations, the non-audible background music must not generate any distribution
                                            rights, and the marginally audible background music must generate half of the standard value of
                                            audible music. In this study, we conduct two psychoacoustic experiments to identify several factors
                                            that influence background music perception, and their contribution to its variable audibility. Our
                                            experiments are based on auditory detection and chronometric tasks involving keyboard interactions
                                            with original TV content. From the collected data, we estimated a sound-to-music ratio range to define
                                            the audibility threshold limits of the barely audible class. In addition, results show that perception is
                                            affected by loudness level, listening condition, music sensitivity, and type of television content.

                                            Keywords: background music; loudness perception; psychoacoustic experiments; complex auditory
                                            scene; everyday life environments; broadcasted TV; listening conditions; behaviour and cognition

Citation: Batlle-Roca, R.;
Herrera-Boyer, P.; Meléndez-Catalán,
B.; Molina, E.; Serra, X. Towards a         1. Introduction
Characterization of Background
                                                 Music broadcasted in audiovisual productions provides a large stream of income for
Music Audibility in Broadcasted TV.
                                            the music industry through author copyrights. The distribution rules of royalties vary by
Int. J. Environ. Res. Public Health 2023,
                                            country and consider several conditions, such as time slots and the importance of music
20, 123. https://doi.org/10.3390/
                                            in production.
ijerph20010123
                                                 In 2017, WIPO (World Intellectual Property Organization) determined that non-audible
Academic Editor: Paul B. Tchounwou          or inaudible background music should not generate distribution rights, and barely audi-
                                            ble background music should generate 50% of the standard value generated by audible
Received: 31 October 2022
Revised: 8 December 2022
                                            music [1]. Therefore, the assessment of background music audibility in broadcasted TV
Accepted: 15 December 2022
                                            is under scrutiny since copyright remuneration is compromised on the audibility level.
Published: 22 December 2022                 Indeed, collective management organisations, e.g., SGAE (General Society of Authors
                                            and Publishers of Spain), still need to detect when these circumstances are present in
                                            broadcasted programs.

Copyright: © 2022 by the authors.           1.1. Problem Identification
Licensee MDPI, Basel, Switzerland.               The music industry faces the problem of proposing a definition for the three au-
This article is an open access article
                                            dibility categories: audible, barely audible and inaudible background music, and requires
distributed under the terms and
                                            automatic systems that are able to classify the perceived audibility of background music in
conditions of the Creative Commons
                                            audiovisual productions.
Attribution (CC BY) license (https://
                                                 From the perspective of the audience, the received signal is a mixture emitted by TV
creativecommons.org/licenses/by/
                                            broadcasters. That signal contains both musical and non-musical sources simultaneously,
4.0/).

Int. J. Environ. Res. Public Health 2023, 20, 123. https://doi.org/10.3390/ijerph20010123                      https://www.mdpi.com/journal/ijerph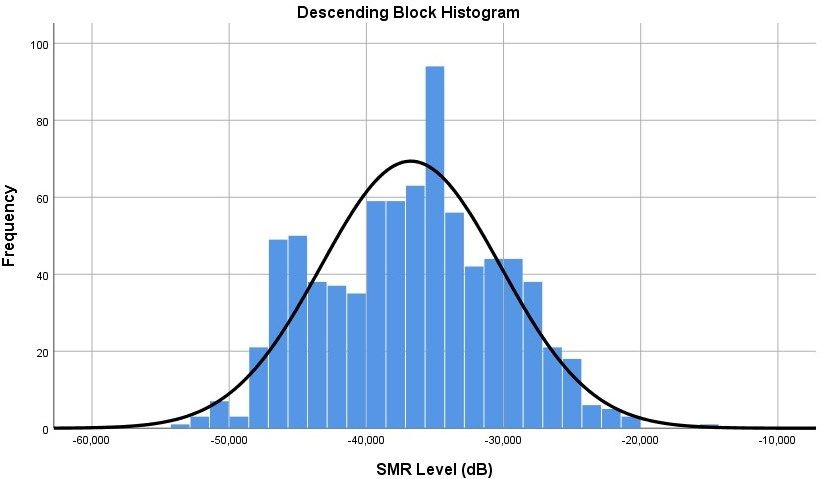
Int. J. Environ. Res. Public Health 2023, 20, 123                                                                              2 of 15

                                        despite the music flows being separated from the other sounds at the moment of the
                                        production (Figure 1). Hence, it is difficult to measure the perceived loudness level of each
                                        signal source independently without applying source separation, or considering technical
                                        characteristics such as masking and frequency selectivity that strongly influence what the
                                        end user hears.

                                        Figure 1. Representation of case scheme.

                                             Moreover, one might think that the definitions of the categories audible, barely audible
                                        and inaudible background music only depend on their relative loudness thresholds. That
                                        is, determining which loudness level or loudness range of the music must be classified
                                        into each category. If music could be separated from the rest of the audio content and
                                        a simple sound-to-music ratio (SMR) could be obtained through loudness estimation of
                                        each track, we could classify the clips according to their corresponding audibility level,
                                        after establishing a loudness threshold between these categories.
                                             However, other influential elements, such as environmental noise, listening condi-
                                        tions, and even the musical sensitivity of the listeners, might increase or decrease this
                                        required threshold of loudness. Hence, we face a complex auditory scene analysis problem
                                        with many variable elements that can influence music perception.

                                        1.2. Background Concepts and State-of-the-Art
                                              Understanding background music perception is complex and affected by several
                                        characteristics, which must be considered in this study. Therefore, we must be careful in
                                        defining which of these elements influence music perception and how these may condition
                                        the audibility level of music in audiovisual content. Thus, this subsection’s objective is
                                        to lay out the principal elements of perception that are taken into account here, along
                                        with similar investigations that support our hypotheses and the experiments’ approaches
                                        addressed in Section 2.
                                              In broadcasted TV programs, it is common to face auditory masking, as there are
                                        many circumstances where there are multiple sounds simultaneously transmitted, e.g., a
                                        presenter introducing a contest while there is music in the background and the public is
                                        applauding, which might overwhelm the audience with multiple sounds. To distinguish
                                        them, they rely on frequency selectivity, which refers to the ability to separate frequency
                                        components of a complex sound [2]. Nonetheless, this does not assure they are perceiving
                                        all the sounds in the mixture, as one might mask the others.
                                              In addition, loudness is the perceived magnitude of a sound and cannot be directly
                                        measured since it is a subjective quantity [2]. Thus, the loudness perception of a signal
                                        is subjective, and each subject’s perception can vary due to individual features such as
                                        attention and awareness (with attention referring to voluntarily focusing the mind on some
Int. J. Environ. Res. Public Health 2023, 20, 123 3 of 15
stimulus or feature of it (e.g., music pitch, following a melody), whereas awareness refers
to being conscious that something, such as background music, is happening or is present).
Regardless, thanks to the auditory scene analysis [3], the human auditory system can
stream or tell apart different sonic objects even when they are concurrently stimulating
our hearing sense (e.g., the speech of a TV conductor, laughs from a live audience in the
TV set, some background music in the program, and the telephone ringing at home) [4].
According to our current knowledge, the complex sonic stimulation is usually simpli-
fied into foreground and background (and sometimes an extra additional stream can be
extracted too) by means of automatic or semi-automatic heuristics based on hypotheses
about structural properties of concurrent sounds (i.e., harmonicity, synchronicity, spatial
placement, etc.) and how they evolve over time (i.e., if they covariate or not, if they have
different spectral content, etc.). Once streams are created, attentional processes might
produce further refinements on one of them, or might even suppress the processing of part
of the available information.
Moreover, a known phenomenon is the so-called “inattentional unawareness” [5],
consisting of misperceiving unexpected stimuli, due to a lack of attention or sensorial
resources. In the auditory domain, we find the idea of inattentional deafness. As exposed
by Koreimann [5], inattentional deafness in music is defined as the inability to consciously
perceive characteristics of the music piece, for example, unawareness of a given instrument
when attention is directed towards a different one, or to decide on rhythmic features.
Their investigation sustains the existence of inattentional deafness in music and that the
human auditory system is more influenced by attentional distraction than it was previously
thought. Additionally, Molloy et al. [6] describes inattentional deafness as the failure to
perceive auditory stimuli under high visual load. Indeed, several studies carried out by
Lavie and colleagues ([6–9]) demonstrate the influence of visual stimuli on inattentional
deafness through different behavioural experiments.
Hence, for our exposed scenario (loudness perception of background music in broad-
casted TV programs), these investigations justify the need to study different perceptual
characteristics, such as motivated attention and perceptual unawareness, and the influence
of the visual stimuli on our definition of the barely audible loudness thresholds. However,
this last element (i.e., visual stimuli) is herein omitted since it is beyond the scope of the
study and not of priority in our research agenda.
Another element to consider in this investigation is ecological validity. In empirical
evaluations, ecological validity is understood as the amount of realism an experiment setup
has, compared to the person’s real context [10]. It relies on the similarities between the test-
ing conditions and the real scenario where the studied element occurs. Consequently, when
conducting auditory and behavioural experiments, it is important to preserve the ecological
validity of the case study to be able to extrapolate and generalise the obtained results.
During this investigation, we considered the most pragmatic context of our case
study: watching broadcasted TV content while seated on a sofa viewed on a television.
Nonetheless, we consider other listening scenarios that are also frequent when engaging in
audiovisual stimulation at home: loudspeakers and headphones, as people also frequently
watch TV programs from computers, tablets, or mobile phones.
1.3. Related Work
Background music audibility estimation is not a widely addressed topic, but during
the development of this study, SGAE (which is the most important music rights man-
agement society in Spain) conducted a similar investigation with a research team from
Universitat Politècnica de València (UPV). Their work has been reported in the 152nd
Audio Engineering Society Convention held in May 2022 [11]. In this article, López and
Ramallo expose the same industrial problem as us: studying the audibility of background
music in television programs considering three levels of audibility (audible, barely audible
and inaudible). They consider several elements that may influence the perception of back-Int. J. Environ. Res. Public Health 2023, 20, 123 4 of 15
ground music and conclude that the feasible solution is to build a deterministic system that
converges to the average estimate of listeners’ audibility.
To evaluate the audibility level of background music, they created a manual annotation
of 88 artificial 10-second clips of video, composed of the voice of two popular Spanish news
hosts (one male, one female) and added songs of different music genres. Participants had
to determine barely audible volume for each combination through an attenuator (sliding
fader). The authors establish the threshold between barely audible and inaudible around
−30 dB and propose a linear regression to adjust the perceived loudness level. They
conclude that, when working with original broadcasted content where voice and music
are mixed, it is required to use source separation techniques to estimate music loudness
level. Unfortunately, from our own experience and from what has been reported in state-of-
the-art ([12,13]), these techniques are still far from providing excellent results that can be
applied in this sensitive scenario.
Additionally, considering all the previously discussed factors involved in a typical
TV-watching situation, we think that the problem is still far from being solved with such
a deterministic approach, and our aim is to further investigate towards a more nuanced
and multi-component predictive model. Therefore, the goal of this investigation is to
assess background music audibility in audiovisual productions by defining an approximate
loudness level threshold for the three established auditory categories and to study the
influence of listening conditions on background music perception, taking into account
non-music signals (i.e., speech, applauses, etc.), environment noise, auditory scene-setting
and subject-related characteristics. In this study, we report on two psychoacoustic experi-
ments, based on auditory detection and chronometric tasks involving computer keyboard
interactions, with real TV content. We identify that perception is influenced by loudness
level, auditory condition, environment characteristics, ambience noise, music sensitivity
and type of television content; and, establish two loudness thresholds that separate the
three different audibility categories: audible, barely audible and inaudible.
2. Materials and Methods
To understand the exposed complex auditory scene analysis problem and evaluate
the characteristics that influence background music perception, we planned, designed
and carried out two psychoacoustic listening experiments: (1) Did you hear the music? and
(2) Perceiving the music. In each experiment, certain factors are studied: sound frequency
selectivity and SMR variation, in the first; and, listening conditions impact (headphones,
loudspeaker, TV), in the second. Participants were submitted to different aural conditions
from different audiovisual segments and had to assess their auditory perception through
simple tasks involving computer keyboard-based answers.
The experiments were conducted onsite, always in the same room, and directly super-
vised by an investigator. To recreate a kind-of “living room”, the room included a TV and a
sofa from which the participants attended the experiment. For the second experiment, a ta-
ble and chair were set to complete the headphones and loudspeakers’ listening conditions.
The average ambient noise in the room was 35.8 dBA, which agrees with the participants’
experience during the experiments, as most of them considered the noise environment
weak or inaudible. Stimuli for both experiments are 10-second clips of video from five
Spanish TV channels (TV1, TV2, LaSexta, Cuatro and Antena 3), recorded between 28th
June 2021 at 13:15 and 7th July 2021 at 10:15. These stimuli were extracted from BMAT’s
database and cannot be openly shared as they are subject to confidentiality regulations.
The software tool that we used to build and control all these experiments is lab.js (https:
//lab.js.org/ (accessed on 31 October 2022)), which offers the possibility to both write code
using a high-level JavaScript library and to build experiments using an online graphical
interface. Experiments were run online using the Pavlovia platform (https://pavlovia.org/
(accessed on 31 October 2022)).
Furthermore, the Institutional Committee for Ethical Review of Projects (CIREP)
at Universitat Pompeu Fabra reviewed and approved the experimental approach as itInt. J. Environ. Res. Public Health 2023, 20, 123 5 of 15
complies with the ethical principles in research involving humans and personal data
protection regulations (guided by Regulation (EU) 2016/679 of the European Parliament
and of the Council of 27 April 2016 on the protection of natural persons with regard to
the processing of data and on the free movement of such data, and repealing Directive
95/46/EC (General Data Protection Regulation)).
2.1. Participants
Following CIREP guidelines, we looked for participants between the ages of 18 and
65, who were Spanish speakers and did not report serious hearing problems. We consider a
valid Spanish speaker anyone with a C1 level, that is, anyone who can express themselves
fluently in the oral and written domain and can understand what they hear and read, even
if they are not familiar with a topic. They were recruited through email announcements,
social media communications and printed posters distributed around the University cam-
pus. An economical compensation of 10 USD per experiment participation was offered,
which was paid through the Testable platform (https://www.testable.org/ (accessed on 31
October 2022)).
Before starting the listening test, a short questionnaire asked a series of demographic
questions. Apart from registering their age, gender, nationality and language level, partici-
pants had to define their music sensitivity level by selecting one of the following categories:
• Non-musician—I don’t know how to read or play music/I rarely spend time listening
to music.
• Music enthusiasts—I don’t know how to read or play music, but I am a music enthusi-
ast. Hence, I listen to music often and I go to live music concerts.
• Amateur musician—I know how to read and play music (I play, at least, one musical
instrument) and I enjoy listening to music, as well as going to live music concerts.
However, I did not pursue professional studies.
• Intermediate musician—I play, at least, one instrument and I have some music studies
background. Although, I do not earn enough money to consider myself a profes-
sional musician.
• Professional musician—I consider myself a professional musician, I can live from
music-related activities and/or I have pursued or am pursuing professional music
studies and I am able to play different instruments.
Until this point, we have presented the methodology common to both experiments.
In the upcoming subsections, we describe specific details of materials and methods applied
in each experiment separately.
2.2. Experiment 1
Experiment 1 Did you hear the music? wants to estimate the threshold limits of the
category barely audible. That is, to obtain a specific loudness dB level where humans
differentiate music from inaudible to barely audible, and from barely audible to audible.
We hypothesise that every participant has an upper and a lower threshold of the
barely audible category, and we can extrapolate an average general threshold level from
that. Additionally, the individual threshold may be influenced by our controlled variable
“music sensitivity”.
For this experiment, with the help of the source separation system demucs [13], we
separate the background music (music signal) from the specific content of the clips (e.g.,
voice, claps) (non-music signal). As the achieved separation with demucs is not always
perfect, only clips where music and speech+sounds are well separated are selected. Then,
we keep non-music signals as in the mixture and apply a linear increase (from −50 dB
to −15 dB) or decrease (from −15 dB to −50 dB) in volume progression to the music
signals. The experiment has two sections: ascending and descending, which are introduced
randomly to each subject.
The separated stimuli (sound-music) were normalised at −14 LUFS/1dB Peak, and the
volume progressions were applied afterwards. A volume calibration procedure was in-Int. J. Environ. Res. Public Health 2023, 20, 123 6 of 15
cluded at the beginning of the experiment to ensure good audibility throughout it. The cali-
bration consisted in listening to a reference sound, which was normalised at a lower level
(−40 LUFS/1dB Peak), extracted from an original TV scene, and had to adjust the device
volume to hear it very low. Participants received the instruction: “Listen to the reference
sound. Adjust the volume to hear it very low, without understanding what is said in it.
That is, you must have the feeling that something sounds very faintly, and without the
possibility of understanding it”.
Participants were presented with a chronometric task, where they were asked to press
the keyboard spacebar as soon as they started to hear music (in the ascending section) or
when they stopped hearing it (in the descending section). If participants did not press the
spacebar at any time it was assumed as a null response. Each section contains 24 clips of
10-second videos, of which four appeared twice in one block, and four others were repeated
in both blocks with opposed progression. We can estimate the SMR at which background
music becomes audible or inaudible according to the moment the key was pressed and the
volume progression (35 dB range), for each clip. Thus, the SMR level is not controlled by
the participant but by us. We expect to estimate a feasible barely audible threshold range
from this experiment.
2.2.1. Cleaning Data
Several criteria were pre-defined to indicate potentially bad-quality data and the need
to discard any suspicious data:
• High percentages of nulls (not answered threshold) in any of the sections of the
experiment;
• An inverse threshold range (that is, obtaining a higher threshold for the descending
section than for the ascending section), as we consider it not to be the logically expected
majority trend.
After screening the available data, additional cutoff criteria were added. Since, we
considered some music detections could happen right at the end of the clip, we set the
threshold detection at volume progression limit (i.e., −15 dB and −50 dB), plus one extra
second of reaction time (+3.5 dB):
• Subjects’ responses define a too-high threshold in the ascending section (Ath > −11.5 dB).
• Subjects’ responses define a too-low threshold in the descending section (Dth < −53.5 dB).
2.2.2. Participants
This experiment had 42 participants, of which 38 (male = 17, female = 21) were
considered valid participants. Participants were Spanish native speakers between 18
and 50 years old (mean = 24.32, median = 21.5), who mainly set the TV volume at 24
(approximately 58 dBA) and spent about 13 min completing the task. This time does not
include the introduction to the experiment nor the payment explanation at the end of the
experiment, which added about 10 min. Thus, in general, participants’ spent around 25 min
at the experiment site.
Moreover, the participants were positioned so that their ears were situated at an
average distance of 2.06 m from the TV. Furthermore, 42.1% of the participants consid-
ered themselves to be music enthusiasts, 23.7% of them music amateurs and 34.2% were
music professionals.
2.3. Experiment 2
Experiment (2) Perceiving the music wants to quantify the effects of listening conditions
or devices (headphones, a TV and computer speakers/loudspeakers) on the perception
and awareness of background music and, consequently, on the variability of the barely
audible threshold.
We hypothesise that headphones yield an easier detection of perceived background
music than the other conditions. Therefore, the barely audible threshold will be lower,Int. J. Environ. Res. Public Health 2023, 20, 123 7 of 15
and its range will be narrower in this condition. All the participants used the same devices
(headphones, TV and loudspeakers) and experienced all three conditions (same task).
Hence, this is a within-subjects experiment.
For this experiment, the stimuli were normalised at −14 LUFS/1 dB Peak and a
volume calibration procedure was included at the beginning of each listening condition.
The volume calibration instructions were the same as in Experiment 1.
The proposed task consists of a detection and forced-choice task, where a 10-second
clip of video appears, and participants must press the spacebar as soon as they detect
music in the clip. Thus, reaction time helps us draw threshold levels for each category
and listening condition. In other words, when a participant perceives music right at the
beginning, we can derive it is audible; if it takes more time, it is barely audible; and if there is
no reaction, the music can be considered inaudible.
However, the same stimuli cannot be shown in each listening condition as we would
expose participants to the same content three times and induce learning. Consequently, we
have three stimuli groups (A-B-C), of 24 clips each, which appear randomly, one for each
condition (which are randomly distributed). That is, there are nine testing conditions (three
auditory conditions per three stimuli groups).
At the end of the experiment, we include a subjective questionnaire about the hearing
conditions (with only three possible answers—the listening conditions):
• In which listening condition did you hear better?
• In which listening condition did you feel more comfortable with the task?
2.3.1. Participants
In this experiment, we had 60 participants. However, five participants were discarded
due to erratic behaviour and underrepresentation. Thus, we will observe the results of
55 participants (male = 25, female = 30), of which all of them, but 2, were Native-Spanish
speakers between 18 and 50 years old (mean = 23.2, median = 21.0).
Almost half of the participants (45.5%) considered themselves music enthusiasts, 18.2%
music amateurs, 18.2% intermediate musicians and 18.2% music professionals. Moreover,
participants’ ears were situated at an average distance of 2.06 m from the TV and 68 cm
from the computer speaker. Furthermore, at each condition, after the volume calibration,
participants slightly adjusted it to a subjectively comfortable level (the range of variation
was of 15 dB between listening conditions) (Table 1).
Table 1. Average and media volumes set by the participants.
Condition Headphones Loudspeakers TV
Device average volume 9.8 3.5 22.3
Device median volume 6 30 23
Median in dBA 43 48 57
Participants needed around 16 min to complete the experiment and spent 5 min on
average in each listening condition. This time does not include the introduction to the
experiment nor the payment explanation at the end of the experiment, which added about
10 min. Thus, in general, participants’ spent around 30 min at the experiment site.
Considering their perceptions during the experiment, on the one side, most partici-
pants recognised completing the task better with headphones (72.7%). Instead, 10.9% of the
participants agreed it was with loudspeakers and another 10.9% with the TV. Nonetheless,
5.5% of participants could not decide on the best condition.
On the other side, we asked about the perceived synchronicity between their keyboard
response and the moment when the music was heard or disappeared. Most of them indi-
cated they did not know when they answered (34.5%) while the others mostly responded
that they pressed the spacebar after (32.7%) or at the exact moment (29.1%) they recognised
the music.Int. J. Environ. Res. Public Health 2023, 20, 123 8 of 15
2.3.2. Criteria Audibility Classification
The classification of clips per category was done depending on the reaction time (RT)
when pressing the spacebar. After an observation of classification variability to establish
the threshold between the audible and barely audible categories, it was decided that if a
participant detected music within the 2 first seconds of the clip, it should be classified as
audible. Instead, if they needed more time to detect background music, it is classified as
barely audible, and if they did not press the bar at all it is classified as inaudible.
Clicks after the 11th second are considered misclassifications and the clips are assigned
to the inaudible category.
3. Results
3.1. Experiment 1
Experiment 1 aimed to estimate the thresholds of the barely audible category employing
exposure to a progressively ascending or descending volume in the background music.
The experiment was divided into two blocks: one for the ascending music level condition
and the other for the descending music level. From the first, we should estimate the upper
level of the category and, from the second, the lower level.
3.1.1. Average Threshold Level per Block
To calculate the average threshold level of each block, we took all the SMR classifica-
tions and obtained the average threshold level. For the ascending block, the mean was at
−23.29 dB, and the descending block was at −36.76 dB.
It is rational to obtain such separate averages as each block corresponds to two different
tasks: detecting background music without previous information (ascending) and having
previous information (descending).
A one-way ANOVA (Table A1) was performed to compare the effect of the average
threshold level obtained in each block. Our analysis revealed that there was a statistically
significant difference (F(1479, 101) = [1.645], p = 0.001), meaning that a higher volume is
required to detect music when not having any previous information, and a lower volume
when there is previous information. This discrepancy is what helps us define the barely
audible category threshold limits.
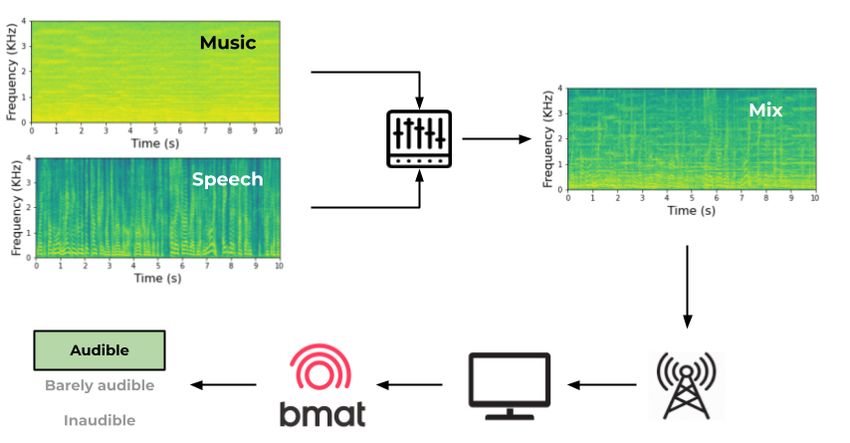
3.1.2. Barely Audible Category Threshold Estimation
To estimate the barely audible threshold range, we pursued the idea of observing the
overall threshold distributions on each block (Figure 2), and set the upper and lower limits
from the 75% percentile. With this approach, we obtained an upper limit at −18.79 dB,
from the ascending block, and a lower limit at −42.06 dB, from the descending. However,
we found this threshold range to be too wide and impractical to determine the barely
audible class.
Consequently, we decided to adopt a more conservative approach and base the limits
on the median, to reflect the distribution of SMRs. Therefore, we obtained a rounded
threshold of −22.7 dB to −36.4 dB (range = 13.7 dB, centre = −29.6 dB).Int. J. Environ. Res. Public Health 2023, 20, 123 9 of 15
(a)
(b)
Figure 2. Histogram representation of the obtained SMR levels (in dB). (a) Ascending block. (b) De-
scending block.
3.1.3. Influence of Music Sensitivity and Type of Video Content
To determine if there exists an influence of subjects’ music sensitivity on background
music detection, we performed a two-way ANOVA analysis on the obtained threshold
level per block and music sensitivity level. For more consistency, we grouped participants
into two categories: non-professionals (music enthusiasts and amateur musicians) and pro-
fessionals (intermediate musicians and professional musicians). In Appendix A, Table A2
reflects there is a significant difference between music sensitivity level and experiment
block (F(1, 1) = [1732.516], p = 0.000). Therefore, there is a clear influence of the music
professionality of the participants on the detected thresholds. The more exposed to the
music one is, the lower the background music detection threshold is found (Figure 3).Int. J. Environ. Res. Public Health 2023, 20, 123 10 of 15
Figure 3. Average threshold levels difference of music sensitivity.
Furthermore, the presented stimuli were classified into the following type of video
categories: advertisement (9), cooking show (1), documentary (5), news (4), reality show (1),
talk show (6), sports (2), culture (1), weather (1) and TV contest (10). For news videos or the
ones with someone talking constantly, a third of the participants expressed it was harder for
them to detect the music because they were distracted by the voice or it was complicated
to distinguish the music from the voice. Table 2 displays the average thresholds obtained
for each category, considering the experiment block. We performed a two-way ANOVA
analysis to evaluate the effect of each category on the determined threshold level, per block.
The test revealed that there is a statistically significant interaction between the type of
content (F(1, 9) = [17.775], p = 0.000).
Table 2. Mean threshold values per type of video and experiment block.
Type of Content Ascending Descending
Advertisement −25.00053 −37.83150
Cooking show −26.22300 −35.11954
Documentary −28.55084 −33.22362
News −21.12964 −36.85422
Reality show n.a. −37.07983
Sports n.a. −34.74023
Talk show −21.03549 −38.29974
TV contest −24.26186 −35.86748
Culture n.a. −42.69381
Weather −21.56692 n.a.
3.2. Experiment 2
Experiment 2 intended to investigate the potential influences of different listening
conditions: headphones, loudspeakers and TV. Therefore, the same task was performed in
each condition: pressing the spacebar as soon as the music was perceived.
3.2.1. Listening Condition Influence
To prove there is an effect of listening conditions on the speed of the keyboard response
(and hence on the audibility of the music), we performed a one-way ANOVA analysis
(Table A3). As we expected, there is a significant difference between the listening conditions
(F(2, 2413) = [14.399], p = 0.000). Nonetheless, Tukey’s HSD test for multiple comparisons
(Table A4) found that the mean value of listening conditions was not significantly different
between the TV and loudspeakers conditions (p = 0.219, 95% C.I. = [−99.656, 586.619]).Int. J. Environ. Res. Public Health 2023, 20, 123 11 of 15
Another relevant finding is that the smallest reaction time is obtained with headphones
whereas the highest corresponds to TV (Figure 4). According to the distance between the
TV and the subjects, the time required for the sound wave to travel from the source to the
human ear (max. 6 ms) is not large enough to justify the overall discrepancy.
Figure 4. Average reaction time per listening condition.
Moreover, taking into account that the order of the conditions were randomly pre-
sented to each participant, we conducted another two-way ANOVA analysis of the listening
sequences in perspective of the auditory conditions (as there is a significant difference
between them). No significant differences were found (F(2, 5) = [1.109], p = 0.351), which
guarantees that we can work with all the data together.
3.2.2. Reaction Time and Audibility Categorization
To estimate the classification of clips into a determined audibility category, we set the
threshold between the audible and barely audible classes at 2 s of reaction time. Regarding
the inaudible class, we established, (and instructed the participants accordingly) that no
interaction with the keyboard meant no music perception. In Figure 5, we can observe that
with headphones participants have a faster median RT. Instead, both loudspeakers and
TV conditions show a higher RT. We can acknowledge this difference for the barely audible
classification: close to 4 s in headphones and close to 5 s for the other two.
Figure 5. Median reaction time per listening condition and audibility category. There is no represen-
tation of the inaudible category as the reaction time is considered null.Int. J. Environ. Res. Public Health 2023, 20, 123 12 of 15
4. Discussion
The principal goal of this investigation was to explore and attempt to define the
barely audible music class in the context of broadcasted TV. That is, to bring light to the
grey area between perceptual audible and inaudible background music. Considering that
loudness is a subjective sensation and cannot be measured directly but must be done
through estimations, we proposed two psychoacoustic experiments to capture the essence
of “what is barely audible”. The introduced experiments validate that music perception is
influenced by multiple characteristics, three of them (SMR, musical training, and listening
conditions) have been analyzed herein.
From the first experiment, we estimated that the barely audible category could be
delimited by SMR values between −22.7 dB and −36.4 dB. Thus, it can be established that
if a SMR is higher than −22.7 dB, background music will generally be considered audible,
and if it is lower than −36.4 dB, it will be inaudible.
Nonetheless, perception does not depend solely on loudness level, and therefore we
explored different elements that could alter it. We detected an influence of music sensitivity
towards the awareness of background music, as music professionals presented a lower
detection threshold (−23.9 dB to −37.7 dB) in comparison to non-professionals (−22.0 dB
to −35.6 dB). Thus, the proposed threshold can be considered an optimistic estimation (and
that for the whole population will be slightly higher).
During our analysis, we observed music perception is influenced by the type of
audiovisual material the audience is processing. Therefore, it would be interesting to
have a wider and balanced representation of different program categories to extract robust
conclusions about perceptual differences due to the type of content, a consideration that
was not properly planned for when preparing these experiments.
Moreover, from Experiment 2, we derive a clear effect on listening conditions, es-
pecially when not using headphones (lowest inaudible classification threshold). Most
participants expressed that it was easier to detect music with headphones, which could
be due to their better frequency response (compared to the transducers used in the other
conditions, and also to the lack of room reverberation).
In summary, we have tackled the infrequently studied problem of the blurry and
labile limit between audibility and inaudibility. Our contributions improve, complement,
and expand the methodology and findings reported in the scarce existing literature on
it [11]. Here, we have estimated a range of SMR values that could define the thresholds
for a barely audible category. Our findings provide convergent validity to those reported
in that paper (−30 dB), but bear more ecological validity as we have used real-world TV
clips, tested different listening conditions (which cause the thresholds to shift), and have
demonstrated the important effect of listening sensitivity or musical training of the subjects
on such thresholds. Finally, we have proposed and effectively used alternative techniques
to experimentally address the problem.
5. Conclusions
This investigation provides a starting point for untangling background music per-
ception in broadcasted TV, focused on establishing orientative thresholds between the
three audibility categories set by WIPO: audible, barely audible and inaudible. Our approach
takes into account the ecological validity of the experimental tasks used to understand this
complex auditory scene analysis problem and centres on exploring data-driven definitions
of a threshold level for an a priori ill-defined barely audible class, in addition to determining
some of the influential elements on the three audibility categories.
We reported two psychoacoustic experiments, based on exploring the factors influ-
encing the perception of background music: signal loudness level and listening conditions
(headphones, loudspeakers, and TV set). From the obtained results, we proposed a thresh-
old range for the barely audible category considering the level differences between the
non-musical sound and the music, and proved that it is subject to the influence of the
listening conditions. Therefore, the proposed limit from the first experiment is only validInt. J. Environ. Res. Public Health 2023, 20, 123 13 of 15
for the TV condition. Moreover, we observed an effect of the music sensitivity level when
perceiving background music, as the more one is exposed to music, the lower the threshold
that one can detect the music. We hope this research draws attention to the need to further
study background music audibility estimation regarding broadcasted TV.
Author Contributions: Conceptualization, R.B.-R. and P.H.-B.; methodology, R.B.-R., P.H.-B. and
B.M.-C.; software, R.B.-R.; validation, R.B.-R. and P.H.-B.; formal analysis, R.B.-R. and P.H.-B.; investi-
gation, R.B.-R. and P.H.-B.; resources, R.B.-R.; data curation, R.B.-R. and B.M.-C.; writing—original
draft preparation, R.B.-R. and P.H.-B.; writing—review and editing, R.B.-R., P.H.-B., B.M.-C., E.M.
and X.S.; supervision, E.M. and X.S.; project administration, X.S.; funding acquisition, E.M. and X.S.
All authors have read and agreed to the published version of the manuscript.
Funding: This research was completed under task 1.3 of the “AI system for automatic audibility
estimation of background music in audiovisual productions” project, known as the LoudSense
project, funded by ACCIÓ INNOTEC-2020, with grant number ACE014/20/000051. This work is
partially supported by Musical AI—PID2019-111403GB-I00/AEI/10.13039/501100011033 funded by
the Spanish Ministerio de Ciencia, Innovación y Universidades (MCIU) and the Agencia Estatal de
Investigación (AEI).
Institutional Review Board Statement: The study was conducted in accordance with the Declaration
of Helsinki, and approved by the Ethics Committee of CIREP at Universitat Pompeu Fabra (approval
number: 216, date of approval: 10 September 2021).
Informed Consent Statement: Informed consent was obtained from all subjects involved in the study.
Data Availability Statement: The reported study materials and data can be found in https://github.
com/roserbatlle/loudsense (accessed on 31 October 2022).
Acknowledgments: We would like to thank all the participants who took part in the listening
experiments, for their collaboration and time. We are also grateful to the CBC (Center for Brain
and Cognition) research group at Universitat Pompeu Fabra for providing us with the Pavlovia
licence. These experiments were carried out under the task T1.3 of the project “AI system for auto-
matic audibility estimation of background music in audiovisual productions (LoudSense)”, financed
by INNOTEC-2020 d’ACCIÓ—Agència per la Competitivitat de l’Empresa de la Generalitat de
Catalunya, with file number ACE014/20/000051. This work was partially supported by Musical AI—
PID2019-111403GB-I00/AEI/10.13039/501100011033 funded by the Spanish Ministerio de Ciencia,
Innovación y Universidades (MCIU) and the Agencia Estatal de Investigación (AEI).
Conflicts of Interest: Blai Melendez Catalán and Emilio Molina declare that they are employees of
BMAT Music Innovators (BMAT Licensing, S.L.), a company involved in the monitoring of music
usage. Their work has been partially funded by ACCIÓ—Agency for Business Competitiveness,
within the LoudSense—AI system for automatic audibility estimation of background music in audio-
visual productions (ACE014/20/000051) project as part of the INNOTEC 2020 call. Roser Batlle-Roca,
Perfecto Herrera-Boyer and Xavier Serra declare that they are employees of the Music Technology
Group at Universitat Pompeu Fabra. Roser Batlle-Roca and Xavier Serra work has been partially
funded by ACCIÓ—Agency for Business Competitiveness, within the LoudSense—AI system for au-
tomatic audibility estimation of background music in audiovisual productions (ACE014/20/000051)
project as part of the INNOTEC 2020 call. Xavier Serra work is partially supported by Musical AI—
PID2019-111403GB-I00/AEI/10.13039/501100011033 funded by the Spanish Ministerio de Ciencia,
Innovación y Universidades (MCIU) and the Agencia Estatal de Investigación (AEI). The funders had
no role in the design of the study; in the collection, analyses, or interpretation of data; in the writing
manuscript; or in the decision to publish the results.Int. J. Environ. Res. Public Health 2023, 20, 123 14 of 15
Abbreviations
The following abbreviations are used in this manuscript:
BMAT Barcelona Music Audio Technologies
WIPO World Intellectual Property Organization
SGAE Sociedad General de Autores y Editores
SMR Sound-to-Music ratio
UPV Universitat Politècnica de València
CIREP Institutional Committee for Ethical Review of Projects
RT Reaction Time
USD United-States Dollars
LUFS Loudness units relative to full scale (EBU R 128)
SS Sum of Squares
df degrees of freedom
MS Mean Square
F F-test
Sig Significance
HSD Honestly Significant Difference
CI Confidence Interval
Appendix A
This appendix is used to include additional result tables to provide insight to our
statistical analysis.
Table A1. One-way ANOVA on average thresdhold level per block.
Source SS df MS F Sig
Interaction 71,718.993 1 71,718.993 1840.735 0.000
Within 61,521.249 1579 38.962
Total 133,240.241 1580
Table A2. Two-way ANOVA on the influece of music sensitivity per block.
Source Type III SS df MS F Sig Eta
Corrected Model 72,708.072 3 24,236.024 631.403 0.000 0.546
Intercept 1,325,914.095 1 1,325,914.095 34,543.063 0.000 0.956
MusicSensitivity Block 20.522 1 20.522 0.535 0.465 0.000
MusicSensitivity 967.956 1 967.956 25.217 0.000 0.016
Block 66,501.569 1 66,501.569 1732.516 0.000 0.523
Error 60,532.170 1577 38.384
Total 1,563,882.645 1581
Corrected Total 133,240.241 1580
Table A3. One-way ANOVA on listening conditions.
Source SS df MS F Sig.
Between groups 245,789,313.825 2 122,894,656.913 14.399 0.000
Within groups 20,595,133,416.946 2413 8,535,073.940
Total 20,840,922,730.771 2415Int. J. Environ. Res. Public Health 2023, 20, 123 15 of 15
Table A4. Tukey’s HSD test multiple comparisons on listening conditions.
95% Confidence Interval
(I) clipCondition (J) clipCondition Mean dif. (I-J) Std. Error Sig.
Lower Bound Upper Bound
loudspeakers −515.15290 * 146.36128 0.001 −858.3921 −171.9136
headphones
tv −758.63458 * 144.23791 0.000 −1096.8942 −420.3750
headphones 515.15290 * 146.36128 0.001 171.9136 858.3921
loudspeakers
tv −243.48168 146.31797 0.219 −586.6193 99.6560
headphones 758.63458 * 144.23791 0.000 420.3750 1096.8942
tv
loudspeakers 243.48168 146.31797 0.219 −99.6560 586.6193
* The mean difference is significant at the 0.05 level.
References
1. SGAE. SGAE Statement on the WIPO Arbitration Award Ending the Conflict of Night Time Slots on Television. 2017. Available
online: http://www.sgae.es/en-EN/SitePages/EstaPasandoDetalleActualidad.aspx?i=2190&s=5 (accessed on 21 August 2021).
2. Plack, C.J. The Sense of Hearing; Routledge: London, UK, 2013.
3. Bregman, A.S. Auditory Scene Analysis: The Perceptual Organization of Sound. 1990. Available online: https://direct.mit.edu/
books/book/3887/Auditory-Scene-AnalysisThe-Perceptual-Organization (accessed on 31 October 2022).
4. Sussman, E.S. Auditory scene analysis: An attention perspective. J. Speech Lang. Hear. Res. 2017, 60, 2989–3000. [CrossRef]
[PubMed]
5. Koreimann, S.; Gula, B.; Vitouch, O. Inattentional deafness in music. Psychol. Res. 2014, 78, 304–312. [CrossRef] [PubMed]
6. Molloy, K.; Griffiths, T.D.; Chait, M.; Lavie, N. Inattentional deafness: Visual load leads to time-specific suppression of auditory
evoked responses. J. Neurosci. 2015, 35, 16046–16054. [CrossRef] [PubMed]
7. Lavie, N. Distracted and confused?: Selective attention under load. Trends Cogn. Sci. 2005, 9, 75–82. [CrossRef] [PubMed]
8. Macdonald, J.S.; Lavie, N. Visual perceptual load induces inattentional deafness. Atten. Percept. Psychophys. 2011, 73, 1780–1789.
[CrossRef] [PubMed]
9. Raveh, D.; Lavie, N. Load-induced inattentional deafness. Atten. Percept. Psychophys. 2015, 77, 483–492. [CrossRef] [PubMed]
10. Hartson, R.; Pyla, P.S. Rigorous Empirical Evaluation: Preparation. In The UX Book; 2012; pp. 503–536. Available online:
https://www.sciencedirect.com/science/article/pii/B9780123852410000142?via%3Dihub (accessed on 31 October 2022).
11. López, J.J.; Ramallo, S. Study of the audibility of background music in TV programs: Towards a normative proposal. J. Audio Eng.
Soc. 2022. Available online: http://www.aes.org/e-lib/browse.cfm?elib=21722 (accessed on 31 October 2022).
12. Hennequin, R.; Khlif, A.; Voituret, F.; Moussallam, M. Spleeter: A Fast and State-of-the Art Music Source Separation Tool with
Pre-Trained Models. J. Open Source Softw. 2019, 5, 2154 [CrossRef]
13. Défossez, A.; Usunier, N.; Bottou, L.; Bach, F. Demucs: Deep Extractor for Music Sources with extra unlabeled data remixed.
arXiv 2019, arxiv:1909.01174. [CrossRef]
Disclaimer/Publisher’s Note: The statements, opinions and data contained in all publications are solely those of the individual
author(s) and contributor(s) and not of MDPI and/or the editor(s). MDPI and/or the editor(s) disclaim responsibility for any injury to
people or property resulting from any ideas, methods, instructions or products referred to in the content.You can also read