Toward Better Data Dashboards for US Drug Value Assessments
←
→
Page content transcription
If your browser does not render page correctly, please read the page content below
Policy Perspective
                      -                           Contents lists available at sciencedirect.com
                                                  Journal homepage: www.elsevier.com/locate/jval

Toward Better Data Dashboards for US Drug Value Assessments
Peter J. Neumann, ScD

          A B S T R A C T

          Objectives: To explore the use of data dashboards to convey information about a drug’s value, and reduce the need to collapse
          dimensions of value to a single measure.
          Methods: Review of the literature on US Drug Value Assessment Frameworks, and discussion of the value of data dashboards
          to improve the manner in which information on value is displayed.
          Results: The incremental cost per quality-adjusted life-year ratio is a useful starting point for conversation about a drug’s
          value, but it cannot reflect all of the elements of value about which different audiences care deeply. Data dashboards for drug
          value assessments can draw from other contexts. Decision makers should be presented with well-designed value dashboards
          containing various metrics, including conventional cost per quality-adjusted life-year ratios as well as measures of a drug’s
          impact on clinical and patient-centric outcomes, and on budgetary and distributional consequences, to convey a drug’s value
          along different dimensions.
          Conclusions: The advent of US drug value frameworks in health care has forced a concomitant effort to develop appropriate
          information displays. Researchers should formally test different formats and elements.

          Keywords: cost-effectiveness analysis, dashboards, drugs, Institute for Clinical and Economic Review, multicriteria decision
          analysis, pharmaceuticals, value assessment

          VALUE HEALTH. 2021; -(-):-–-

Introduction                                                                       pandemic. Behavioral scientists have studied how people process
                                                                                   information from dashboards, and researchers have issued best
    “Graphics are instruments for reasoning about quantitative                     practice guidelines for displaying information.
information,” observed data visualization pioneer Edward Tufte.1
Displays of data, he noted, should communicate complex ideas
with clarity, precision, balance, efficiency, and narrative quality.                Data Dashboards in Everyday Life
    US drug value assessments should draw from Tufte’s critique.
Decision makers should be presented with well-designed value                           Data dashboards are visualization tools conveying at-a-glance
“dashboards” containing various metrics—conventional cost per                      views of different measures or indicators.4 They assemble
quality-adjusted life-year (QALY) ratios and measures of a drug’s                  information in the form of numbers, tables, charts, symbols, and
impact on clinical and patient-centric outcomes and on                             colors and have been tailored to a wide range of applications.5
budgetary and distributional consequences—to convey the value                          The automobile dashboard with its assorted panels and dials is
of drugs along different dimensions. Such a display is consistent                  the prototypical example. Even as a driver operates a vehicle, they
with consensus guidelines for the field, which emphasize that                       can readily assimilate and respond to changing displays. The fuel
cost-effectiveness analyses provide 1 input into a complex and                     gauge indicates the tank is near empty. An illumination informs
multi-factorial decision-making process.2 Alongside cost-                          drivers a door is ajar. Some presentations are binary (eg, a warning
effectiveness, audiences consider legal, ethical, political, and                   light), whereas others are variable (eg, the speedometer). Some
practical questions as well as financial constraints and patients’                  displays are adjustable (drivers can set the trip odometer to
expectations.3                                                                     0 before a long excursion). An airplane’s cockpit instrument panel
    The question is how to assemble and efficiently display infor-                  is a more intricate version.6
mation on such varied dimensions. Drug value assessments can                           Consumer Reports has long presented dashboards in its reviews
draw from other contexts. Dashboards are omnipresent in our                        of goods, ranging from sport utility vehicles to dishwashers to
lives—on our phones and in our cars. We use them to inform                         blood pressure monitors. For each product, the display presents an
purchasing decisions and to track the coronavirus disease                          image and description and a table encapsulating features and

   1098-3015/$36.00 - see front matter Copyright ª 2021, ISPOR–The Professional Society for Health Economics and Outcomes Research. Published by Elsevier Inc.
2             VALUE IN HEALTH                                                                                                            - 2021

specifications, various indicators of product quality, and an overall        development costs, disease rarity, and population health. The
score. A summary table presents a side-by-side comparison of                Drug Abacus assesses a drug’s performance across each domain
different products across various attributes, including price. The          according to an algorithm, for example, novelty is scored as either
magazine employs recognizable icons—updated in 2016 from red                1 (“novel mechanism of action”), 0.5 (“known target but different
and black circles to a scale of red, yellow, and green arrows and           mechanism of targeting”), or 0 (“next in class”).22 Nevertheless,
lines to convey information about products’ strengths and weak-             the Drug Abacus seems to have achieved limited influence to date,
nesses.7 Consumer Reports reviews and issues reports about                  perhaps because its purview is limited to cancer drugs or because
prescription drugs—but for consumers not payers.8                           some factors are difficult to interpret.23
    Dashboards as visualization tools are widely used in clinical               The National Comprehensive Cancer Network (NCCN) has
settings, for example, in emergency and operating rooms to                  promoted its own Consumer Reports-like dashboard, in the form of
improve workflow management.9 Research has shown their                       “Evidence Blocks,” to inform oncologists and patients decisions
promise as decision support aids for clinicians considering                 about cancer treatments. The Evidence Blocks depict the value of
different treatment options10,11 and for patients judging the risks         cancer treatments across 5 domains—efficacy, safety, quality
and harms of prescription drugs.12 Vendors tout pharmacy visu-              and quantity of evidence, consistency of evidence, and afford-
alization and analytics platforms to help hospitals and payers              ability—with each domain assigned a level or weight by NCCN’s
manage drug costs and use.13,14 The US Centers for Medicare and             experts. For example, NCCN panel members assign an affordability
Medicaid Services maintains dashboards on use and spending                  level based on the overall cost of the regimen on a scale from 1
trends, including an interactive, web-based tool with prescription          (very expensive) to 5 (very inexpensive). Affordability is defined to
drug spending information (eg, on aggregate Part B and Part D               include treatment costs (“drug acquisition, administration, in-
drug spending per beneficiary).15 Some members of Congress have              patient vs out-patient care, supportive care, infusions, toxicity
proposed that Centers for Medicare and Medicaid Services provide            monitoring, antiemetics and growth factors, and potential for
expanded dashboards (eg, with information on beneficiaries’ out-             hospitalization”), although it excludes patient out-of-pocket costs
of-pocket payments and on top drugs and biologics by Medicare               or time lost from work.24 Research suggests that practicing on-
expenditures).16 The coronavirus disease pandemic has generated             cologists are generally aware of the Evidence Blocks and praise
an abundance of dashboards.17,18 The Johns Hopkins website is a             them for their ease of use in clinical settings, although the format
well-known example, with its maps, charts, and numerical                    has also been criticized—particularly the affordability component,
presentations of cases and deaths across countries and regions.19           which is based on expert opinion rather than actual drug or
Viewers can select different tabs to visualize different displays,          treatment costs and does not reflect patients’ own outlays.25–27
for example, of cumulative cases, active cases, incidence and                   The American Society of Clinical Oncology and the European
testing rates, and case-fatality ratios.                                    Society for Medical Oncologists have developed their own value
                                                                            framework methodologies to assign treatments a “net health
Information Displays for Economic Evaluation                                benefit” based on clinical trial data and other domains.28,29
                                                                            American Society of Clinical Oncology’s tool, however, compares
    The advent of US drug value frameworks in healthcare has                net health benefit with a drug’s monthly costs, rather than its
forced a concomitant effort to develop appropriate information              economic value or any considerations of patient’s own costs, and
displays. Without a framework, there is no standardized collection          seems to have gained little traction.23 The European Society for
of statistics, and, hence, no possibility of a standardized graphic         Medical Oncologists tool grades the magnitude of clinical benefit
presentation, that is, a dashboard.                                         of cancer therapies but excludes broader value considerations.
    Economists have advanced different approaches for conceptu-             Faster Cures and Avalere have promoted a “Patient-Perspective
alizing and presenting cost-effectiveness information, including            Value Framework,” which provides a checklist of several dozen
summary statistics (eg, incremental cost per QALY ratios, net mon-          “factors that matter to patients” (eg, functional and cognitive
etary benefit amounts) and representations of uncertainty in study           status, symptom relief, complexity of regimen, patient and family
results (eg, tornado diagrams, acceptability curves). The Second            costs), but the tool presents an itemized list, not a dashboard per
Panel on Cost-Effectiveness in Health and Medicine proposed an              se, and does not seem to be used with any regularity.30
“Impact Inventory” as a visualization tool for revealing whether an             Health economists have long called for economic evaluations to
economic evaluation included an intervention’s effects on different         present disaggregated clinical and economic metrics,2,31 and some
health and nonhealth consequences (eg, economic productivity,               have advocated explicitly for dashboards to inform priority-setting
social services, legal or criminal justice, education, housing, or the      exercises.32 For example, an evaluation of a program to improve the
environment).20 The Professional Society for Health Economics and           health of young children might consider, alongside conventional
Outcomes Research Special Task Force on US Drug Value Assessment            cost-effectiveness ratios, a display showing the impact of the
Frameworks developed a “value flower” to convey the idea that a              program on adolescent health along a range of indicators, such as
drug’s value may reflect novel elements (eg, reduction in uncer-             anthropometric measures (distribution of height, weight, body
tainty, fear of contagion, insurance value, severity of disease, value of   mass index) and learning and cognitive outcomes (scores on
hope, real option value, equity, and scientific spillovers) that are not     internationally     recognized     reading      and     mathematics
typically considered in cost-effectiveness analyses.21 Although the         examinations).33,34
value flower is a static graphic to illustrate the idea that value               Economists have also explored ways to incorporate and display
consists of multiple elements, it suggests the need for a dashboard to      the distributional consequences of alternative investments.32
display such elements.                                                      “Extended cost-effectiveness analyses” add measures of
    The field has also experimented with dashboards. An example              financial-risk protection (eg, percentage of households averting
is the Drug Abacus, developed at New York City’s Memorial Sloan             catastrophic health-expenditure thresholds or a money metric of
Kettering Cancer Center, which allows users to compare a cancer             the value of insurance provided) to traditional cost-effectiveness
drug’s dollar price with a dollarized value where that value is             ratios.32,35 Thus, extended cost-effectiveness analyses provide a
calculated based on how a therapy scores across a series of                 dashboard of sorts, highlighting how much health and financial
domains: treatment efficacy, toxicity, novelty, research and                 risk protection a drug may produce. Two drugs may have similar
-- 3
Figure 1. Premera value matrix, 2009.
Category Factor Evaluation of Relevant Considerations
Research Question Strength of Evidence
Clinical Safety
Benefit Efficacy
Effectiveness
Cost- Base Case
Effectiveness High Estimate
Analysis Low Estimate
Ethical Issues
Societal Rare Disease No Yes ___% of the population has_____________
Values Unmet Need No Yes More effective
_______________________________________________________
Other Societal .
Considerations
Regulatory Issues None noted.
Pharmacy Budget Impact Medical Budget Impact
Budget
Base Case $X PMPM PMPM
Impact
High Estimate $Y PMPM PMPM
Analysis
Low Estimate $Z PMPM PMPM
Source: Watkins JB, Sullivan SD. Premera Blue Cross, Value Assessment Committee, September 2009
cost-effectiveness, for example, but 1 may provide better financial for base-case cost-effectiveness ratios and high and low esti-
risk protection to low-income and uninsured individuals.36,37 mates). It also considers “societal values,” including a text box for
ethical issues and check-off items to denote whether the disease
in question is rare, whether there is an unmet need, and so forth.
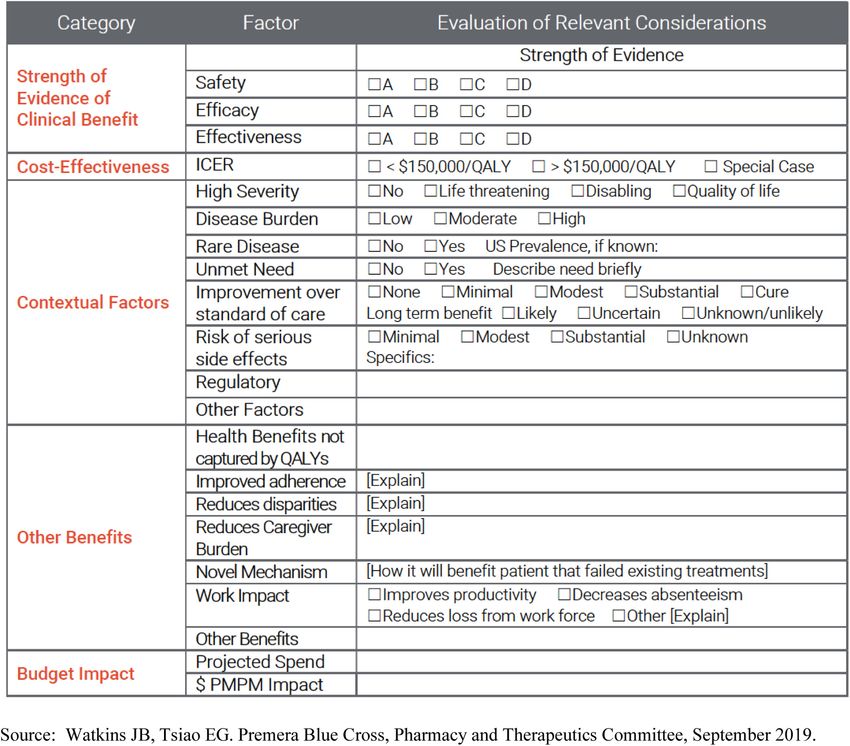
Evolving Better Models Finally, there is a field for budget-impact information. The revised
version (Fig. 2) expands the content with new fields on “contex-
Dashboards emphasize the importance of the visual display. By tual factors” (eg, disease severity) and “other benefits” (a drug’s
assembling information in a concise, standardized, and visually impact on adherence and one’s ability to work and whether health
appealing way, drug value dashboards can allow decision makers benefits are captured or not by QALYs). The updated display is
to efficiently scan an array of attributes and metrics on a drug’s streamlined with cleaner lines and an economy of text. The open
value. They may be particularly suitable for the fragmented text field “ethical issues” is replaced with drop down boxes. The
American healthcare system with its multitudes of payers. Criti- developers of the matrix emphasize that the value matrix con-
cally, dashboards would supplement and not replace the details of tinues to evolve and to consider alignment with the framework of
analyses, which would still be present in full reports and the Institute for Clinical and Economic Review (ICER) (John Wat-
appendices. kins and Sean Sullivan, personal communication, April 12, 2021).
The “value matrix” developed by Premera Blue Cross, a Indeed, Premera’s original matrix was developed independently
regional health plan primarily serving Washington and Alaska, from ICER and contributed to ICER’s own framework. Future
provides an excellent prototype and also illustrates how dash- versions might consider different fields and displays, including
boards can evolve. Figures 1 and 2 show subsequent versions of information on disaggregated clinical outcomes, other pre-
the matrix used to help the organization evaluate new drugs. The sentations on the uncertainty surrounding projections, informa-
first version (Fig. 1) provides information on a drug’s clinical tion about competitor products, and the potential to negotiate
benefit (with a letter grade) and cost-effectiveness (with displays outcomes agreements.4 VALUE IN HEALTH - 2021
Figure 2. Premera value matrix, 2019.
ICER reports also provide fertile testing ground. Although the an Impact Inventory). These are effective and necessary.
organization’s cost per QALY analyses and value-based prices on Nevertheless, they can also be supplemented by a summary
the basis of this metric attract the lion’s share of attention, the dashboard.
organization’s reports already contain various other metrics, Efforts to develop dashboards can also draw from the ongoing
including clinical ratings (with letter grades) and the votes of its work on multicriteria decision analysis (MCDA), which involves
advisory committee on a drug’s other benefits or disadvantages identifying relevant attributes, assigning weights to those attributes
and contextual considerations. ICER currently presents 2 types of corresponding to their importance, and calculating aggregate scores
cost-effectiveness ratios (incremental costs per QALYs and incre- to inform decisions consonant with the decision maker’s values.40
mental costs per equal value life-years gained).38 Perhaps the Methods for MCDA continue to advance, and policy makers have
addition to a dashboard of additional summary metrics, such as sometimes applied the technique in health technology assess-
“costs per healthy years in total,” would further enhance reports ments.40–44 In theory, the approach can inform drug value decisions,
and address concerns about discriminatory aspects of cost- such as which medications a health insurer should add to its for-
effectiveness analyses.39 ICER has presented “Reports at a mulary.40,45 In practice, applications of MCDA have proven chal-
Glance,” but these are text heavy and do not provide dashboards. lenging and remain mostly confined to research circles. Organizations
ICER reports also contain numerous detailed tables and figures such as the United Kingdom’s National Health Service and ICER have
covering various aspects of drug reviews (including data on a struggled when they have attempted to use the technique.46–48
treatment’s effectiveness and adverse events, key assumptions for Important work remains in identifying attributes, eliciting weights,
the cost-effectiveness analyses, various scenario analyses, and and combining the information from and across individuals.35,40,49-- 5
There are potential pitfalls and unintended consequences of doi: https://doi.org/10.1016/j.jval.2021.04.1287
dashboards. Summarizing complex concepts in a simple way Author Affiliations: Center for the Evaluation of Value and Risk in Health,
presents obvious challenges. It is unclear whether any given Tufts Medical Center, Boston, MA, USA (Neumann).
dashboard would improve decision making or muddle it. There is
Correspondence: Peter J. Neumann, ScD, Center for the Evaluation of
a strong need for experimentation. Formal testing of alternative
Value and Risk in Health, Tufts Medical Center, 35 Kneeland St, Boston, MA
displays of factors (eg, incremental cost-effectiveness ratios; key 02111, USA. Email: pneumann@tuftsmedicalcenter.org
clinical outcomes; short-term budget impacts; and indicators of
disease severity, risks, side effects, and patient convenience). Author Contributions: Concept and design: Neumann
Drafting of the manuscript: Neumann
Researchers should test user experience to improve the relevance,
Critical revision of the paper for important intellectual content: Neumann
efficiency, and usability of presentations, not only for different
domains of value but with different displays in terms of symbols, Conflict of Interest Disclosures: Dr Neumann reported being on the
charts, and spatial arrangements.4,9 The field needs more research advisory board for the Congressional Budget Office; receiving funds from
the Cost-Effectiveness Analysis Registry sponsors (the Cost-Effectiveness
on value perception and communication, similar to the
Analysis Registry has been funded by the National Science Foundation,
scholarship on risk perception and communication.12,21,50 National Library of Medicine, Agency for Healthcare Research and Quality,
The work should leverage natural tendencies in how people the Centers for Disease Control, and a variety of pharmaceutical and de-
process information.51,52 People are more likely to remember vice companies who subscribe to the data); receiving grants from Amgen,
images and symbols over text (the viewing capacity for shapes can Lundbeck, the Bill and Melinda Gates Foundation, the National Pharma-
exceed by 3-fold the capacity for text)51,52 and horizontal over ceutical Council, the Alzheimer’s Association, National Institutes of Health,
the PhRMA Foundation, and Arnold Ventures; and being on advisory
vertical displays (most languages are read from left to right).53
boards of Sarepta, Biogen, the PhRMA Foundation, Avexis, Intercept, Bayer,
Poor design of quantitative information display, either via image Amgen, Cytokinetics, Sanofi, and Panalogo outside the submitted work.
or text, can result in cognitive overload when the brain cannot
process what the eye is seeing because it is receiving more cues Funding/Support: This work was supported by the PhRMA Foundation
Center for Excellence in Value Assessment award to the Center for
than it can handle.52
Enhanced Value Assessment at the Center for the Evaluation of Value and
The way in which information is presented is important.54,55 Risk in Health at Tufts Medical Center.
Dashboards may benefit from a “z-shaped” layout, leveraging the
fact that viewers, such as readers who have learned to read from left Role of the Funder/Sponsor: The funder had no role in the design and
conduct of the study; collection, management, analysis, and interpretation
to right, view information from top left to top right and then bottom
of the data; preparation, review, or approval of the manuscript; and
left to the bottom right.54,56 If a color is used in 1 or more graphics, decision to submit the manuscript for publication.
the meaning of the color should not change, for example, Consumer
Reports always uses green to signal a desirable outcome. Graphics Acknowledgment: I am grateful to Joshua Cohen, David Kim, Dan Ollen-
dorf, and Meghan Podolsky for comments on earlier versions of the
should eliminate “chart clutter”—unnecessary or distracting visual
manuscript and to Meghan Podolsky and Marlena Keisler for research
elements in graphs or images, excessive detail, or redundancies— assistance.
which can lead to cognitive overload, biases, and slow
processing.1,51,52,57,58,59,60 Baseball-box scores, weather maps, and
financial data have all evolved their own data-rich summary pre- REFERENCES
sentations, both conceptually sound and aesthetically appealing.1
1. Tufte E. The Visual Display of Quantitative Information. 2nd ed. Cheshire, CT:
Graphics Press; 2002.
2. Neumann PJ, Ganiats TG, Russell LB, Sanders GD, Siegel JE, eds. Cost-Effec-
Conclusions tiveness in Health and Medicine. 2nd ed. Oxford, United Kingdom: Oxford
University Press; 2016.
3. Neumann PJ, Sanders GD. Cost-effectiveness analysis 2.0. N Engl J Med.
Everyone agrees that a drug’s value cannot be communicated in 2017;376(3):203–205.
1 number. The incremental cost per QALY ratio is a useful starting 4. Wikipedia. Dashboard (business). https://en.wikipedia.org/wiki/Dashboard_
point for conversation about value, but it cannot reflect all of the (business). Accessed March 3, 2021.
5. Wikipedia. Klipfolio dashboard. https://en.wikipedia.org/wiki/Klipfolio_
elements of value about which different audiences care deeply.
dashboard. Accessed March 3, 2021.
Value will always be a multidimensional concept and depend on 6. Wikipedia. Flight instruments: T arrangement. https://en.wikipedia.org/wiki/
context and stakeholder preferences. Although the field continues Flight_instruments#T_arrangement. Accessed March 3, 2021.
to make strides in exploring conceptual issues related to value, it 7. Consumer Reports. We put ourselves to the test. https://www.consu
merreports.org/consumer-reports/we-put-ourselves-to-the-test/. Accessed
should also consider lessons from graphical design. March 3, 2021.
Dashboards reduce the need to collapse dimensions of value to 8. Consumer Reports. CR Best Buy Drugs. https://www.consumerreports.org/
a single measure. Although they provide no guidance on how to drugs/consumer-reports-best-buy-drugs/. Accessed March 15, 2021.
9. Karami M, Langarizadeh M, Fatehi M. Evaluation of effective dashboards: key
combine the elements for value considerations, that is, what to do concepts and criteria. Open Med Inform J. 2017;11:52–57.
when some drugs rank higher on 1 metric than others,36 they can 10. Dolan JG, Veazie PJ, Russ AJ. Development and initial evaluation of a
summarize a drug’s impact on multifarious dimensions succinctly treatment decision dashboard. BMC Med Inform Decis Mak. 2013;13:51.
11. Dowding D, Randell R, Gardner P, et al. Dashboards for improving patient
and effectively. Drug value assessment would benefit from care; review of the literature. Int J Med Inform. 2015;84(2):87–100.
experimentation with different presentations to determine which 12. Schwartz LM, Woloshin S. The drug facts box: improving the communication
metrics and displays work best and for which audiences. of prescription drug information. Proc Natl Acad Sci U S A. 2013;110 Suppl
3(Suppl 3):14069–14074.
Researchers should formally test different formats and elements, 13. Agilum Healthcare Intelligence. Agilum Healthcare Intelligence launches
including cost-effectiveness ratios, patient-centered outcomes, POP-BUILDER RxTM, the first pharmacy-driven population health manage-
and distributional considerations. ment platform. Cision PR Newswire. https://www.prnewswire.com/news-
releases/agilum-healthcare-intelligence-launches-pop-builder-rx-the-first-p
harmacy-driven-population-health-management-platform-301086951.html;
July 1, 2020. Accessed March 3, 2021.
Article and Author Information 14. RxRevu. Right Drug. Right Price. Real-Time. https://rxrevu.com/. Accessed
March 3, 2021.
15. Centers for Medicare and Medicaid Services. CMS drug spending. https://
Accepted for Publication: April 23, 2021
www.cms.gov/Research-Statistics-Data-and-Systems/Statistics-Trends-and-
Published Online: xxxx Reports/Information-on-Prescription-Drugs. Accessed March 3, 2021.6 VALUE IN HEALTH - 2021
16. Congress.gov. S.2543 - Prescription Drug Pricing Reduction Act of 2019. https:// approach: an ISPOR Special Task Force report [5]. Value Health.
www.congress.gov/bill/116th-congress/senate-bill/2543/text. Accessed July 6, 2018;21(2):146–154.
2021. 37. Verguet S, Kim JJ, Jamison DT. Extended cost-effectiveness analysis for health
17. World Health Organization. WHO coronavirus (COVID-19) dashboard. policy assessment: a tutorial. Pharmacoeconomics. 2016;34(9):913–923.
https://covid19.who.int/. Accessed March 15, 2021. 38. Institute for Clinical and Economic Review. Cost-effectiveness, the QALY, and
18. Holder J. Tracking coronavirus vaccinations around the world. https://www. the evLYG. https://icer.org/our-approach/methods-process/cost-effectivenes
nytimes.com/interactive/2021/world/covid-vaccinations-tracker.html?actio s-the-qaly-and-the-evlyg/. Accessed March 3, 2021.
n=click&module=Spotlight&pgtype=Homepage. Accessed March 15, 2021. 39. Basu A, Carlson J, Veenstra D. Health years in total: a new health
19. Johns Hopkins Coronavirus Resource Center. COVID-19 dashboard. objective function for cost-effectiveness analysis. Value in Health.
coronavirus.jhu.edu/map.html. Accessed February 11, 2021. 2020;23(1):96–103.
20. Sanders GD, Neumann PJ, Basu A, et al. Recommendations for conduct, 40. Oliveira MD, Mataloto I, Kanavos P. Multi-criteria decision analysis for health
methodological practices, and reporting of cost-effectiveness analyses:second technology assessment: addressing methodological challenges to improve
panel on cost-effectiveness in health and medicine [published correction the state of the art. Eur J Health Econ. 2019;20(6):891–918.
appears in JAMA. 2016;316(18):1924]. JAMA. 2016;316(10):1093–1103. 41. Devlin N, Sussex J. Incorporating multiple criteria in HTA: methods and
21. Lakdawalla DN, Doshi JA, Garrison Jr LP, Phelps CE, Basu A, Danzon PM. processes. https://www.ohe.org/publications/incorporating-multiple-
Defining elements of value in health care - a health economics approach: an criteria-hta-methods-and-processes. Accessed July 6, 2021.
ISPOR Special Task Force report. Value Health. 2018;21(2):131–139. 42. Baltussen R, Niessen L. Priority setting of health interventions: the need for
22. Neumann PJ, Cohen JT. Measuring the value of prescription drugs. N Engl J multi-criteria decision analysis. Cost Eff Resour Alloc. 2006;4:14.
Med. 2015;373(27):2595–2597. 43. Goetghebeur MM, Wagner M, Khoury H, Levitt RJ, Erickson LJ, Rindress D.
23. Neumann PJ, Cohen JT, Ollendorf DA. The Right Price: A Value-Based Evidence and value: impact on DEcisionMaking–the EVIDEM framework and
Prescription for Drug Costs. Oxford, United Kingdom: Oxford University potential applications. BMC Health Serv Res. 2008;8:270.
Press; 2021. 44. Sculpher M, Claxton K, Pearson SD. Developing a value framework: the need
24. National Comprehensive Cancer Network. NCCN evidence blocks: frequently to reflect the opportunity costs of funding decisions. Value Health.
asked questions. https://www.nccn.org/guidelines/guidelines-with-evi 2017;20(2):234–239.
dence-blocks. Accessed July 6, 2021. 45. Basu A, Sullivan SD. Toward a hedonic value framework in health care. Value
25. Shah-Manek B, Wong W, Ravelo A, DiBonaventura M. Oncologists’ percep- Health. 2017;20(2):261–265.
tions of drug affordability using NCCN evidence blocks: results from a 46. Office of Fair Trading. The pharmaceutical price regulation scheme: an OFT
national survey. J Manag Care Spec Pharm. 2018;24(6):565–571. market study. https://webarchive.nationalarchives.gov.uk/20140402181205/
26. Cohen JT, Lin PJ, Sheinson DM, et al. Are national comprehensive cancer http:/www.oft.gov.uk/shared_oft/reports/comp_policy/oft885.pdf. Published
network evidence block affordability ratings representative of real-world February 2007. Accessed XXX.
costs? An evaluation of advanced non-small-cell lung cancer. J Oncol Pract. 47. Institute for Clinical and Economic Review. Nonpharmacologic interventions
2019;15(11):e948–e956. for treatment-resistant depression: supplementary data and analyses to the
27. Mitchell AP, Dey P, Ohn JA, Tabatabai SM, Curry MA, Bach PB. The accuracy comparative effectiveness review of the Agency for Healthcare Research and
and usefulness of the National Comprehensive Cancer Network Evidence Quality. https://icer.org/wp-content/uploads/2020/10/Final-Report-TRD_
Blocks affordability rating. Pharmacoeconomics. 2020;38(7):737–745. FINAL2.pdf. Accessed XXX.
28. Schnipper LE, Davidson NE, Wollins DS, et al. American Society of Clinical 48. Hawkes N. Drug pricing policies are falling apart messily. BMJ.
Oncology statement: a conceptual framework to assess the value of cancer 2013;346:f3624.
treatment options. J Clin Oncol. 2015;33(23):2563–2577. 49. Angelis A, Kanavos P, Phillips LD. ICER Value Framework 2020 update: rec-
29. Cherny NI, Sullivan R, Dafni U, et al. A standardised generic, validated ommendations on the aggregation of benefits and contextual considerations.
approach to stratify the magnitude of clinical benefit that can be antici- Value Health. 2020;23(8):1040–1048.
pated from anti-cancer therapies: the European Society for Medical 50. Lakdawalla DN, Phelps CE. Health technology assessment with risk aversion
Oncology Magnitude of Clinical Benefit Scale (ESMO-MCBS) [published in health [published correction appears in J Health Econ. 2021;78:102474].
correction appears in Ann Oncol. 2017;28(11):2901-2905]. Ann Oncol. J Health Econ. 2020;72:102346.
2015;26(8):1547–1573. 51. Schwabish JA. An economist’s guide to visualizing data. J Econ Perspect.
30. Avalere Health and FasterCures. Patient-Perspective Value Framework 2014;28(1):209–234.
(PPVF). https://www.phrma.org/-/media/Project/PhRMA/PhRMA-Org/PhRMA- 52. Tetlan L, Marschalek D. How humans process visual information: a focused
Org/PDF/A-C/Avalere_PPVF_Version_10_Methodology_Report_Final-1.pdf. primer for designing information. Visible Lang. 2016;50(3):65–88.
Accessed July 6, 2021. 53. Tufte E. Aesthetics and technique in data graphical design. The Vis Disp Quant
31. Mauskopf JA, Paul JE, Grant DM, Stercaghis A. The role of cost-consequence Inf. 1983.
analysis in healthcare decision-making. Pharmacoeconomics. 54. Firican G. Best practices for powerful dashboards. Business Intelligence Journal.
1998;13(3):277–288. 2017;22(2):33–39.
32. Verguet S, Jamison DT. Health policy analysis: applications of extended cost- 55. Ramly NN, Nor FM, Ahmad NH, Aziz MH. Comparative analysis on data
effectiveness analysis methodology in disease control priorities. In: visualization for operations dashboard. Int J Inf Educ Technol.
Jamison DT, Gelband H, Horton S, et al., eds. Disease Control Priorities: Improving 2012;2(4):287–290.
Health and Reducing Poverty. 3rd ed. Washington, DC: The World Bank; 2017. 56. Huang W, Eades P. How people read graphs. In: Proceedings from the Asia
33. GiveWell. A conversation with Dr. Dean Jamison. https://files.givewell.org/ Pacific Symposium on Information Visualisation (APVIS2005); January 27-29,
Q10 files/conversations/Dean_Jamison_01-09-17_(public).pdf. Accessed July 2005; Sydney, Australia. https://crpit.scem.westernsydney.edu.au/
6, 2021. confpapers/CRPITV45Huang.pdf. Accessed July 6, 2021.
34. Watkins KL, Bundy DAP, Jamison DT, Fink G, Georgiadis A. Evidence of impact 57. Hildon Z, Allwood D, Black N. Impact of format and content of visual display
of interventions on health and development during middle childhood and of data on comprehension, choice and preference: a systematic review. Int J
school age. In: Child and Adolescent Health and Development. 3rd ed. Wash- Qual Health Care. 2012;24(1):55–64.
ington, DC: The World Bank; 2017. 58. Ghazisaeidi M, Safdari R, Torabi M, Mirzaee M, Farzi J, Goodini A. Develop-
35. Verguet S, Laxminarayan R, Jamison DT. Universal public finance of tuber- ment of performance dashboards in healthcare sector: key practical issues.
culosis treatment in India: an extended cost-effectiveness analysis. Health Acta Inform Med. 2015;23(5):317–321.
Econ. 2015;24(3):318–332. 59. Shapiro J. 3 Ways data dashboards can mislead you. https://hbr.org/2017/
36. Phelps CE, Lakdawalla DN, Basu A, Drummond MF, Towse A, Danzon PM. 01/3-ways-data-dashboards-can-mislead-you. Accessed March 3, 2021.
Approaches to aggregation and decision making—a health economics 60. Everts J. The dashboard pandemic. Dialogues Hum Geogr. 2020;10(2):260–264.You can also read