Topic Modeling Based on Two-Step Flow Theory: Application to Tweets about Bitcoin
←
→
Page content transcription
If your browser does not render page correctly, please read the page content below
Topic Modeling Based on
                                        Two-Step Flow Theory:
                                        Application to Tweets about
                                        Bitcoin
                                        Aos Mulahuwaish∗ , Matthew Loucks∗ , Basheer Qolomany† , and Ala Al-Fuqaha‡
arXiv:2303.02032v1 [cs.SI] 3 Mar 2023

                                        ∗ Department of Computer Science and Information Systems, Saginaw Valley State University,
                                        University Center, USA
                                        † Cyber Systems Department, University of Nebraska at Kearney, Kearney, USA
                                        ‡ Information and Computing Technologies (ICT) Division, College of Science and Engineering (CSE),
                                        Hamad Bin Khalifa University, Doha, Qatar

                                        Abstract—Digital cryptocurrencies such as Bitcoin have exploded in recent years in both
                                        popularity and value. By their novelty, cryptocurrencies tend to be both volatile and highly
                                        speculative. The capricious nature of these coins is helped facilitated by social media networks
                                        such as Twitter. However, not everyone’s opinion matters equally, with most posts garnering little
                                        to no attention. Additionally, the majority of tweets are retweeted from popular posts. We must
                                        determine whose opinion matters and the difference between influential and non-influential
                                        users. This study separates these two groups and analyzes the differences between them. It
                                        uses Hypertext-induced Topic Selection (HITS) algorithm, which segregates the dataset based
                                        on influence. Topic modeling is then employed to uncover differences in each group’s speech
                                        types and what group may best represent the entire community. We found differences in
                                        language and interest between these two groups regarding Bitcoin and that the opinion leaders
                                        of Twitter are not aligned with the majority of users. There were 2559 opinion leaders (0.72% of
                                        users) who accounted for 80% of the authority and the majority (99.28%) users for the remaining
                                        20% out of a total of 355,139 users.

                                                                                           [1, 2, 3, 4, 5, 6]. These networks, however, can
                                        Index Terms: Network Analysis, Twitter,            comprise billions of users, with an unfathomable
                                        Machine Learning, Topic Modeling, Bitcoin.         number of connections between them. To run any
                                                                                           topic modeling or sentiment analysis algorithms
                                                                                           across the entire network would be extraordinarily
                                                                                           costly. This begs the question — would it be
                                           T HE INTRODUCTION Due to the virtual nature     possible to run topic modeling on a significantly
                                        of cryptocurrencies, much discussion occurs in     smaller subset of the network and still yield
                                        online forums or social media platforms such as    similar results? It has been well established that
                                        Twitter and Facebook. Places like this establish   authority, particularly on digital networks, tends
                                        the general public opinion of cryptocurrencies     to follow a Pareto distribution [7]. Additionally,
                                        and, consequently, to some extent, their price

                                        IT Professional
                                                                                                                                                1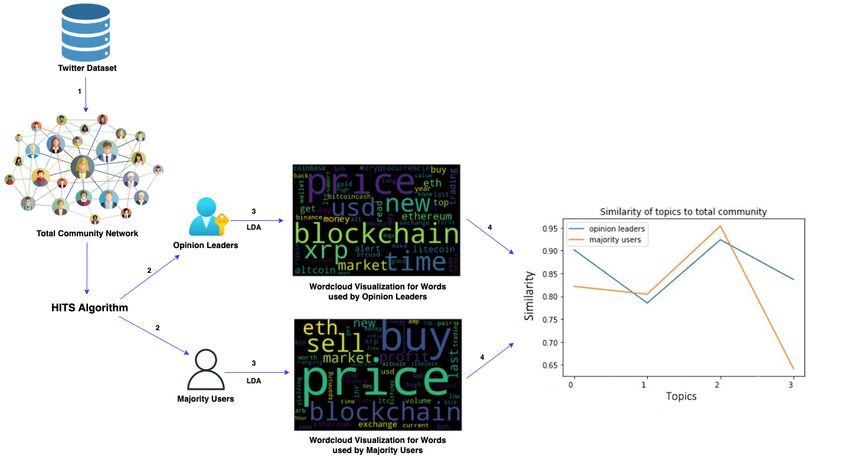
most users tend to mimic opinion leaders, par-           We have seen how famous public figures such
    ticularly on Twitter, where the built-in mech-           as Elon Musk have a tremendous capacity to
    anism of retweeting facilitates the replication          influence and even embody public opinion. Ad-
    of one’s opinions. By focusing on these hyper-           ditionally, given the difference in platform struc-
    concentrated authority centers on social media           ture, Twitter may be more susceptible to a few’s
    networks, it may be possible to use the opinion          opinions than other platforms. For these reasons,
    of the few to represent the entire community.            we seek to replicate this original study using a
        When lower-end media users follow active             Github fork and a few other modifications.
    media users who interpret the meaning of media               Also, in this paper, we used a different
    messages and content, these are known as opinion         methodology for topic modeling techniques and
    leaders. These leaders are generally held in high        the process in which a comparison is drawn
    esteem by those who accept their opinions. Opin-         between individual topics. In [10], the Non-
    ion leadership originated from the theory founded        negative Matrix Factorization (NMF) has been
    by Elihu Katz and Paul Lazarsfeld, where it              used, while in this paper, we utilized the La-
    is theorized that there is a two-step flow of            tent Dirichlet Allocation (LDA) due to its pop-
    communication [8]. Significant contributors to the       ularity and effectiveness in modeling the top-
    opinion leader concept include Berelson et al.           ics compared to the NMF. Additionally, in the
    [9]. The theory of opinion leadership is one of          [10], the Hungarian Algorithm (also called the
    the multiple models that attempt to explain the          Munkres assignment algorithm or Kuhn-Munkres
    diffusion of ideas, innovations, and commercial          algorithm) was employed to individually match
    products.                                                together the most closely related topics between
        Our research focused on analyzing the con-           opinion leaders and majority users. While in our
    structed network and finding the opinion leaders         paper, we reasoned, however, that not every topic
    on a large and broader Twitter dataset, as it            extracted from the first group would have a 1-1
    is more susceptible to a few’s opinions than             corresponding topic to the second group; thus,
    other platforms, analyzing the differences in lan-       the matching process would be redundant or,
    guage and interest between the opinion leaders           at the very least, unproductive. Thus, we only
    and majority users regarding Bitcoin, and finding        considered qualitatively whether or not the topics
    whether the opinion leaders of Twitter are not           from group to group were coherent. In addition,
    aligned with the majority of users, so that a            our methodology would be easily applicable to
    small number of highly influential users (opinion        various social networks, such as finding the ef-
    leaders) can effectively represent an entire com-        fectiveness of the influencers over social media
    munity’s opinions.                                       for various aspects of the real world, such as
        This paper does not consider the effects of          political sentiment, divisiveness, fashion trends,
    mimicry and the extent to which it exists within         music taste, or language changes.
    these networks. For instance, after an opinion               This study involves a few steps. In the first
    leader releases a tweet that corresponds to a            step, data is collected from Twitter using their
    specific topic, what is the precise effect on the        API and preprocessed; the network is constructed
    community? From speculation, we would expect             using comments and retweets. In the second
    those users following them to begin to mimic             step, the network is segregated into two different
    their opinions — though we do not know for               groups using Hyper-text-induced Topic Selection
    certain as our efforts were not focused on that          (HITS) [11]; these two groups are the opinion
    question.                                                leaders and the majority users. In the third step,
        This paper and its motivations were heavily          topic modeling is run on these two groups and
    influenced by a previous study by Kang et al. [10]       the entire community. Finally, in the fourth step,
    on a relative niche forum called bitcointalk.org.        we calculated the topic similarities between the
    Given the recent hype surrounding cryptocur-             two groups and the entire community to under-
    rency on mainstream social media platforms such          stand how well each constituent group represents
    as Twitter, it would be of great interest to replicate   the entire community. Figure 1 shows the steps
    this previous study on a larger, broader dataset.        conducted for our proposed analysis approach.

2                                                                                                  IT Professional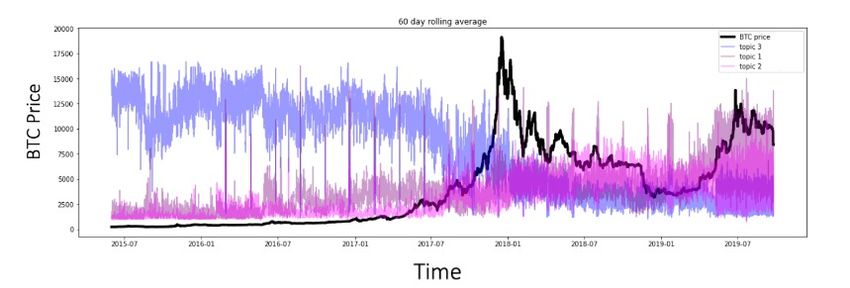
Figure 1. Steps of the proposed analysis approach.

    This paper is organized as follows. Section       events. The focus of this study was identifying
1 discusses related works. Section 2 presents         major cryptocurrency events and catastrophes in-
the data collection and preprocessing. Section 3      volving some sort of Ponzi scheme causing the
presents network construction and analysis. Sec-      market to crash. 30 was chosen for the number
tion 4 presents the topic of modeling. Section 5      of topics due to their semantic coherence score.
presents the results of the work.Section 6 presents   The dataset was obtained from scraping web data
the lessons learned. Finally, Section 7 provides      from bitcointalk.org, a cryptocurrency discussion
our conclusions.                                      forum. About 15 million posts were collected in
                                                      total (2012 through 2016). All data was scrapped
1. RELATED WORK                                       from a single cryptocurrency forum which most
    In this section, we will discuss some relevant,   likely exhibits a bias towards technologically
related works.                                        savvy miners with a vested interest in the technol-
    Within prior studies on user opinions in on-      ogy. No consideration was given to the influence
line discussion forums and price fluctuation, sen-    of more prominent Bitcoin community members.
timental and qualitative analyses were imple-             Abraham et al. [13] used sentiment analysis
mented. In addition, some of the said studies         to predict price changes in cryptocurrencies (like
focused on particular phases where cryptocur-         Bitcoin and Ethereum). VADER algorithm is used
rencies price rose. Multiple studies attempted to     to classify whether the text is positive or negative
investigate how cryptocurrencies, such as Bitcoin     and its polarity. The datasets used in this work
price, were associated with users’ feelings and       were collected from Google Trends and Twitter;
opinions by analyzing cryptocurrency forums.          as a result, there was no clear relationship be-
Some of these research works are the following:       tween the general sentiments of tweets and price.
    Linton et al. [12] used the LDA to see how        Most tweets regarding cryptocurrency tend to be
opinions are connected to large cryptocurrency        positive, and many papers use datasets in which

May/June 2019
                                                                                                             3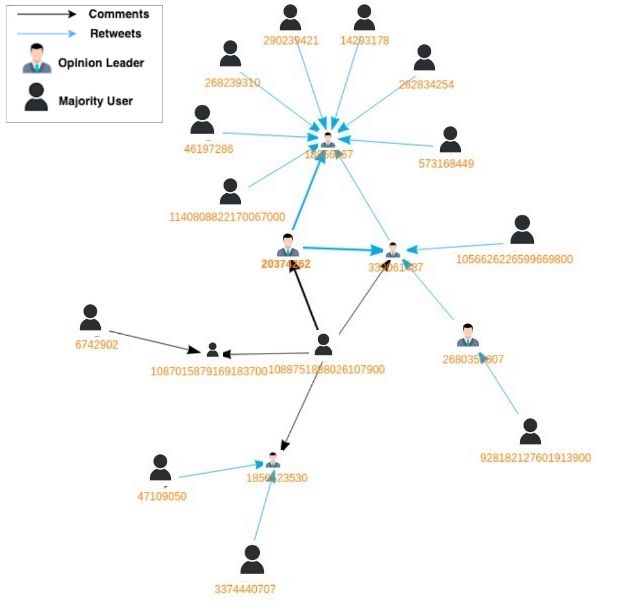
the price of crypto increases, resulting in a biased   15 topics total, with an R squared value of 0.28
    dataset.                                               in predicting bitcoin prices. The researchers also
        Rubio [14] shifted focus away from exclu-          found adding LDA topic weights as a feature in-
    sively Bitcoin and price to other cryptocurrencies     creases accuracy. Adding polarity and subjectivity
    and technical markers such as transaction speeds,      scores from sentiment analysis also improved the
    smart contracts, and privacy. The researcher gath-     R-value.
    ered tweets relating to over 25 top global cryp-            Bibi [17] used LDA to measure sentiment
    tocurrencies from May 2018 to August 2018,             towards cryptocurrency worldwide. The Twitter
    checked if a categorization fits well for a group,     dataset was used in this work; not much informa-
    detected prominent themes, and ran a prediction        tion was given regarding the dataset, algorithms,
    to see what would be used in the future, the           and methodology. As a result, Sweden and Den-
    LDA and MALLET algorithms were used in this            mark showed tremendously positive sentiment
    work. As a result, the coherence scores plateaued      towards cryptocurrency, with Canada and South
    at 18 topics, which gave a value of 18. The            Korea being the most negative.
    researcher then found the seven most common                 Kim et al. [18] analyzed the current user
    words per topic and visualized their frequencies       opinions from online forums in Massive Mul-
    in bar graphs. There were several themes between       tiplayer Online Games (MMOG) setting widely
    groups, including marketing, emotions, and group       used around the world. This led to the proposition
    relations.                                             of a method for predicting the next day’s fall
        Nizzoli et al. [15] present a chart of online      and rise of the currency used in an MMOG
    cryptocurrencies across multiple platforms such        environment. The prediction of the daily price
    as Twitter, Telegram, and Discord. They used a         fluctuations used in an MMOG environment was
    semi-supervised model to classify various social       found by analyzing online forum users’ opinions.
    media platforms. They checked how prevalent            The viability of predicting the fluctuation in the
    pump-and-dump and Ponzi schemes are in each            value of virtual currencies was shown by focusing
    bot activity and mapped their extent using a           on one of the most widely used MMOGs, the
    popular Twitter bot detection framework. The           World of Warcraft game.
    authors used the Twitter Streaming API to gather            Kim et al. [19] proposed a method founded on
    tweets from 3822 hashtags. They then searched          deep learning and established on user opinions on
    for additional Discord/Telegram links to crawl         online forums to predict the fluctuation in the Bit-
    and scrape more data from those platforms. In          coin price and transactions. This method is viable
    total, they had 50M messages from March to May         for understanding a variety of cryptocurrencies in
    2019. Data collected from Discord and Telegram         addition to Bitcoin and increasing the usability of
    was derived from Twitter, meaning any crypto           these cryptocurrencies.
    communities on those sites that do not have                 Additionally, multiple studies sought to iden-
    any Twitter presence would not be included. As         tify opinion leaders and/or find the main theme
    a result, Telegram showed to be replete with           and maximize their network marketing effec-
    cryptocurrency scams; 56% of crypto channels           tiveness by analyzing community networks and
    were fraudulent. Suspended ac-counts were also         users’ opinions. Some of these research works are
    much more likely to be involved with crypto            the following:
    manipulation.                                               Choi [20] examined how a piece of informa-
        Atashian and Hrachya [16] used the LDA             tion flowed in public forums that were social me-
    to construct a predictive model for Bitcoin us-        dia based, whether opinion leaders appeared from
    ing sentiment analysis, as the internet primar-        this flow of information, and the characteristics
    ily influences cryptocurrency. Data scraped from       that opinion leaders had in such forums. Two
    bitcointalk.org, a bitcoin forum, from April 23,       Twitter-based discussion groups focused on po-
    2011, to May 05, 2018. Used GDAX Python                litical discussions in South Korea were examined
    library to gather Bitcoin HOCV data from 2014          using network analysis and statistical measures,
    to 2018. Data was limited to niche esoteric cryp-      where it was concluded that opinion leaders were
    tocurrency forums. This work Built a model with        influential but not content creators.

4                                                                                                 IT Professional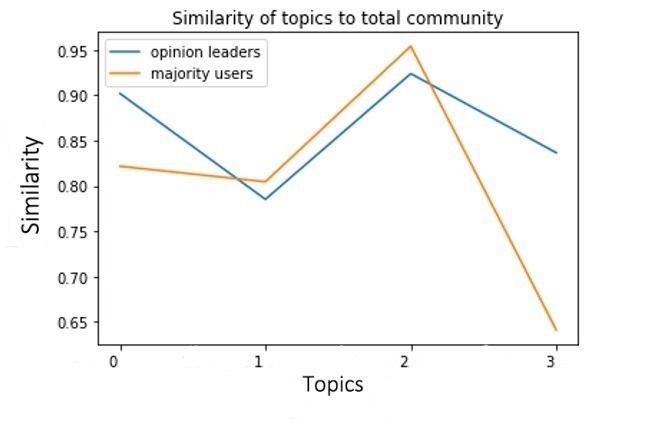
Ho et al. [21] proposed an efficient approach     agents. The results from this simulation con-
to identify the opinion leader from a group dis-      cluded that enhancing opinion leaders’ credibility
cussion without analyzing syntactic and semantic      is key to maximizing the influence power within
features (which can add additional computing          e-commerce.
effort). The researchers proposed algorithms that         In summary, from the literature review, a
evaluate the magnitude of participation and emo-      significant number of studies identified the opin-
tional expression during the speaking of each         ion leaders on the network or analyzed users’
group member during the discussion. A well-           sentiments on social media to predict the price
trained model was tested on the single dataset,       fluctuation of the cryptocurrencies (like Bitcoin);
and a cross-dataset was obtained to recognize the     these studies more likely used online materials
opinion leader. This testing showed an accuracy       to understand the fluctuation of Bitcoin prices
of 94.68% on the Berlin dataset, 76% on the           and the volume of transactions to determine any
YouTube dataset, and 73.33% on live discussion        relation. While in our research, we primarily
groups for identifying the opinion leader.            focused on using network analysis and analyzing
    Jiang et al. [22] designed a method for de-       divergent behaviors and interests between opinion
tecting an opinion leader based on an improved        leaders and other majority users to find opinion
PageRank algorithm. This improved algorithm           leaders. In contrast to some of the aforementioned
used link relevance to determine the degree of the    research works, our research did not emphasize
link between users. Data was crawled from on-         predicting prices or volumes using causality anal-
line communities and preprocessed, and then the       ysis between price and word frequencies.
weight matrix was constructed by calculating link
relevance between users. The improved PageRank        2. DATA COLLECTION AND
algorithm then ranked users and detected opinion      PREPROCESSING
leaders. Compared to the baselines, the results           We collected 8 million cryptocurrency-related
from this experiment showed that the proposed         tweets for more than 100k users, scrapped from
method effectively identified opinion leaders in      2016-01-01 to 2019-03-29, leveraging the Twitter
online communities.                                   standard search application programming inter-
    Wang et al. [23] proposed a TopicSimilar-         face (API) and Tweepy Python library. A set of
Rank algorithm for opinion leaders mining and         predefined search English keywords used such
interactive information based on the similarity of    as Bitcoin or BTC, cryptocurrency. We extracted
topics. This algorithm took into account text char-   and stored the text and metadata of the tweets,
acteristics and user attributions in microblogs.      such as timestamp, number of likes and retweets,
This built links between users formed on user         hashtags, language, and user profile information,
interaction information combined with topic sim-      including user id, username, user location, num-
ilarity to construct a directed-weighted network.     ber of followers, and number of friends. Figure 2
The idea of the vote in the PageRank algorithm        shows the data collection process. The first data
to mine opinion leaders were also considered in       collection phase is registering a Twitter applica-
this algorithm. Sina Weibo datasets were used for     tion and obtaining a Twitter access key and token.
testing this algorithm, and the results showed that   The second phase is to import the Tweepy Python
this algorithm had a better performance.              package and write the python script for accessing
    Zhao et al. [24] researched the influence         Twitter API. The third phase is connecting to
power of opinion leaders and the interaction          Twitter search API and retrieving tweets using
mechanism of a group of autonomous agents             some cryptocurrency-related keywords. The last
in an e-commerce community during forming             phase reads and processes the data to extract
group opinions. The social agents within a so-        information on tags, agents, and locations for net-
cial network were divided into two subgroups          work construction and analysis. From this dataset,
opinion leaders and opinion followers. A new          a subset of four million tweets was used. The
bounded confidence-based dynamic model for            specific break-down is as follows — 2,753,808
opinion leaders and followers was founded to          posts, 533,924 comments, and 37,460 retweets.
simulate the opinion evolution of the group of            Many modifications were made to the existing

May/June 2019
                                                                                                            5
dataset before it was fed to the topic modeling       fine relationships between pages. Hubs are highly
    algorithm. This process is crucial to ensure coher-   valued lists for a given query. An authoritative
    ent results at the topic modeling stage. All non-     page is one that many hubs link to, and a hub
    English words were stripped as well as links and      is a page that links to many authorities. We
    special characters. All text was lemmatized using     utilized the HITS algorithm to partition the total
    WordNet and stripped of any stop words using the      community network into two groups: majority
    natural language toolkit (NLTK) library and a few     users and opinion leaders. More specifically, this
    additional custom stop words [25]. All characters     was done using the authority score from the HITS
    were converted to lowercase. Additionally, words      algorithm, which effectively shows the influence
    with less than three characters and posts with less   on neighboring nodes. The authority of a given
    than five words were omitted.                         node is defined as the sum of the hub scores from
                                                          neighboring incoming nodes. The equations (1)
                                                          and (2) for both authority and hubs are shown
                                                          below:

                                                                                            X
                                                            Authority (vui ) =                          hub (vuj ),     (1)
                                                                                   vuj In(vu        )
                                                                                                i

                                                                              X
                                                            Hub (vui ) =                    authority (vuj ), (2)
                                                                           vuj Out(vu   )
                                                                                    i

                                                              We may define the authority of any given
                                                          node (vui ) as the sum of the hub scores from
                                                          the set of adjacent nodes with incoming connec-
                                                          tions. Similarly, the hub score of a node (vui )
                                                          is defined as the sum of authority scores from
                                                          the set of nodes with outgoing connections. In
    Figure 2. Process for collecting tweet data.          practice, nodes with high authority are referenced
                                                          frequently, and nodes with high hub scores link
                                                          to many high authority nodes. For this work, we
    3. NETWORK CONSTRUCTION AND                           will focus on the authority score.
    ANALYSIS                                                  We define the opinion leader group as nodes
        For each of our networks, a node u is added       whose authority sums to 80% when considering
    to the graph for each user if and only if they        the authorities of all users sorted in descending
    have a post. For instance, if a user makes a          order. All other users are then to be considered
    comment but has no posts, they are not given a        the majority. As mentioned above, self-loops were
    node. An edge V is drawn between two nodes            omitted as they do not offer meaningful infor-
    ui and uj if the user corresponding with node ui      mation about their relationship with other nodes.
    comments any post corresponding with node uj.         The content of retweets contained the text of
    If a user comments on their post, no edge will        the original tweet when fed through to the topic
    be drawn — in the context of graphs, no self-         modeling algorithm. As far as implementation is
    loops will be present. We did this because self-      concerned, we employed the Python NetworkX
    comments do not give significant insight into the     library to calculate the values for HITS. This
    relationship between other nodes and will thus        is the converging algorithm and thus only ends
    only serve to add noise. Following this procedure,    when convergence is reached or a predefined limit
    we constructed the entire community network.          is reached — in our case, we set the maximum
        Next, the HITS algorithm was used; the HITS       number of iterations to be 200.
    algorithm works as a search engine to rank pages,         The distribution of authority for the users
    and the algorithm uses hubs and authority to de-      in the network followed a Pareto distribution.

6                                                                                                            IT Professional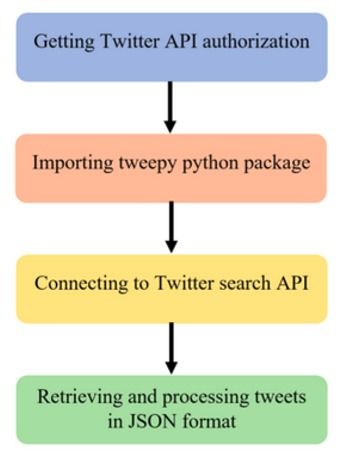
Figure 3. Graph of the distribution of authority (y-axis) sorted in descending order for both linear (A) and log
scale (B). This figure includes both opinion leaders and majority users.
The Pareto distribution, commonly referred to algorithm.
as the ”80/20” rule,” is commonly found in the Also, Figure 5 represents a subset of the entire
allocation of capital and this case, influence. From network. Vector graphics, such as a person wear-
this statistical observation, this work is based on ing a suit, show the nodes of the opinion leaders,
— most users hold little to no authority and thus while the other vector graphics show the nodes
have a negligible impact on the topics discussed of the majority users; the numbers represent the
on the network. This distribution can be seen account ID of each node. Black edges represent
as visualized in Figure 3 . This figure points comments, and blue edges represent retweets.
out the nature of the distribution of authority. This example shows that opinion leaders garner
We can see here that very few users possess the substantial attention from other users, much more
vast majority of the authority in this community. than most users.
Also, we can see from the graph that most users
have next to none. This distribution was plotted 4. TOPIC MODELING
using linear and logarithmic scales for Figure 3 Topic modeling is the process of deriving
(A) and (B). This figure plots the distribution of a statistical topic model from a collection of
authorities of users in descending order, where the documents. It is a machine learning technique
x-axis is simply the index of each user in the list. and is generally unsupervised. For example, topic
The y-axis represents the authority. There were modeling includes popular methods, including
2559 opinion leaders (0.72% of users) who ac- Latent Dirichlet Allocation (LDA) [27], Non-
counted for 80% of the authority and the majority negative Matrix Factorization (NMF) [28], and
(99.28%) users for the remaining 20% out of a Latent Semantic Analysis (LSA) [29]. In this
total of 355,139 users. These percentages were paper, we decided to utilize LDA, a probabilistic
found by dividing the number of users in each algorithm, due to its popularity and effectiveness.
subgroup by the total number of users. The theory behind topic modeling is that each
Additionally, we produced a network visual- document is comprised of a mixture of various
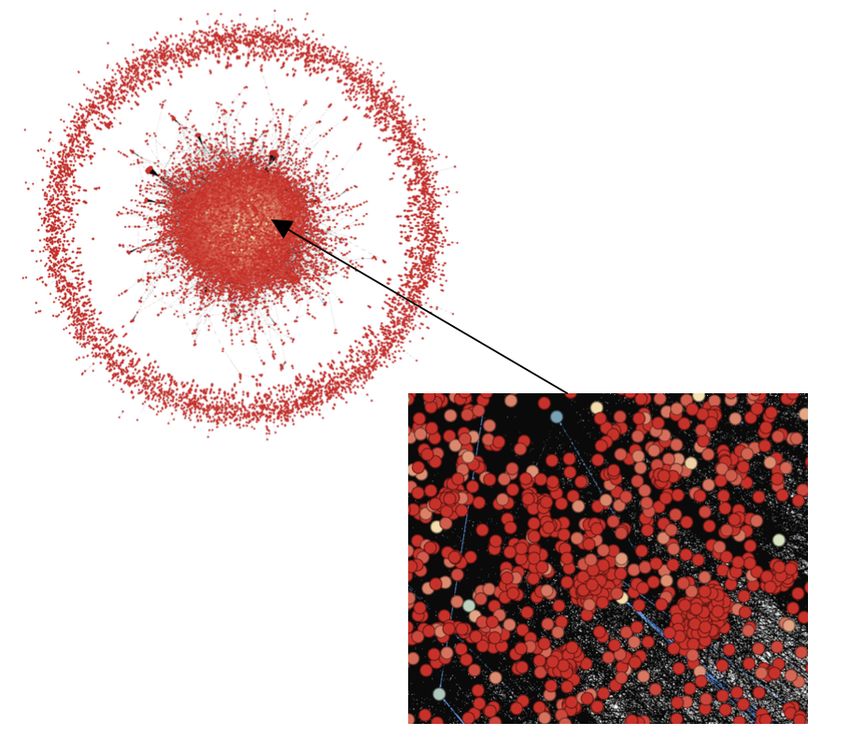
ization using Gephi software [26]. Figure 4 visu- topics; the number of the topics is a mixture of
alize the entire community network. Red nodes different words. By categorizing documents by
represent the majority of users, and blue nodes category, we can accurately and objectively group
represent opinion leaders. There is a gradient documents and gain the meaning behind them.
between the two based on authority scores. Black The LDA algorithm considers three hyperpa-
edges are comments, and blue edges are retweets. rameters: α, β , and K. The α hyperparameter
This was distributed using the ForceAtlas2 layout encodes the number of topics expected in each
May/June 2019
7Figure 4. Gephi visualization of complete network. This visualization helps illustrate the concentration of
authority, demonstrated by the tiny cluster of blue central nodes surrounded by connecting majority users.
Table 1. Word frequencies for the opinion leaders and the majority users. The relative difference column shows by a
factor how much larger the majority user percentage is than the opinion leaders.
Word Frequencies
Opinion Leaders Majority Users
price 0.85% 1.89% 1.22
buy 0.39% 1.52% 2.87
Market sell 0.19% 1.29% 5.74
profit 0.12% 1.14% 8.17
invest 0.04% 0.06% 0.53
core 0.07% 0.02% -0.70
miner 0.09% 0.04% -0.53
Technical network 0.16% 0.09% -0.46
node 0.09% 0.03% -0.67
protocol 0.05% 0.02% -0.67
document. The β hyperparameter lets it know outputs a distribution of topics of what each
the distribution of words for each topic in the document (tweet) is comprised of. We performed
document, and K defines the number of topics the LDA with a dataset of 3069704 tweets; the
to use. Picking an accurate K value is crucial dataset timeframe is from 2015-06-01 to 2019-
to an interpretable output from the algorithm. 09-25 (YYYY-MM-DD). Table 1 shows the dif-
Choosing a high value may result in an output ferences in the word frequencies between opinion
with topics with substantial overlap. Conversely, leaders and majority users.
a low K would generalize too strongly and place As we can see in Table 1, opinion leaders
most of the meaning behind a document into a generally concern themselves more with cryp-
smaller pool of topics. tocurrency’s technical aspects than the majority
of users, who seem to be more interested in the
5. RESULTS AND DISCUSSION price and profit. This result would make sense,
The topic modeling algorithm method, Latent as we would expect those with high levels of
Dirichlet Allocation (LDA), derives the topics authority to possess greater expertise in the more
from our corpus of text. The implementation of technical aspects of cryptocurrencies. The words
this algorithm is handled by the popular data in Table 1 are the most used in their respective
science package Scikit-learn [30]. This algorithm categories. Also, we may define market as words
8 IT Professionaldropped to -0.11. Finally, between January 2019
and May 2019, it went to -0.80. Topic 3 was
chosen as an example due to its high correlation
with the Bitcoin price. However, the other top-
ics followed this pattern as well. We observed
a general decline in correlation between topic
weights and the price of Bitcoin over time. This
may potentially be due to the rising shrewdness
of investors — as time goes on, investors may
become less amenable to a suggestion by social
media networks. Its mainstream adaption would
lessen the influence of the subset of users with
special technical knowledge.
The most important aspect of topic modeling
is choosing the correct K value, or the number of
topics to be selected. For this work, we opted
not to use any heuristic-based approaches that
utilize coherence scores and instead ran the model
on varying topics, including 12, 8, and 4. We
found the most interpretable results came from
the output using four topics due to the minimized
inter-topic similarity. Additionally, the human in-
Figure 5. A subset of a network illustrating the dy-
terpretability of each topic significantly improved
namics between opinion leaders. We can see from
upon lowering the number of topics.
this example that opinion leaders are generally only
After running LDA on the entire community,
hubs for other opinion leaders. Seldom is there an
opinion leaders, and majority users, we used
outgoing connection from an opinion leader to a ma-
the cosine difference to calculate the degree of
jority user.
similarity between the groups. This allows us to
numerically quantify the similarity between the
pertaining to the financial aspects of Bitcoin, such groups by treating the corpus of text for each
as profit or price. Technical words, on the other group as a word vector. A similarity score was
hand, are regarded as words pertaining to the calculated between the total community and opin-
internal working or function of Bitcoin itself as a ion leaders and between the total community and
technology. majority users. Given these similarities, we could
Figure 6 shows a graph of the Bitcoin price see which group was most similar to the total
graphed alongside a scaled version of the topic community and, thus, which one could represent
weights smoothed out with a 60-day rolling av- it more appropriately.
erage from the output of the total community Table 2 shows the output of the LDA algo-
LDA. Each document belongs to each topic to rithm for four topics for all three groups with
a certain extent — this is what the weight shows. the similarity scores. Additionally, Figure 7 shows
Each color represents one of three top topics and the graph of the similarities for each topic. From
runs from 2015 to 2019. The three topics are the graph, it is evident that the opinion leader
related to crypto, price, and trade, respectively. group’s similarity closely matches and surpasses
Each correlation contained a p-value and was cal- that of the majority user group. The similarity
culated using the Pearson R score. As we might of the opinion leaders to the entire community
expect, different epochs of time yielded stronger is greater than that of the majority of users.
correlations with a Bitcoin price. Between the Therefore, a small number of highly influential
period of December 2017 and April 2018, topic users (opinion leaders) can effectively represent
3 yielded a correlation of -0.14. Between April an entire community’s opinions.
2018 and August 2018, the correlation of topic 3 Table 3 shows the values for the similarities
May/June 2019
9Figure 6. Bitcoin price and topics vs. time, the x-axis represents the time, and the y-axis represents the price
of Bitcoin. The topic weights have been scaled to fit the graph instead of being on a 0-1 scale.
between the groups. Similarity scores for each with the assumption that there indeed exists some
topic have been calculated for both opinion lead- level of causality [32].
ers and majority users. The average score has In addition, if Twitter were to lose public
also been computed and is seen to be higher trust, the methodology in the paper would still
for the opinion leaders group, suggesting that, on be easily applicable to different social networks.
average, the opinion leader group bears greater Our approach to this problem is not incompatible
semblance to the entire community than the ma- with the structure of other networks — we could
jority of users. Thus, this result also shows that have easily applied this to Facebook, Instagram,
the opinion leaders are more able to represent the Reddit, etc., albeit with different results. Even if
entire community than the majority of users. Twitter were to meet its demise, we would expect
an equivalent to rise and fill its shoes. Our interest
From the above discussions, we may notice in Twitter, in particular, stems from its popularity
that regarding the connection between BTC price amongst crypto influencers and its unique retweet
and Tweets content, as with any matter con- mechanic. This makes it easier to differentiate
cerning correlation followed by a claim, it is between opinion leaders and majority users as
important first to ascertain that there is indeed there is a more stark dichotomy. If Twitter were
a causal relationship that is not the product of to disappear, these opinion leaders would simply
mere happenstance — for it could be the case find a different platform on which we could
that the price of Bitcoin correlates strongly with easily reproduce the paper. Furthermore, while
any number of arbitrary datasets, so, how is this the paper’s thesis (opinion leaders can effectively
dataset of Bitcoin-related tweets from Twitter represent majority users) only extends so far as
any different, we believe this topic has enough Twitter, replicating this study on other networks
merit to warrant a separate study. It is evident would confirm or disprove the thesis on a broader
that the influence of social media networks has level which would shed greater insights on differ-
tremendous potential to change markets. Look ences between these networks.
no further than the recent retail investor interest
in GameStop or the unbelievable overvaluation 6. Lessons learned
of Tesla to get a hint of how much the value We can conclude the following based on the
of some assets is driven by the current social results presented in this paper:
media [31]. Given Bitcoin’s speculative nature,
its popularity amongst young adults (the primary • According to the words shown in Table 1,
consumers of social media), and the sheer volume opinion leaders use more technical words than
of discussion that occurs about it online, we run the majority users, where the majority use
10 IT ProfessionalTable 2. LDA output for four topics for all three groups and similarity scores.
Topics Topics Keywords of Entire Topics Keywords of Opinion Opinion Topics Keywords of Majority Majority
Community Leaders Leaders Users Users
Similarity Similarity
Topic 0 bitcoin, price, usd, last, vol- bitcoin, price, doge, current, 0.90195 bitcoin, crypto, blockchain, 0.82172
ume, exchange, market, hour, day, year, crypto, dogecoin, cryptocurrency, ethereum,
min, pair, profit, current, bi- bcash, month, amp, time, read, new, money, exchange, news,
nance, arb, change, ranging, week, bch, market, since, hour, amp, get, mining, bank, world,
yielding, opps, spanning, eur first, buy, get, last, back, good, currency, time, free, project,
volume, high, transaction, ev- trading, cryptocurrencies,
ery, cryptocurrency, fee, eth, coin, future, ico, wallet,
new, low, hit, tweet, next, ago, make, litecoin, gold, eth,
ltc, bcashsv, block token, digital, network, know,
first, libra, good, payment,
transaction, great, binance,
facebook
Topic 1 bitcoin, crypto, money, new, bitcoin, xrp, ethereum, 0.78528 bitcoin, eth, price, xrp, ltc, 0.80462
get, cryptocurrency, year, time, blockchain, crypto, bch, volume, crypto, usd,
blockchain, amp, gold, make, time, litecoin, alert, cryptocurrency, ethereum,
know, day, world, good, future, cryptocurrencies, top, binance, hour, top, eos,
bank, currency, news cryptocurrency, bitcoincash, litecoin, last, ripple, market,
ltc, trading, eth, price, blockchain, change, trx, doge,
ripple, binance, last, bnb, etc, neo, sat, dash, ada,
daysnews, vaultmex, market, xlm, xmr, forecast, trading,
cryptocurrencymarket, fintech, bittrex, coin, average, link,
trx, altcoins, ico, buy, eos, news, eur, bitcoincash
altcoin, analysis, change,
paypal, news, cryptonews,
coinbase, newsoftheweek,
monero, skrill, usd
Topic 2 bitcoin, price, buy, sell, mar- bitcoin, usd, wallet, money, 0.92394 bitcoin, market, price, worth, 0.95417
ket, high, profit, worth, inr, get, gold, eth, price, coinbase, high, low, cap, crypto, trade,
current, low, crypto, btce, hardware, value, eur, make, last, btcusd, time, alt, usd,
cap, time, bitfinex, btcusd, ex- buy, amp, currency, altcoin, short, long, year, bull, next,
change, vircurex, analysis network, world, bank, know, day, bitmex, gmt, back, avg,
time, apompliano, fiat, smart, bcoin, whale, hit, chart,
work, year, mining, real, order, bullish, get, look, week,
coin, good, secure, new, better, bought, month, right, break,
trezor, bsv, crypto, asset, digi- change, trading, good, move
tal
Topic 3 bitcoin, crypto, blockchain, bitcoin, crypto, price, market, 0.83673 bitcoin, buy, sell, profit, price, 0.64126
cryptocurrency, eth, ethereum, cryptocurrency, read, news, bt- inr, current, exchange, last,
xrp, trading, ltc, bch, litecoin, cusd, blockchain, bull, alt, pair, min, ranging, arb, yield-
free, binance, top, amp, ico, new, bullish, support, trading, ing, opps, spanning, btce,
coin, ripple, join, cryptocur- long, next, time, exchange, bitfinex, vircurex, btcusd, in-
rencies short, chart, high, amp, resis- dia, buysellbitcoin, buysell-
tance, trader, back, future, usd, bitco, btceur, block, mtgox,
facebook, break, analyst, look, edt, cest, utc, alert, hitbtc, est,
move, newsoftheweek, libra, cet, market, instantly, campbx,
analysis, bear, level, investor, free, kraken, technical, trading
craig
Table 3. Average scores and topic similarities for opinion • From Figure 6, we can realize the correlation
leaders and majority users. between the topic weights and the price of Bit-
Group 0 1 2 3 Average coin decreased over time. This may be because
Opinion Leader 0.90 0.77 0.92 0.85 0.86 the investors become less interested in the
Majority Users 0.83 0.81 0.96 0.65 0.81
suggestions from the social media networks.
• We can see from Figure 7 that despite only
accounting for a minute segment of the entire
words related to Bitcoin prices and profits. It community, the opinion leaders possess an
implies that the opinion leaders would likely almost identical degree of similarity to the
have a deeper understanding and experience of entire community as the majority users. We
cryptocurrencies and Bitcoin. hypothesize that this is due to the influence
May/June 2019
11Figure 7. Graph of similarities to the total community for both opinion leaders (blue) and majority users
(orange), the x-axis represents the topics, and the y-axis represents the cosine similarity to the topics of the
entire community.
of the opinion leaders on the rest of the com- Given individual voices such as Musk can have
munity. This, coupled with Twitter’s retweet such a significant individual influence on the
feature, allows individuals’ voices to propagate price of Bitcoin; we may conclude that the
tremendously. composition of all such opinion leaders has
• Based on the average scores and topic sim- a causal influence. Because of this, it is our
ilarities shown in Table 3, we realized it is assumption then that the confluence of these
possible that a minuscule subset of a network powerful voices does indeed, to some extent,
may represent an entire community much more influence the price of Bitcoin — though, to
effectively than the majority users. be clear, it is not certain to what extent this
• The impact of any individual majority user causality reaches.
is so low to almost considered non-existent • Given what we have learned studying this
compared to the effectiveness of the opinion topic, it would be interesting to see future
leaders in the network. studies applying the implied results of this
• Measures of efficiency could improve certain paper. For instance, observing the opinion
analysis methods for user networks such as leaders of social media networks exclusively
Twitter by only concentrating on the most to observe their influence on various aspects
influential voices. of the real world, such as political sentiment,
• It is difficult to ascertain whether the price of divisiveness, fashion trends, music taste, or
Bitcoin drives tweets or tweets drive the price language changes. It would be our assumption
of Bitcoin. We know from isolated examples from the thesis of this paper that only the top
that tweets have the power to drive the price voices would be relevant to the influence of
of a cryptocurrency, with the most salient these domains. It would also be interesting to
examples being from figures such as Elon observe situations where this theory falls apart
Musk, who routinely manipulates cryptocur- — where the majority’s voice outweighs that
rency markets and, according to Ante [33], of opinion leaders. This dichotomy of opin-
“non-negative tweets from Musk lead to sig- ion leader and majority user has the potential
nificantly positive abnormal Bitcoin returns.” to provide an interesting lens through which
12 IT Professionalto view the direction of future trends, not 5. V. Marella, “Bitcoin: A social movement
necessarily the price of a certain commodity. under attack,” 2017.
With a better understanding of how these two 6. F. Reid and M. Harrigan, “An analysis of
groups color the public narrative, we can better anonymity in the bitcoin system,” in Security
understand what lies ahead. and privacy in social networks. Springer,
2013, pp. 197–223.
7. CONCLUSION 7. R. Koch, The 80/20 Principle: The Secret
This paper looked at the similarity between of Achieving More with Less: Updated 20th
opinion leaders and majority users regarding Bit- anniversary edition of the productivity and
coin on the social media platform Twitter. We business classic. Hachette UK, 2011.
conclude that a small number of highly influential 8. E. Katz and P. F. Lazarsfeld, Personal influ-
users can effectively represent an entire commu- ence: The part played by people in the flow
nity’s opinions. of mass communications. Routledge, 2017.
A more rigorous and deep-dive approach to 9. D. Riesman, N. Glazer, and R. Denney, “The
the number of topics employed would be of great lonely crowd,” in The Lonely Crowd. Yale
interest to improve upon this study. The results University Press, 2020.
of this study were settled subjectively and did not 10. K. Kang, J. Choo, and Y. Kim, “Whose opin-
incorporate any heuristic measures. Additionally, ion matters? analyzing relationships between
this study using specific languages or geographic bitcoin prices and user groups in online com-
locations may yield interesting results due to munity,” Social Science Computer Review,
cultural differences. vol. 38, no. 6, pp. 686–702, 2020.
Future research would benefit from a more 11. J. M. Kleinberg, “Authoritative sources in
rigorous form of topic-matching to ascertain a a hyperlinked environment,” Journal of the
more concrete comparison. Also, discovering a ACM (JACM), vol. 46, no. 5, pp. 604–632,
quantifiable degree of mimicry between opinion 1999.
leaders and majority users would be a great route 12. M. Linton, E. G. S. Teo, E. Bommes,
to pursue. We may also expect opinion leaders C. Chen, and W. K. Härdle, “Dynamic
to be influenced by their followers, following topic modelling for cryptocurrency commu-
collectivized mimicry. nity forums,” in Applied quantitative finance.
Springer, 2017, pp. 355–372.
REFERENCES 13. J. Abraham, D. Higdon, J. Nelson, and
1. S. Barber, X. Boyen, E. Shi, and E. Uzun, J. Ibarra, “Cryptocurrency price prediction
“Bitter to better—how to make bitcoin a using tweet volumes and sentiment analysis,”
better currency,” in International conference SMU Data Science Review, vol. 1, no. 3, p. 1,
on financial cryptography and data security. 2018.
Springer, 2012, pp. 399–414. 14. B. Rubio, “Analyzing cryptocurrency groups
2. R. Grinberg, “Bitcoin: An innovative alter- using topic modeling on twitter posts,” Mas-
native digital currency,” Hastings Science & ter’s thesis, 2019.
Technology Law Journal, vol. 4, p. 160, 2011. 15. L. Nizzoli, S. Tardelli, M. Avvenuti,
3. Y. B. Kim, J. G. Kim, W. Kim, J. H. Im, T. H. S. Cresci, M. Tesconi, and E. Ferrara,
Kim, S. J. Kang, and C. H. Kim, “Predicting “Charting the landscape of online
fluctuations in cryptocurrency transactions cryptocurrency manipulation,” IEEE Access,
based on user comments and replies,” PloS vol. 8, pp. 113 230–113 245, 2020.
one, vol. 11, no. 8, p. e0161197, 2016. 16. G. Atashian and H. Khachatryan, “Senti-
4. M. Kim, K. Kang, D. Park, J. Choo, and ment analysis to predict global cryptocur-
N. Elmqvist, “Topiclens: Efficient multi-level rency trends,” 2018.
visual topic exploration of large-scale docu- 17. S. Bibi, “Cryptocurrency world identification
ment collections,” IEEE transactions on vi- and public concerns detection via social me-
sualization and computer graphics, vol. 23, dia: student research abstract,” in Proceed-
no. 1, pp. 151–160, 2016.
May/June 2019
13ings of the 34th ACM/SIGAPP Symposium on pp. 361–362.
Applied Computing, 2019, pp. 550–552. 27. D. M. Blei, A. Y. Ng, and M. I. Jordan, “La-
18. Y. B. Kim, K. Kang, J. Choo, S. J. Kang, tent dirichlet allocation,” Journal of machine
T. Kim, J. Im, J.-H. Kim, and C. H. Kim, Learning research, vol. 3, no. Jan, pp. 993–
“Predicting the currency market in online 1022, 2003.
gaming via lexicon-based analysis on its on- 28. D. Lee and H. S. Seung, “Algorithms for
line forum,” Complexity, vol. 2017, 2017. non-negative matrix factorization,” Advances
19. Y. B. Kim, J. Lee, N. Park, J. Choo, J.-H. in neural information processing systems,
Kim, and C. H. Kim, “When bitcoin encoun- vol. 13, 2000.
ters information in an online forum: Using 29. T. K. Landauer, P. W. Foltz, and D. Laham,
text mining to analyse user opinions and “An introduction to latent semantic analysis,”
predict value fluctuation,” PloS one, vol. 12, Discourse processes, vol. 25, no. 2-3, pp.
no. 5, p. e0177630, 2017. 259–284, 1998.
20. S. Choi, “The two-step flow of communica- 30. F. Pedregosa, G. Varoquaux, A. Gramfort,
tion in twitter-based public forums,” Social V. Michel, B. Thirion, O. Grisel, M. Blondel,
science computer review, vol. 33, no. 6, pp. P. Prettenhofer, R. Weiss, V. Dubourg et al.,
696–711, 2015. “Scikit-learn: Machine learning in python,”
21. Y.-C. Ho, H.-M. Liu, H.-H. Hsu, C.-H. Lin, the Journal of machine Learning research,
Y.-H. Ho, and L.-J. Chen, “Automatic opin- vol. 12, pp. 2825–2830, 2011.
ion leader recognition in group discussions,” 31. J. E. Fisch, “Gamestop and the reemergence
in 2016 Conference on Technologies and of the retail investor,” U of Penn, Inst for Law
Applications of Artificial Intelligence (TAAI). & Econ Research Paper, no. 22-16, 2022.
IEEE, 2016, pp. 138–145. 32. A. Perrin, “Social media usage,” Pew re-
22. L. C. Jiang, F. F. Li, B. Ge, W. D. Xiao, search center, vol. 125, pp. 52–68, 2015.
J. Y. Tang, and Y. L. Hu, “Detecting opinion 33. L. Ante, “How elon musk’s twitter activity
leaders in online communities based on an moves cryptocurrency markets,” Technologi-
improved pagerank algorithm,” in Applied cal Forecasting and Social Change, vol. 186,
Mechanics and Materials, vol. 543. Trans p. 122112, 2023.
Tech Publ, 2014, pp. 3524–3527.
23. C. Wang, Y. J. Du, and M. W. Tang, “Opinion
ACKNOWLEDGMENT
leader mining algorithm in microblog plat-
This work was in part supported by Saginaw
form based on topic similarity,” in 2016 2nd
Valley State University.
IEEE International Conference on Computer
and Communications (ICCC). IEEE, 2016, Aos Mulahuwaish received a Ph.D. in computer
pp. 160–165. science from McMaster University, Hamilton, ON,
24. Y. Zhao, G. Kou, Y. Peng, and Y. Chen, Canada. He is currently an Assistant Professor in the
“Understanding influence power of opinion computer science and information systems depart-
leaders in e-commerce networks: An opinion ment at Saginaw Valley State University, MI, USA.
dynamics theory perspective,” Information His research interests include social media analytics,
Sciences, vol. 426, pp. 131–147, 2018. social cybersecurity, machine, and deep learning,
25. S. Bird, “Nltk: the natural language toolkit,” metaheuristics, and fault tolerance system. He is a
in Proceedings of the COLING/ACL 2006 member of IEEE and ACM.
Interactive Presentation Sessions, 2006, pp.
Matthew Loucks is an undergraduate student cur-
69–72.
rently studying computer science at Saginaw Valley
26. M. Bastian, S. Heymann, and M. Jacomy, State University. In his free time, he works as a
“Gephi: an open source software for explor- part-time software developer and participates in his
ing and manipulating networks,” in Proceed- school’s philosophy club. He enjoys reading, play-
ings of the international AAAI conference on ing piano, and going to the gym. After graduating,
web and social media, vol. 3, no. 1, 2009, Matthew is considering pursuing a master’s either in
computer science or artificial intelligence.
14 IT ProfessionalBasheer Qolomany [S’17-M’19] received the B.Sc.
and M.Sc. degrees in Computer Science from the
University of Mosul, Iraq, in 2008 and 2011, respec-
tively, and the Ph.D. and second master’s en-route
to Ph.D. degrees in Computer Science from Western
Michigan University (WMU), Kalamazoo, MI, USA, in
2018. He has worked as a Lecturer with the Depart-
ment of Computer Science, University of Duhok, Kur-
distan region of Iraq, from 2011 to 2013; a Graduate
Doctoral Assistant with the Department of Computer
Science, WMU, from 2016 to 2018; and a visiting
Assistant Professor at the Department of Computer
Science, Kennesaw State University (KSU), Marietta,
GA, USA, from 2018 to 2019. He is currently an Assis-
tant Professor with the Department of Cyber Systems,
University of Nebraska at Kearney (UNK), Kearney,
NE, USA. His research interests include evolutionary
computation, machine learning, deep learning, and
big data analytics in support of population health and
smart services. He is a member of IEEE and ACM.
Ala Al-Fuqaha [S’00-M’04-SM’09] received Ph.D. de-
gree in Computer Engineering and Networking from
the University of Missouri-Kansas City, Kansas City,
MO, USA, in 2004. He is currently a professor at
Hamad Bin Khalifa University (HBKU). His research
interests include the use of machine learning in
general and deep learning in particular in support
of the data-driven and self-driven management of
large-scale deployments of IoT and smart city infras-
tructure and services, Wireless Vehicular Networks
(VANETs), cooperation and spectrum access eti-
quette in cognitive radio networks, and management
and planning of software defined networks (SDN).
He is a senior member of the IEEE and an ABET
Program Evaluator (PEV). He serves on editorial
boards of multiple journals including IEEE Communi-
cations Letter and IEEE Network Magazine. He also
served as chair, co-chair, and technical program com-
mittee member of multiple international conferences
including IEEE VTC, IEEE Globecom, IEEE ICC, and
IWCMC.
May/June 2019
15You can also read