Tissue Doppler Derived Biphasic Velocities During the Pre and Post-Ejection Phases: Patterns, Concordance and Hemodynamic Signicance in Health ...
←
→
Page content transcription
If your browser does not render page correctly, please read the page content below
Tissue Doppler Derived Biphasic Velocities During
the Pre and Post-Ejection Phases: Patterns,
Concordance and Hemodynamic Significance in
Health and Disease
Alaa Mabrouk Salem Omar ( alaamomar2016@gmail.com )
Mount Sinai Morningside Hospital https://orcid.org/0000-0002-5184-9421
Diana Maria Ronderos Botero
BronxCare Health System
Javier Arreaza Caraballo
Mount Sinai Morningside Hospital
GaHee Kim
Mount Sinai Morningside Hospital
Yeraz Khachatoorian
Mount Sinai Morningside Hospital
Jaclyn Kliewer
Mount Sinai Morningside Hospital
Mohamed Ahmed Abdel Rahman
Mount Sinai Morningside Hospital
Osama Rifaie
Mount Sinai Morningside Hospital
Jonathan N Bella
BronxCare Health System
Edgar Argulian
Mount Sinai Morningside Hospital
Johanna Contreras
BronxCare Health System
Research Article
Keywords: heart failure, tissue Doppler imaging, pre-ejection, post-ejection
Posted Date: January 7th, 2022
DOI: https://doi.org/10.21203/rs.3.rs-1222157/v1
Page 1/21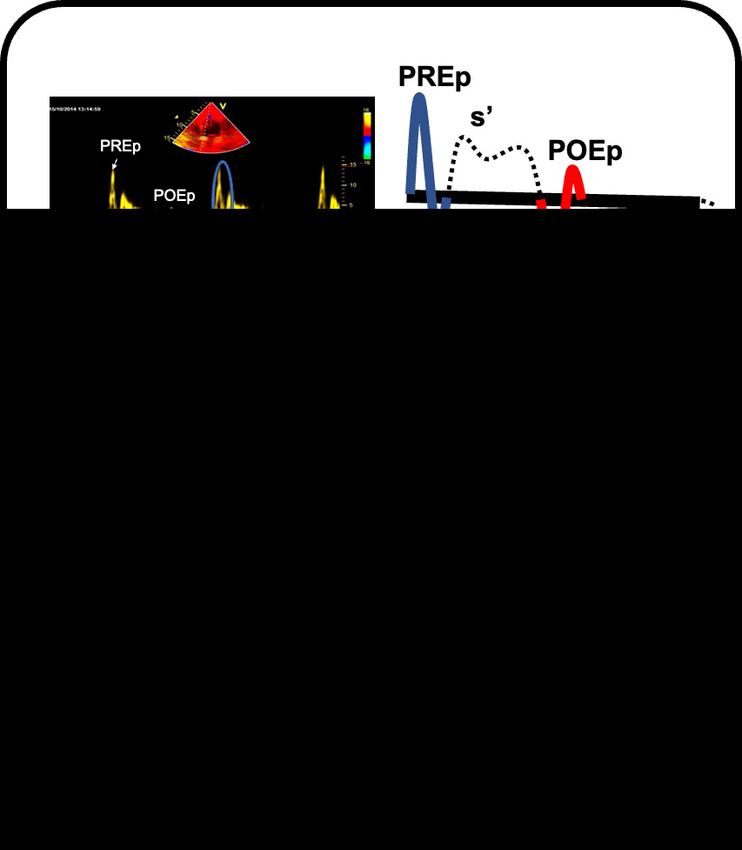
License: This work is licensed under a Creative Commons Attribution 4.0 International License.
Read Full License
Page 2/21Abstract Background Pre-(PRE) and post-ejection (POE) velocities by mitral annular tissue Doppler (TD) are biphasic and may be related to myocardial deformations. We investigated the predominance and concordance of TD-PRE and POE velocities and their effect on myocardial functions in controls and in HF patients. Methods Retrospectively, 84 HF patients [57.6 years, 28(33%) females, NYHA: 2.3±0.6, EF: 55±15%, 52(62%) preserved EF, and 32(38%) reduced EF], 42 normal young controls, and 26 asymptomatic age matched controls were included. Echocardiography was done and from mitral annular tissue Doppler recordings, the biphasic PRE and POE velocity signals were identified and compared between groups. Results While controls had almost always predominantly positive PRE and negative POE, HF had more negative PRE and positive POE. Moreover, almost all controls exhibited normal concordance (positive PRE and negative POE). HF exhibited more abnormal concordance which was significantly associated with worse NYHA, and parameters of diastolic and systolic functions. Opposite PRE and POE velocities correlated significantly in all groups (PREp vs POEn: young:r=0.52, p
HF2. Regardless of the type of classification, current models fail to encompass the mechanistic behaviors
of myocardial structure and function in health and disease. For instance, despite the intuitive separation
between systole and diastole as two consecutive phases of the cardiac cycle, it is impossible to separate
them functionally. Surprisingly, large lack of understanding exists for the pre-ejection and post-ejection
phases despite that these brief periods of the cardiac cycle are crucial for pressure buildup and loss that
are essential for systolic ejection and diastolic filling, respectively.

Velocities during pre-ejection (PRE) and post-ejection (POE) recorded by tissue Doppler imaging (TDI) of
the mitral annulus are biphasic. Several studies have shown that the positive velocity during PRE (PREp)
represents a less load independent state of myocardial contractility and is associated with clinical and
hemodynamic variables in patients with systolic dysfunction 3, 4. Moreover, we have recently reported that
PREp is associated with LV filling pressure in systolic dysfunction5 and in patients with mitral
regurgitation6. The biphasic nature of these velocities is, reportedly, related to myocardial deformation in
the form of endocardial shortening and epicardial stretch in the PRE and their reversal during the POE7.
These velocities and their expression in health and disease and their relationship to clinical and
hemodynamic profiles in HF patients have not been well studied. In the current study, we have aimed to
investigate the normal predominance of the biphasic velocities during PRE and POE phases and the PRE-
POE biphasic velocity concordance in normal controls and in patients with heart failure and the effects of
different concordance variations on myocardial functions in patients with HF.

Methods
In a retrospective study protocol, patients referred to the echocardiography laboratory with symptoms
suggestive of heart failure were included. In addition, normal young controls (age
average values were used for the final analyses. The pulsed-wave Doppler-derived transmitral velocity
and spectral tissue Doppler-derived mitral annular velocity were obtained from the apical 4-chamber view.
The early diastolic wave velocity (E) and the late diastolic atrial contraction wave velocity (A), were
measured using pulsed-wave Doppler recording, and the early diastolic mitral annular velocity (e’) and
systolic velocity (s’) were measured and averaged from the septal and lateral mitral annular positions.
The E/e´ ratio was calculated to assess LV filling pressure (LVFP) for all patients.

Pre and post-ejection tissue velocities: patterns, predominance and concordance

From the mitral annular tissue Doppler recordings, the biphasic pre-ejection (PRE) and post-ejection (POE)
velocity signals were identified (figure 1). PRE was identified as a positive signal (PREp) followed by a
negative signal (PREn) that preceded the ejection systolic velocity (s’). POE was identified as a negative
signal (POEn) followed by a positive signal (POEp) that was positioned between the ejection systolic
velocity (s’) and early diastolic velocity (e’). All positive and negative signals of both phases were
measured and averaged from the septal and lateral mitral annular positions. The ratio of both PRE and
POE velocities were obtained as chronologically occurring during the cardiac cycle as the former divided
by the later in the form of the positive to negative PRE (PRE-P/N), and negative to positive POE (POE-
N/P). The predominance of the biphasic PRE was defined as positive if PRE-P/N was > 1, and negative if
PRE-P/N was ≤1. The predominance of the biphasic POE was defined as negative if POE-N/P was > 1,
and positive if IR-N/P was ≤1. Next, the concordance of both biphasic velocities was defined as Normal if
PRE was predominantly positive and POE was predominantly negative, reversed PRE, if both velocities
were predominantly negative, reversed POE if both velocities were predominantly positive, and complete
reversal if PRE was predominantly negative and POE was predominantly positive.

Statistical methods:

Categorical data are presented as number (%), and were compared using chi square test. Continuous data
are presented as mean±SD. Data were tested for normality using Kolmogorov-Smirnov and Shapiro-Wilk
tests and, accordingly, continuous data were compared using t-test or analysis of variance (ANOVA) if
they are normally distributed or the Mann-Whitney U test if they are not normally distributed. The
correlations between different variables were done using the Pearson correlation coefficient. Cut of values
for prediction of E/e’ >13 were tested using receiver-operator-characteristic (ROC) curves. Reproducibly
analysis were done using interclass correlation coefficient and absolute differences for inter-observer and
intra-observer differences of repeated measures in 15 randomly selected patients. Differences were
considered statistically significant at p
tethering], Accordingly, the final study cohort consisted of 84 heart failure patients [age: 57.6±8 years,
28(33%) females, NYHA: 2.3±0.6, EF: 55±15%]. Of these, 52(62%) patients had HFpEF (EF: 65±5%), and
32(38%) patients had HFrEF (EF: 39±9%). In addition, 42 young normal subjects [age: 27±4 years, 5(12%)
females, EF: 66±5%], and 26 age matched controls [age: 53±12 years, 28(65%) females EF: 61±4.7%]
were included. Table 1 shows comparisons between all groups regarding baseline demographic clinical
and echocardiographic variables. Briefly, patients with HFpEF were the oldest and had more risk factors,
while patients with HFrEF had worse systolic and diastolic echocardiographic parameters.

Pre and Post-Ejection phases in patients and controls:

Table 1 summarizes comparisons between patients and controls for septal, lateral, and averaged mitral
annular velocities including pre-ejection (PRE) and post-ejection (POE) variables. It was found that,
patients with heart failure had lower PREp, and POEn, higher PREn and POEp, and lower ratios PRE-P/N
and POE-N/P compared to controls. Among heart failure patients, HFrEF tended to have lower PREp, and
POEn compared to HFpEF (PREp: 6.3±2.2 vs. 4.3±1.6, p
and reversed (2±1.2 and 2.3±0.6, respectively). Similar patterns were observed in parameters of diastolic
and systolic functions where the highest E/A and E/e’, the lowest average e’, the largest ESV and EDV and
the lowest EF were noted in reversed concordance, while all these parameters were noted to be best in
normal concordance and were intermediate between both groups in reversed PRE and POE. Importantly,
in heart failure patients, bundle branch block was not significantly different between groups, while
intraventricular conduction delay was most frequent in patients with totally reversed concordance (table
2). Moreover, electrocardiographic QRS duration was lowest in patients with normal concordance, larger
in patients with reversed concordance among which it was largest in patients with totally reversed
concordance (table 2).

Correlations for biphasic pre and post-ejection waves:

As suggested by the concordance of the biphasic waves, the main waves in the normal pattern were the
positively directed in PRE and negatively directed in POE. Correlations noted in our study between
different PRE and POE velocities are summarized in table 3 and Figure 3. When correlation was checked
between PREp and POEn it was found that both waves correlated significantly in all study subgroups,
while the correlations were stronger in normal and matched controls (0.52, 0.79, respectively, all p
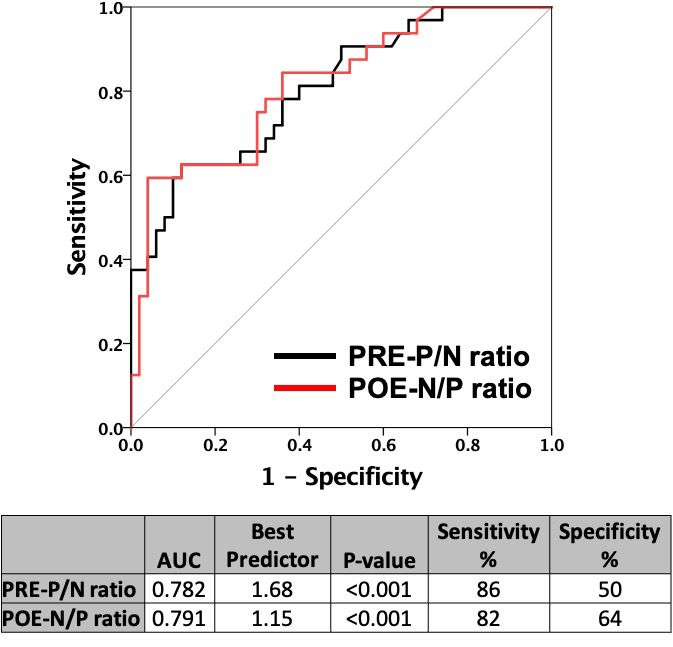
Receiver operator characteristic curves (figure 4) showed that the best predictors for E/e’>13 was PRE-P/N
≤1.68 (AUC:0.782, sensitivity: 86%, specificity 50%) while that for POE-N/P was ≤1.15 (AUC:0.791,
sensitivity: 82%, specificity 64%)

Reproducibility:

Reproducibility parameters are summarized in table 4. For inter-observer variability, the absolute
differences and interclass correlation coefficient for PREp were 0.03±0.93 cm/s, 0.94, respectively, for
PREn were 0.72±0.67 cm/s, 0.84, respectively, for POEn were -0.53±0.38 cm/s, 0.91, respectively, and for
POEp were 0.01±0.38 cm/s, 0.88, respectively. On the other hand, for intra-observer variability, the
absolute differences and interclass correlation coefficient for PREp were 0.11±0.57cm/s, 0.97,
respectively, for PREn were -0.22±0.45 cm/s, 0.93, respectively, for POEn were -0.17±0.31cm/s, 0.93,
respectively, and for POEp were 0.02±0.34 cm/s, 0.89, respectively.

Discussion
The main study findings are as follows: first, normally, tissue Doppler-derived biphasic signals are
predominantly positive during pre-ejection (PRE) phase and predominantly negative during post-ejection
(POE) phase. Second, normal concordance of both velocity signals (positive PRE and negative POE) is
associated with the best clinical, hemodynamic, and functional profiles in heart failure patients. Partially
reversed concordance (reversal of one of the velocity signals i.e. negative PRE and POE or positive PRE
and POE) occurs in heart failure patients (both HFpEF and HFrEF) and is associated with an intermediate
worsening of clinical and hemodynamic profiles. Completely reversed concordance (negative PRE and
positive POE) occurs mostly in patients with HFrEF and is characterized by the worst clinical,
hemodynamic, and functional profiles. Third, velocities of opposite directions during the pre-ejection and
post-ejection phases exhibit positive correlations, and seem to be related to the LV filling pressures as
expressed by E/e’ ratio.

Myocardial mechanics during the pre-ejection and its significance

The LV mechanical behavior during pre-ejection and post-ejection and its significance in health and
disease, is a complex and controversial topic. Several studies have focused on the TDI-derived biphasic
velocity during the pre-ejection period and linked it to myocardial mechanics, however, no definite
explanation exists regarding the TDI waveforms during POE.

Pre-ejection is traditionally biphasic 8, the first phase is referred to as electromechanical delay (EMD) and
is represented by the interval from the onset of the electrocardiographic QRS complex to mitral valve
closure (MVC), and the second phase is referred to as isovolumic contraction (IC) which follows MVC and
is characterized by a rapid increase in LV pressure before opening of the aortic valve. Recent studies have
shown that two opposing mechanical behavior occur during the pre-ejection phase: subendocardial
shortening exhibited during the first phase (EMD), accompanied by stretching of the subepicardial fibers
during the second phase (IC)9. Studies have shown that this mechanical behavior can be mirrored by the
                                                  Page 8/21
biphasic mitral annular TDI-derived velocities7, such that the positive component occurring during the
EMD corresponds to the active subendocardial shortening and the negative component occurring during
the IC corresponds to the passive subepicardial stretch. The significance of this complex mechanical
behavior is reportedly tightly related to efficient systolic ejection10. The predominance of the positive
component of the biphasic pre-ejection velocity in our study suggests that the prevailing and dominant
force of active shortening over the passive stretch functions resulting in a higher corresponding positive
over negative velocity. In our study, the reversal of this predominance (negative predominance of the PRE)
may suggest loss of the magnitude of the active shortening or a pathological prevalence of the stretch
force associated with heart failure which may explain the worse systolic and diastolic functions.
Myocardial mechanics during the post-ejection and its significance
Reportedly, the forces produced during pre-ejection are stored in memory within the myocardial wall until
the end of the ejection phase7, 11. Reversal of the shortening-lengthening relationship defines the
physiological onset of relaxation: it contributes to the rapid drop of the intra-ventricular pressure that
occurs during isovolumic relaxation and aids in the formation of suction forces during early diastole. In
our study, opposite TDI velocities of both pre-ejection and post-ejection phases correlated positively,
supporting the reversal of the shortening-stretch relationships from PRE into POE.
Importantly, the positive predominance of the PRE and the negative predominance of the POE suggests
that the magnitude of the active forces (shortening) during PRE and the magnitude of their release during
POE exceeds that exerted by the passive fiber stretch and its reversal and further suggest that the active
endocardial mechanics are the driving force in all isovolumic mechanical behavior over the passive
epicardial mechanics.
Concordance and its effect on myocardial mechanics and functions:
The coupling of normal predominance of both phases, noted in our study as the normal concordance
between both phases, was mostly found in normal young patients and in age matched controls.
Moreover, when such normal concordance was encountered in heart failure patients, it was associated
with the best clinical and hemodynamic profile. The loss of normal concordance was almost always
found in heart failure patients and was characterized by either reversal of one of both phases (partial
reversal) or reversal of both phases (complete reversal). The progression from normal concordance to
partially reversed and finally to completely reversed concordance in our study was associated with a
similar progression in severity of the clinical and hemodynamic profiles in heart failure patients.
Importantly, it was uncommon to have a reversed PRE without coupled reversal of the IR, while isolated
reversal of the POE was not uncommon. Partial reversal of the predominance of the biphasic velocities
may be due to failure of normal transmission of the pre-ejection forces (shortening-stretch) in memory
into the post-ejection phase which may lead to inappropriate diastolic behaviors (as noted in patients
with HFpEF) but may also affect systolic function to a certain degree. Complete reversal, on the other
Page 9/21hand, means complete disruption of the presumed PRE-POE relationships and may be due to faulty
generation of PRE forces and subsequent faulty transmission of these forces into the POE.
The mechanistic explanation of these changes lies in the fact that PRE-POE relationship are based on
myocardial electromechanical anisotropic coupling 12, 13. In normal physiological situations, the electrical
activation occurs in an endocardial to epicardial direction and begins subendocardially near the apical
septum and spreads rapidly toward the base. The rapid apico-basal spread of electrical activation within
the subendocardium initiates the contraction sequence. The onset of subendocardial shortening
coincides hemodynamically with an early rapid build-up of intraventricular pressure during the pre-
ejection period. Subepicardial deformation occurs later temporally coinciding with the onset of systolic
ejection. Importantly, this apico-basal wave of endocardial shortening aids in milking blood towards the
LV outflow and subsequently out of the ventricle during systole. Conversely, during repolarization,
transmural electrical gradients propagate in a base-to-apex direction. As such, mechanical coupling
during post-ejection (reversal of the shortening-lengthening forces) follows the same baso-apical
direction aiding in formation of suction pressure and early diastolic filling.
The timing and sequence of electrical excitation in the ventricles is influenced by the impulse propagating
through the His-Purkinje system and the anistropic nature of myocardium13. In patients with myocardial
disease, the disruption of electrical propagation of the depolarization and repolarization wave fronts and
their mechanical outcomes as a result of microscopic fibrosis or loss of gap junctions. In our study, this
hypothesis may be suggested by the fact the occurrence of intraventricular conduction delay was
associated with reversal of velocities especially with totally reversed concordance, and similarly, QRS
duration was prolonged the most in those patients. As such this electrical disruption may lead to faulty
initiation, and/or transition of mechanical forces between IC and IR and loss of mechanical coupling
expressed as the shortening-lengthening forces and thus may explain the functional and hemodynamic
outcomes of reversal of predominance and concordance of pre- and post-ejection velocities in our study
Limitations:
The study suffered from the following limitations: first, the sample size is small and larger studies should
be conducted before the findings can be adopted to clinical practice. Second, mitral annular velocities are
the result of the tethering of the fibrous structure of the mitral annulus, and as such represents only an
indirect measure of myocardial mechanics. Better representation of the myocardial mechanics can be
obtained using myocardial deformation imaging techniques such as speckle tracking echocardiography.
Strain rate imaging would be an appropriate alternative, however, due to the lower frame rate and higher
signal to noise ratio, deformations during PRE and POE can either be missed or recorded with high noise,
making it less reproducible than spectral tissue Doppler of the mitral annulus. Third, mitral annular
velocities represent mainly deformations in the longitudinal directions, however deformations during pre-
and post-ejection phases occur in all other directions of contraction, namely, circumferential, radial, as
well as rotational (twist). Further studies should focus and compare the relationships of deformation in
other directions of myocardial contraction in PRE and POE both in health and disease. Finally, the
Page 10/21relationships to systolic and diastolic functions lack invasive reference methods for comparison, further
studies should consider reproduction of the correlations observed against invasively measured
pressures.
Conclusions
Tissue Doppler-derived biphasic velocities during the pre- and post-ejection phases can be related to the
active endocardial shortening and passive epicardial stretch forces that occur during PRE and their
reversal during POE. In normal physiological state, biphasic signals are predominantly positive during
PRE and predominantly negative during POE highlighting the prevalence of the active endocardial
shortening over the passive epicardial stretch forces. A positive correlation between the opposite
velocities of PRE and POE represent the PRE-generation and POE-reversal of shortening-stretch
relationships, the attenuation of which may be related to elevated LV filling pressures in patients with
heart failure as expressed by E/e’ ratio. In heart failure patients, a normal concordance of both velocity
signals is associated with the best clinical, hemodynamic profiles, while partially reversed (either PRE or
POE), and completely reversed concordance are associated with progressive worsening of clinical,
hemodynamic profiles. Reversal of concordance can be explained by faulty generation and/or
propagation of shortening-stretch forces due to mechanical barriers such as fibrosis or electrical
abnormalities such as loss of gap junctions that occur in the myocardium of patients with heart failure.
Declarations
Ethics approval and consent to participate:
The study has been approved by the Mount Sinai Institute Review Committee (IRB), under study No.: 21-
01009
Consent for publication: N/A
Availability of data and materials: The datasets used and/or analysed during the current study are
available from the corresponding author on reasonable request.
Competing interests: None
Funding: None
Authors' contributions
Alaa Mabrouk Salem Omar: hypothesis generation, Data Collection, Statistical Analysis, Manuscript
Preparation, Publication
Diana Maria Ronderos Botero: Data Collection, Manuscript Preparation, Publication
Page 11/21Javier Arreaza Caraballo: Data Collection, Manuscript Preparation.
GaHee Kim: Data Collection, Manuscript Preparation.
Yeraz Khachatoorian: Data Collection, Manuscript Preparation.
Jaclyn Kliewer: Data Collection, Manuscript Preparation.
Mohamed Ahmed Abdel Rahman: hypothesis generation, Manuscript Preparation, Publication
Osama Rifaie: hypothesis generation, Statistical Analysis, Manuscript Preparation, Publication
Jonathan N Bella, MD: hypothesis generation, Manuscript Preparation, Supervision
Edgar Argulian: hypothesis generation, Manuscript Preparation, Supervision
Johanna Contreras: hypothesis generation, Manuscript Preparation, Supervision
Acknowledgements: None
Authors' information: None
Disclosures: All authors have nothing to disclose
References
1. Mosterd A and Hoes AW. Clinical epidemiology of heart failure. Heart. 2007;93:1137-46.
2. Omar AM, Bansal M and Sengupta PP. Advances in Echocardiographic Imaging in Heart Failure With
Reduced and Preserved Ejection Fraction. Circ Res. 2016;119:357-74.
3. Cho EJ, Caracciolo G, Khandheria BK, Steidley DE, Scott R, Abhayaratna WP, Chandrasekaran K and
Sengupta PP. Tissue Doppler image-derived measurements during isovolumic contraction predict
exercise capacity in patients with reduced left ventricular ejection fraction. JACC Cardiovasc
Imaging. 2010;3:1-9.
4. Lindqvist P, Waldenstrom A, Wikstrom G and Kazzam E. Potential use of isovolumic contraction
velocity in assessment of left ventricular contractility in man: A simultaneous pulsed Doppler tissue
imaging and cardiac catheterization study. Eur J Echocardiogr. 2007;8:252-8.
5. Salem Omar AM, Tanaka H, Matsumoto K, Tatsumi K, Miyoshi T, Hiraishi M, Tsuji T, Kaneko A, Ryo K,
Fukuda Y, Kawai H and Hirata K. Tissue Doppler imaging-derived myocardial acceleration during
isovolumetric contraction predicts pulmonary capillary wedge pressure in patients with reduced
ejection fraction. Circ J. 2012;76:1399-408.
6. Omar AM, Abdel-Rahman MA, Khorshid H, Helmy M, Raslan H and Rifaie O. Tissue Doppler-Derived
Myocardial Acceleration during Isovolumetric Contraction Predicts Pulmonary Capillary Wedge
Pressure in Patients with Significant Mitral Regurgitation. Ultrasound Med Biol. 2015;41:2108-18.
Page 12/217. Sengupta PP, Khandheria BK, Korinek J, Wang J and Belohlavek M. Biphasic tissue Doppler
waveforms during isovolumic phases are associated with asynchronous deformation of
subendocardial and subepicardial layers. J Appl Physiol (1985). 2005;99:1104-11.
8. Remme EW, Lyseggen E, Helle-Valle T, Opdahl A, Pettersen E, Vartdal T, Ragnarsson A, Ljosland M,
Ihlen H, Edvardsen T and Smiseth OA. Mechanisms of preejection and postejection velocity spikes in
left ventricular myocardium: interaction between wall deformation and valve events. Circulation.
2008;118:373-80.
9. Sengupta PP. Exploring left ventricular isovolumic shortening and stretch mechanics: "The heart has
its reasons...". JACC Cardiovasc Imaging. 2009;2:212-5.
10. Campbell KB and Chandra M. Functions of stretch activation in heart muscle. J Gen Physiol.
2006;127:89-94.
11. Sengupta PP, Khandheria BK, Korinek J, Wang J, Jahangir A, Seward JB and Belohlavek M. Apex-to-
base dispersion in regional timing of left ventricular shortening and lengthening. J Am Coll Cardiol.
2006;47:163-72.
12. Durrer D, van Dam RT, Freud GE, Janse MJ, Meijler FL and Arzbaecher RC. Total excitation of the
isolated human heart. Circulation. 1970;41:899-912.
13. Sengupta PP, Tondato F, Khandheria BK, Belohlavek M and Jahangir A. Electromechanical activation
sequence in normal heart. Heart Fail Clin. 2008;4:303-14.
Tables
Table 1: Baseline demographic, clinical and echocardiographic characteristics in heart failure patients as
well as normal and age matched controls
Page 13/21HFpEF HFrEF Normal Age matched p-value
Control
(n=52) (n=32) (n=42)
(n=26)
Age, years 58.1±8.2 56.7±8 27.3±3.95 53±11.474(cm/s) PREp (lateral), 5.7±2.5 4.1±1.4 6.8±1.8 7.5±2.4
PREp and     PREn and          PREp and      PREn and     p-value
                           POEn         POEn              POEp          POEp
                           (Normal,     (PRE              (POE          (Totally
                           n=96)        reversed,         reversed,     reversed,
                                        n=5)              n=31)         n=18)

Age, years                 46.7±15.4    53±17.9           57.4±6.92     58.9±9.6
RBBB, n(%)(**) 1(3%) 0(0%) 2(7%) 0(0%) 0.626 IVCD, n(%)(**) 0(0%) 0(0%) 1(3%) 3(18%) 0.041 *, p
PREp, positive pre-ejection, PREn, negative pre-ejection, POEn, negative post-ejection, POEp, positive post-
ejection

Table 4: Reproducibility analyses

                              Inter-observer variability        Intra-observer variability

                              ICC     p-value     Difference    ICC     p-value     Difference

              PREp, cm/s      0.94
Figure 1
Biphasic myocardial velocities during pre and post-ejection phases in controls and heart failure
patients. Upper panel: Tissue Doppler-derived as well schematic representation of tissue Doppler (TDI)-
derived mitral annular velocities in normal controls. In blue, the predominantly positive biphasic pre-
ejection (PRE), the positive component (PREp) predominates over the following negative component
(PREn). In red, the predominantly negative biphasic post-ejection (POE), the negative component (POEn)
Page 19/21predominates over the following positive component (POEp). Lower panel, representation of different
concordance of isovolumic phases in heart failure patients, from left to right, normal concordance,
predominantly positive PRE and predominantly negative POE, reversed PRE concordance, predominantly
negative PRE and POE, reversed POE concordance, predominantly positive PRE and POE, totally reversed
concordance, predominantly negative PRE and predominantly positive POE.
Figure 2
Frequency of predominance of biphasic tissue Doppler mitral annular velocities during pre (PRE) and
post-ejection (POE) phases, and their concordance. Upper panel, in normal as well as age matched
controls, PRE is almost always predominantly positive (PREp>PREn), while more patients with negative
predominance (PREn>PREp) occurs in HFpEF and the largest number occurs in patients with HFrEF.
Similarly, in normal as well as age matched controls, POE is almost always predominantly negative
(POEn>POEp), while more patients with positive predominance (POEp>POEn) occurs in HFpEF and the
largest number occurs in patients with HFrEF. Lower panel, Normal PRE-POE concordance (predominantly
positive PRE and predominantly negative POE) occurs almost always in normal as well as the aged
matched controls. In patients with HFpEF, lower number of normal concordance and increasing number
of PRE reversed and IR reversed as well as totally reversed concordance was noted. In patients with
HFrEF, the lowest number of normal concordance, and the largest number of totally reversed concordance
was observed.
Figure 3
dot plots for correlations observed in our study in subgroups. Upper panel: correlation between opposite
waves of the biphasic PRE velocities (left: between positive PRE and negative POE, right: between
negative PRE and positive POE). Middle panel: correlation between the ratio of positive to negative PRE
waves (PRE-P/N) vs, the negative to positive POE (POE-N/P). Lower panel: correlations against E/e’ as a
representation of LV filling pressures (left: versus the PRE-P/N ratio, right: versus the POE-N/P ratio)
Page 20/21Figure 4
Receiver operator characteristic curves (ROC-curves) for best predictors of E/e’≥13 in patients with heart
failure. Black line, positive PRE and negative PRE (PRE-P/N) ratio, red line, between negative POE to
positive POE (POE-N/P) ratio
Page 21/21You can also read