Thünen Working Paper 50 - Analysis of the land use sector in INDCs of relevant Non-Annex I parties
←
→
Page content transcription
If your browser does not render page correctly, please read the page content below
Analysis of the land use sector in INDCs of relevant
Non-Annex I parties

Yvonne Hargita, Sebastian Rüter

Thünen Working Paper 50
Yvonne Hargita
Thünen-Institut für Internationale    Waldwirtschaft   und
Forstökonomie
Leuschnerstraße 91
21031 Hamburg
Telefon: +49 04 73962-164
Fax: +49 40 73962-399
E-Mail: yvonne.hargita@thuenen.de

Sebastian Rüter
Thünen-Institut für Holzwirtschaft
Leuschnerstraße 91
21031 Hamburg
Telefon: +49 40 73962-619
Fax: +49 40 73962-699
E-Mail: sebastian.rueter@thuenen.de

Yvonne Hargita, Sebastian Rüter

Thünen Working Paper 50

Braunschweig/Germany, October 2015
Content                                                      1

Content
Abbreviations                                                2

Tables                                                       4

Figures                                                      5

Zusammenfassung                                              7

Abstract                                                     8

1. Introduction                                              9

2. Methodology and Data                                      9

3. Summary of the INDC assessment: results and conclusions   15

References                                                   21

A.1 China – submitted to UNFCCC 2015-06-30                   23

A.2 India – submitted to UNFCCC 2015-10-01                   29

A.3 Indonesia – submitted to UNFCCC 2015-09-24               32

A.4 Brazil – submitted to UNFCCC 2015-09-28                  38

A.5 Mexico – submitted to UNFCCC 2015-03-30                  44

A.6 Republic of Korea – submitted to UNFCCC 2015-06-30       50

A.7 Colombia – submitted to UNFCCC 2015-09-07                55

A.8 Ethiopia – submitted to UNFCCC 2015-06-10                59

A.9 Peru – submitted to UNFCCC 2015-09-28                    64

A.10 Morocco – submitted to UNFCCC 2015-06-05                67

A.11 DR Congo – submitted to UNFCCC 2015-08-18               72

A.12 Gabon – submitted to UNFCCC 2015-04-01                  77
2                                                                               Abbreviations

Abbreviations

    a           Year
    AFOLU       Agriculture, Forest, Other Land Uses (IPCC 2006 Land use sector)
    BAU         Business-as-usual
    BUR         Biennial Update Report
    BY          Base Year
    CAIT        Climate Data Explorer of the World Research Institute
    CAT         Climate Action Tracker
    CO2         Carbon Dioxide
    CO2eq       Carbon Dioxide Equivalents
    DR Congo    Democratic Republic of the Congo
    EU FLEGT    European Union Forest Law Enforcement, Governance and Trade
    FAO         Food and Agriculture Organization of the United Nations
    FAO-Stat    Statistics Division of the FAO
    FCPF        Forest Carbon Partnership Facility
    FRA         Forest Resource Assessment
    GDP         Gross domestic product
    Gg          Gigagram
    GHG         Greenhouse gas
    Gt          Gigatonne (1000 Mt)
    ha          Hectare
    HFLD        High forest cover, low deforestation rate
    INDC        Intended Nationally Determined Contributions
    IPCC        Intergovernmental Panel on Climate Change
    IPCC 1996   Revised 1996 IPCC Guidelines for National GHG Inventories
    IPCC 2000   Good Practice Guidance and Uncertainty Management in National GHG
                Inventories
    IPCC 2006   IPCC Guidelines for National GHG Inventories
    kt          Kilotonne (1000 tonnes), 1 kt equals 1 Gg
    LU          Land Use
    LUCF        Land Use Change and Forestry (IPCC 1996 Land use sector)
    LULUCF      Land Use, Land Use-Change and Forestry (IPCC 2003 Land use sector)
    m3          Cubic meter
    Mt          Megatonne (1000 kt)
    n.a.        Not applicable
    NAMA        National Appropriate Mitigation Action
    NC          National Communication
    n.d.        Not defined
    p.a.        Per annum
    PBL         Netherlands Environmental Assessment Agency (Dutch: Planbureau voor de
                Leefomgeving - abbr. PBL)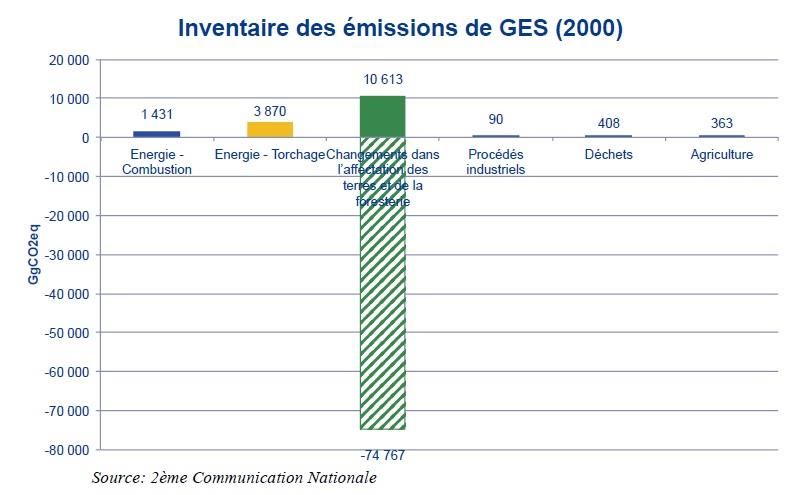
3

REDD+    Reducing Emissions from Deforestation and Forest Degradation and the role of
         conservation, sustainable management of forests and enhancement of forest
         carbon stocks in developing countries
RL       Reference level
SFM      Sustainable Forest Management
UNDP     United Nations Development Programme
UNFCCC   United Nations Framework Convention on Climate Change
US       United States of America
USD      US Dollar
w/o      With/without
WRI      World Research Institute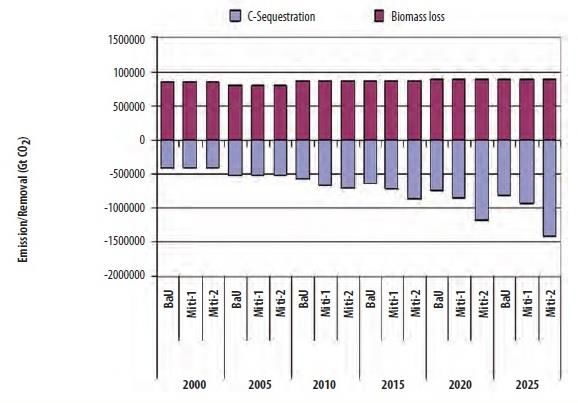
4 Tables
Tables
TABLE 1: TEMPLATE: OVERVIEW TABLE REGARDING KEY INFORMATION OF EACH INDC. .................................................................... 10
TABLE 2: ANALYSED NON-ANNEX I-COUNTRIES (GREY) RANKED ACCORDING TO THEIR SHARE IN GLOBAL FOREST AREA IN 2015. ............... 14
TABLE 3: OVERVIEW TABLE FOR KEY INFORMATION FROM ASSESSED NON-ANNEX I- INDCS. .............................................................. 15
TABLE 4: COUNTRY SPECIFIC OVERVIEW SUMMARIZING THE OVERALL ACCOUNTING APPROACH AND INFORMATION PROVIDED FOR THE LU
TARGET .................................................................................................................................................................... 16
TABLE 5: COMPARISON OF KEY ELEMENTS FROM THE BRAZILIAN INDC WITH THOSE FROM THE US, CANADA AND AUSTRALIA. ................. 18
TABLE 6: INDC ANALYSIS REGARDING THE LU SECTOR FOR CHINA – OVERVIEW. .............................................................................. 23
TABLE 7: CONVERTING THE 2030 TARGET (FOREST STOCK VOLUME) IN CO2-EMISSIONS /REMOVALS................................................... 24
TABLE 8: INDC ANALYSIS REGARDING THE LU SECTOR FOR INDIA – OVERVIEW. ............................................................................... 29
TABLE 9: SEQUESTRATION BY FORESTS IN MT CO2 FOR 2005-2035 IN INDIA. ................................................................................ 31
TABLE 10: INDC ANALYSIS REGARDING THE LU SECTOR FOR INDONESIA – OVERVIEW. ...................................................................... 32
TABLE 11: INDC ANALYSIS REGARDING THE LU SECTOR FOR BRAZIL – OVERVIEW. ........................................................................... 38
TABLE 12: BRAZILIAN BIOMES AND THEIR CORRESPONDING AVERAGE EMISSIONS IN GT CO2/A. .......................................................... 40
TABLE 13: 2005 AS BASE YEAR FOR THE TARGETS 2025 AND 2030 AND ACTUAL EMISSION DEVELOPMENT FOR 2012. THE BRAZILIAN INDC
DOES NOT INDICATE THE SHARES OF THE LU SECTOR IN THE TARGET EMISSIONS OF 2025 AND 2030. ......................................... 41
TABLE 14: SHARE OF EMISSIONS FROM DEFORESTATION IN THE AMAZON IN TOTAL EMISSIONS FROM LU FOR THE YEARS 1994, 2000 AND
2010. ..................................................................................................................................................................... 42
TABLE 15: INDC ANALYSIS REGARDING THE LU SECTOR FOR MEXICO – OVERVIEW. ......................................................................... 44
TABLE 16: SUMMARY OF INFORMATION PROVIDED UNDER THE MEXICAN REDD+ REFERENCE LEVEL SUBMISSION. ................................. 46
TABLE 17: INDC ANALYSIS REGARDING THE LU SECTOR FOR KOREA – OVERVIEW. ........................................................................... 50
TABLE 18: INDC ANALYSIS REGARDING THE LU SECTOR FOR COLOMBIA – OVERVIEW. ...................................................................... 55
TABLE 19: OVERVIEW OF THE REDD+ FOREST REFERENCE EMISSION LEVEL SUBMISSION FROM COLOMBIA UNDER THE UNFCCC. ............ 57
TABLE 20: INDC ANALYSIS REGARDING THE LU SECTOR FOR ETHIOPIA – OVERVIEW. ........................................................................ 59
TABLE 21: INDC ANALYSIS REGARDING THE LU SECTOR FOR PERU – OVERVIEW. ............................................................................. 64
TABLE 22: INDC ANALYSIS REGARDING THE LU SECTOR FOR MOROCCO – OVERVIEW. ...................................................................... 67
TABLE 23: INDC ANALYSIS REGARDING THE LU SECTOR FOR DR CONGO – OVERVIEW. ..................................................................... 72
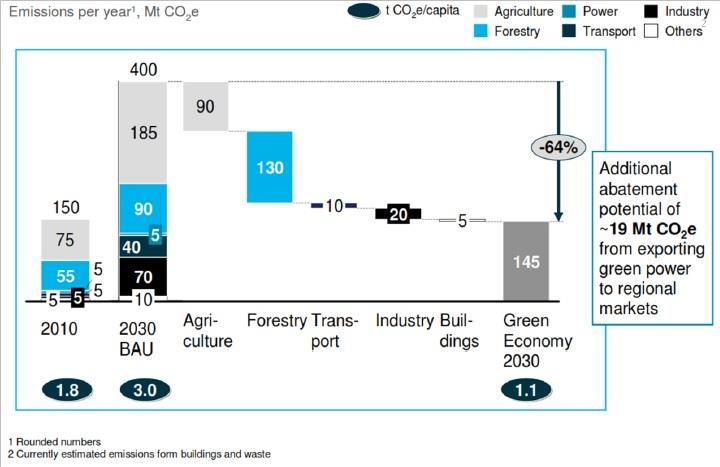
TABLE 24: EMISSION REDUCTION POTENTIALS IN MT CO2 ACCORDING TO FIGURE 32....................................................................... 74
TABLE 25: INDC ANALYSIS REGARDING THE LU SECTOR FOR GABON – OVERVIEW. .......................................................................... 77
TABLE 26: GHG INVENTORY OF GABON, BASED ON THE FIRST AND SECOND NATIONAL COMMUNICATIONS [IN GG CO2] ........................ 80
Figures 5
Figures
FIGURE 1: PERIODICAL REPORTING REQUIREMENTS FOR ANNEX I- AND NON-ANNEX I-PARTIES UNDER THE UNFCCC (AS OF OCTOBER
2015). .................................................................................................................................................................... 13
FIGURE 2: HISTORICAL AND PROJECTED EMISSIONS FOR INDIA IN EMISSION INTENSITY PER GDP (LEFT) AND OVERALL EMISSION DEVELOPMENT
(RIGHT). ................................................................................................................................................................... 19
FIGURE 3: EMISSIONS AND REMOVALS IN MT CO2 FROM CHINESE FORESTS FOR 1994 AND 2005 ACCORDING TO THE FIRST AND SECOND
NCS. ....................................................................................................................................................................... 26
FIGURE 4: FOREST AREA IN KHA FOR CHINA REPORTED UNDER FAO. ............................................................................................. 26
FIGURE 5: REMOVALS IN MT CO2 DUE TO STANDINGS FORESTS AND AFFORESTATION IN CHINA. ......................................................... 27
FIGURE 6: NATIONAL EMISSIONS IN INDONESIA IN MT CO2EQ FOR 2005 AND FOR 2030 ACCORDING TO THE BAU SCENARIO AND THE UN-
/CONDITIONAL PLEDGES. ............................................................................................................................................. 33
FIGURE 7: SHARE OF DIFFERENT SECTORS IN THE NATIONAL EMISSIONS IN 2000 IN INDONESIA. PEAT FIRE IS CONSIDERED SEPARATELY FROM
THE LU SECTOR AS THERE IS NO ROBUST NATIONAL DATA ................................................................................................... 34
FIGURE 8: INDONESIAN BAU AND TWO DIFFERENT MITIGATION SCENARIOS UP TO THE YEAR 2025, TAKEN FROM THE SECOND NC. IT IS NOT
STATED, IF THE (MORE AMBITIOUS) MITIGATION SCENARIO 2 IS REFERRING TO THE -26 % PLEDGE FOR 2020 FROM 2009. ............ 35
FIGURE 9: HISTORIC EMISSION TRENDS 1990-2010 IN INDONESIA FOR DEFORESTATION ONLY AND FOR NET-EMISSIONS FROM FORESTS
(INCLUDING DEFORESTATION, DEGRADATION AND REMOVALS). ........................................................................................... 36
FIGURE 10: BRAZILIAN EMISSION INVENTORY FOR THE LU SECTOR ACCORDING TO THE SECOND NC, DIFFERENTIATED IN BIOMES............... 39
FIGURE 11: EMISSIONS FROM DEFORESTATION IN THE AMAZON BIOME AND THE EMISSION REDUCTION IN 2012 RELATIVE TO THE INDC BY
2005. ..................................................................................................................................................................... 41
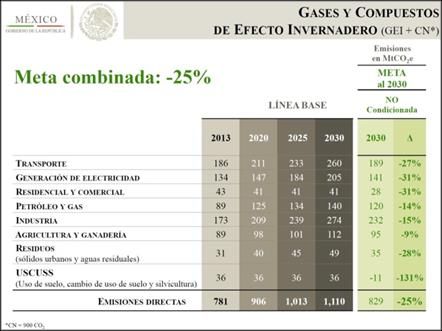
FIGURE 12: BAU-BASELINE, TARGET AND ZERO DEFORESTATION TARGET ACCORDING TO THE MEXICAN INDC. ..................................... 45
FIGURE 13: LUCF CATEGORY REPORTING FROM THE FIFTH NC (ACCORDING TO IPCC 1996) AND INFORMATION REGARDING THE REDD+ RL
(ACCORDING TO IPCC 2000). ...................................................................................................................................... 47
FIGURE 14: INFORMATION FROM A MEXICAN INDC PRESENTATION. ............................................................................................. 47
FIGURE 15: KOREAN GHG INVENTORY FOR THE LU SECTOR BASED ON THE LATEST SUBMISSION FOR THE YEARS 1990, 1995, 2000, 2005
AND 2010 IN MT CO2. THE CURVE REPRESENTS THE HEIGHT OF EMISSIONS DUE TO DEFORESTATION. ........................................ 51
FIGURE 16: KOREAN GHG INVENTORY, BAUS AND PLEDGES IN TOTAL EMISSIONS EXCLUDING AND INCLUDING LU. ............................... 52
FIGURE 17: SHARE OF THE LU SECTOR IN TOTAL GHG EMISSIONS (EXCL. LU) OVER TIME AND POTENTIAL SHARE IN BAU UP TO 2030....... 52
FIGURE 18: POTENTIAL EFFECT OF THE INCLUSION OF THE LU SECTOR ON PLEDGES........................................................................... 53
FIGURE 19: COLOMBIAN GREENHOUSE GAS INVENTORY FOR THE YEAR 2010. ................................................................................. 56
FIGURE 20: BAU- AND MITIGATION SCENARIOS WITH UNCONDITIONAL TARGET FOR 2030 IN COLOMBIA. ............................................ 56
FIGURE 21: HISTORIC EMISSIONS FROM DEFORESTATION IN THE COLOMBIAN AMAZON AND THE SUBMITTED REFERENCE LEVEL FOR 2013-
2017 ...................................................................................................................................................................... 58
FIGURE 22: SHARE OF DIFFERENT SECTORS IN ACTUAL EMISSIONS IN ETHIOPIA (2010), BAU 2030 AND IN MITIGATION EFFORT TOWARDS
2030 TARGET. THE MOST RELEVANT SECTORS ARE AGRICULTURE AND FORESTRY, WHILE FORESTRY HAS THE HIGHEST MITIGATION
POTENTIAL. ............................................................................................................................................................... 60
FIGURE 23: EMISSIONS AND REMOVALS BETWEEN 1990 AND 1995 FOR THE LAND USE-CHANGE AND FORESTRY SECTOR IN MT CO2 IN
ETHIOPIA. ................................................................................................................................................................. 61
FIGURE 24: DEVELOPMENT OF NET-EMISSIONS FROM LAND USE WITHOUT MITIGATION EFFORTS......................................................... 62
FIGURE 25: PERU’S GHG FOR 2010 AND 2030 ACCORDING TO THE BAU WITH AND WITHOUT EMISSIONS FROM LU. THE DELTAS ON THE
RIGHT SIDE GIVE THE LU EMISSIONS UNDER BAU ACCORDING TO THE COMPARISON. ............................................................... 65
FIGURE 26: COMPARISON OF EMISSION DATA FOR THE YEAR 2010 FROM THE INDC AND THE LATEST EMISSION INVENTORY. ................... 66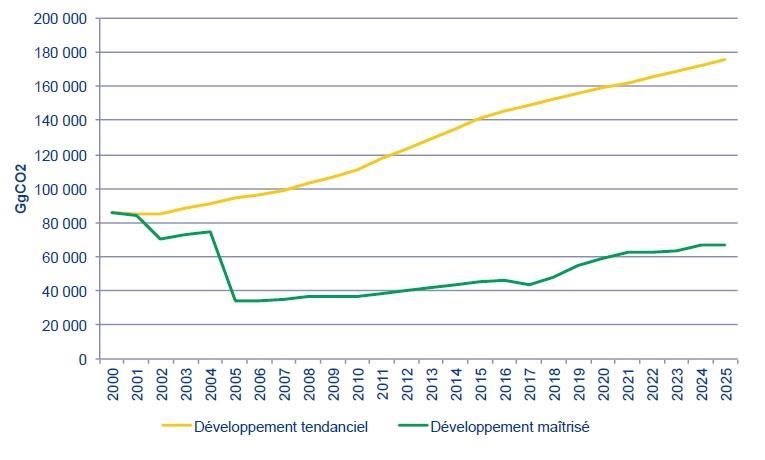
6 Figures
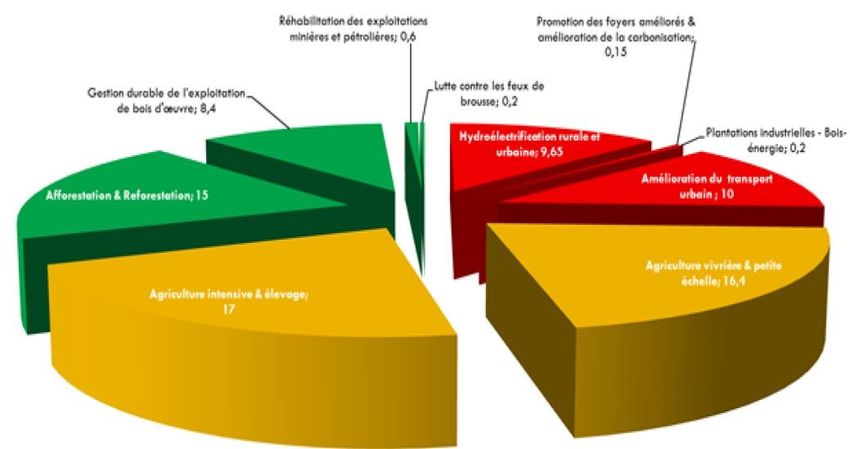
FIGURE 27: DISTRIBUTION OF THE MITIGATION EFFORT BY SECTOR BETWEEN 2020 AND 2030, TO ACHIEVE THE CONDITIONAL TARGET OF -
32 % (-54 MT CO2EQ)................................................................................................................................................ 68
FIGURE 28: NET-EMISSIONS IN KT CO2 FROM THE MOROCCAN LU SECTOR DIVIDED IN SUBCATEGORIES FOR THE YEAR 2000. .................. 68
FIGURE 29: EMISSIONS AND REMOVALS IN KT CO2 FOR THE MOROCCAN LU SECTOR FOR 1994 AND 2000. ......................................... 70
FIGURE 30: EMISSIONS IN KT CO2 FROM 2000 TO 2030 FOR DR CONGO: TOTAL NATIONAL EMISSIONS RESPECTIVELY EMISSIONS FROM LU
AND THEIR REDUCTION SHARES. .................................................................................................................................... 73
FIGURE 31: GROSS-EMISSIONS, REMOVALS AND NET-EMISSIONS IN DR CONGO FOR THE HISTORIC PERIOD 2000-2010 AND PROJECTED
GROSS-EMISSIONS FOR THE YEARS 2015/2020/2025/2030. ........................................................................................... 73
FIGURE 32: DR CONGO EMISSION REDUCTION POTENTIALS IN MT CO2EQ. GREEN INDICATES THE SHARE OF LU RELATED EMISSION REDUCTION
POTENTIALS (24.2 MT CO2EQ). ..................................................................................................................................... 74
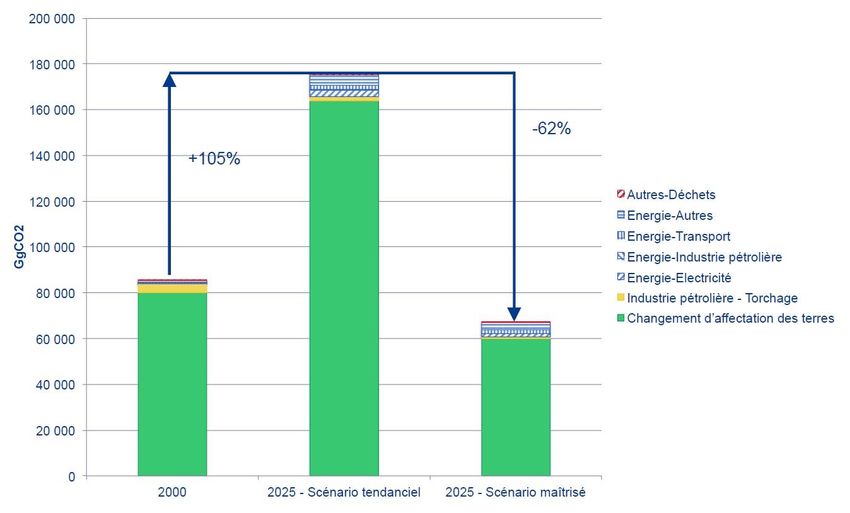
FIGURE 33: GABONS’ EMISSION PROFILES FOR THE YEAR 2000 AND FOR THE YEAR 2025 UNDER BAU (S. TENDENCIEL) AND MITIGATION (S.
MAÎTRISÉ). THE LU SECTOR IS DISPLAYED AS CHANGEMENT D'AFFECTATION DES TERRES. .......................................................... 78
FIGURE 34: GHG INVENTORY FOR THE YEAR 2000 AS PROVIDED IN THE SECOND NC. EMISSIONS ARE POSITIVE, REMOVALS NEGATIVE (GG
CO2EQ). .................................................................................................................................................................... 79
FIGURE 35: EMISSIONS UNDER THE BAU (DÉVELOPPEMENT TENDENCIEL, YELLOW) AND THE MITIGATION SCENARIO (DEVELOPPEMENT
MAÎTRISÉ, GREEN) BETWEEN 2000 AND 2025 FOR GABON. ............................................................................................... 81
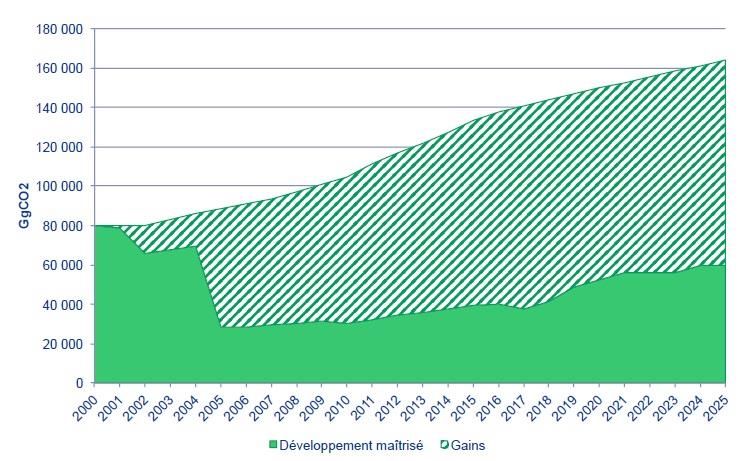
FIGURE 36: EMISSIONS FROM THE LU SECTOR UNDER THE BAU (GAINS [I.E. DIFFERENCE], GREEN/WHITE AND THE MITIGATION SCENARIO
(DEVELOPPEMENT MAÎTRISÉ, GREEN) BETWEEN 2000 AND 2025 FOR GABON. ..................................................................... 81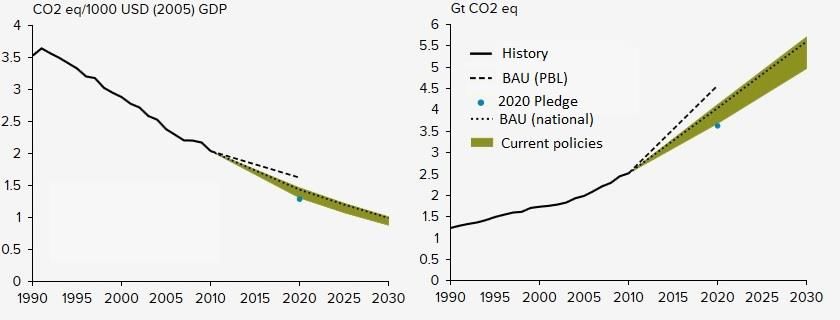
Zusammenfassung                                                                                7

Zusammenfassung

Die internationale Staatengemeinschaft hat im Dezember 2015 in Paris ein globales
Klimaabkommen verabschiedet, welches ab 2020 in Kraft treten und alle Mitgliedstaaten zu
verbindlichen Emissionsreduktionen verpflichten soll. Im Vorlauf der Verhandlungen wurden von
den Staaten nationale Emissionsreduktionsbeiträge für post 2020 eingereicht, die sogenannten
Intended Nationally Determined Contributions (INDC). Im Sinne des §14 des Lima Call for Climate
Action sollen die INDCs unter anderem Auskunft darüber geben, ob und auf welche Weise
Kohlenstoffeinbindungen im Landnutzungssektor berücksichtigt werden.

Die Verhandlungen unter dem Kyoto Protokoll in der Vergangenheit haben gezeigt, dass der
Landnutzungssektor eine besondere Rolle spielt, da die Anrechnungsregeln einen entscheidenden
Einfluss auf die Berücksichtigung von Emissionen und Einbindungen haben können. Da sich die
Staatengemeinschaft bisher nicht auf verbindliche Anrechnungsregeln unter einem gemeinsamen
Klimaabkommen einigen konnte, haben die Länder derzeit alle Freiheiten bei der Ausgestaltung
ihrer freiwilligen Reduktionziele. Insbesondere der potentielle Beitrag des Landnutzungssektors, der
je nach natürlichen Voraussetzungen und Nutzung als Treibhausgasquelle oder -senke fungieren
kann, stellt eine Unsicherheit hinsichtlich der über alle Staaten akkumulierten
Emissionsreduktionsziele dar.

Mit unseren INDC-Analysen relevanter Non-Annex I-Länder für den Landnutzungssektor, haben wir
die potentielle Rolle von Wäldern und REDD+ für die jeweiligen nationalen Reduktionsziele kritisch
hinterfragt. Es hat sich gezeigt, dass die untersuchten Länder die Freiheiten in der Anrechnung
nutzen, und im bestehenden Rahmen unterschiedlichste Ansätze auswählen. Diese Vielfalt geht auf
Kosten von Transparenz, Vollständigkeit und Vergleichbarkeit der Emissionsziele und erschwert die
Bewertung des Ambitionsniveaus. So bleiben Fragen offen zu Emissionsdaten und zu Annahmen
zukünftiger Emissionsentwicklungen. Die Auswertung der INDCs zeigt, dass eine unabhängige
Überprüfung der INDC-Datenlage durch UNFCCC-Experten notwendig ist, um die Rolle des
Landnutzungssektors für künftige globale Emissionsreduktionsziele in den weiteren Verhandlungen
einschätzen zu können. Zum jetzigen Zeitpunkt bleibt die Berücksichtigung des Landnutzungssektors
in einem zukünftigen Klimaregime eine Quelle für Unsicherheiten.

Keywords: UNFCCC, INDC, Non-Annex I, REDD+, 2020, 2030, Pariser Klimaabkommen, Wald,
Landnutzung, Brasilien, Indien, China, Indonesien
8                                                                                           Abstract

Abstract

The international community has committed itself to adopt a global climate agreement in Paris in
2015, which shall enter into force in 2020 and shall be legally-binding for all. In advance of the
negotiations, parties shall submit the so-called Intended Nationally Determined Contributions
(INDC), providing the voluntary national emission reduction pledges post 2020. For the purposes of
§ 14 of the Lima Call for Climate Action parties may also provide information on whether and in
what manner removals are taken into account. Removals are synonymous for the land use (LU)
sector that can serve as a carbon sink or source, depending on the national preconditions and the
sector’s management.

Climate negotiations in the past have shown that the accounting rules that result from the special
role of the LU sector have a major impact on the accounting of emissions and removals (in the sum:
net-removals), and thus on the pledged overall emission reduction targets. Since the international
community has yet not been able to agree on binding accounting rules for post-2020, every party
can decide on its own, how it considers net-emissions from LU in its INDC. Countries with large forest
areas could significantly weaken their overall level of ambition by applying national profitable rules.

With our analysis of the LU sector in relevant Non-Annex I-INDCs, we critically reflect the potential
role of forests and the REDD+ mechanism for the national reduction targets. The analysis shows that
the assessed parties have taken advantage of the missing common rules and designed their
reduction targets in a variety of ways. This variety risks transparency, completeness and
comparability of information and complicates the assessment of ambition. The remaining issues
that could not be answered with the data provided confirmed the need for independent technical
review of emission data and assumptions behind future emission development by UNFCCC experts.
These reviews could assure that the quality of pursuing negotiations of reduction targets would not
be compromised. At the present state, the inclusion of the LU sector and its impact on future
reduction commitments remain a source of uncertainty.

Keywords: UNFCCC, INDC, Non-Annex I, REDD+, 2020, 2030, Paris Agreement, forest, land use,
Brazil, China, India, Indonesia
Introduction                                                                                      9

1. Introduction

In 2012, the parties to the Convention decided ‘(…) to launch a process to develop a protocol,
another legal instrument or an agreed outcome with legal force under the Convention applicable to
all Parties (…)’ (UNFCCC 2012). This process should be completed at the meeting in Paris at the end
of 2015 and the new protocol should enter into force in 2020.

Parties could neither agree on binding reduction commitments nor on emission accounting rules.
So they agreed on the approach of Intended Nationally Determined Contribution (INDC) (UNFCCC,
2014) which refers to initial national mitigation targets that every party can define on its own. Those
INDCs ‘(…) may include, as appropriate, inter alia, quantifiable information on the reference point
(including, as appropriate, a base year), time frames and/or periods for implementation, scope and
coverage, planning processes, assumptions and methodological approaches including those for
estimating and accounting for anthropogenic greenhouse gas emissions and, as appropriate,
removals, (…)’ (UNFCCC, 2015). Removals refer to the land use (LU) sector that can serve as carbon
sink or source and has a share of approximately 25 % in global net-emissions (IPCC, 2014).

REDD+ is the established mechanism for emissions from forests in Non-Annex I-countries (UNFCCC
2010). REDD+ emission reductions have to be verified against a national reference level and are
than financially compensated (UNFCCC 2011). Flexible rules for the establishment of the REDD+
reference level consider the different economical and technical capacities among Non-Annex I-
countries. The national implementation status of REDD+ differs considerable depending on the
reporting capabilities (Romijn et al, 2012). Still, REDD+ as implemented mechanism for net-
emissions from forests can be expected to play an important role for the LU sector in INDCs. But the
flexibility within REDD+ additionally to the missing accounting rules for INDCs, enhances the risk of
individually developed INDCs which could result in the most profitable accounting approach for each
country. Against this background, the LU sector presents a source of uncertainty- not only for
national mitigation targets, but due to its high share in global emissions also to the overall global
emission reduction that is necessary to keep global warming well below 2°C.

The objective of this work is to provide the interested community in a transparent manner on how
Non-Annex I-countries treat the forest sector and REDD+ in their INDCs. We analyze the role of the
LU sector in INDCs of forest relevant Non-Annex I parties regarding the importance for their post
2020 pledge, the level of detail of the information given and whether the LU sector target could be
assumed as ambitious or provides the potential to considerable weaken the overall national target.
We restrict our analysis to climate relevant forest countries (compare Hargita, 2014).

2. Methodology and Data

For many Non-Annex I-countries’ emission inventories, the clear distinction of forests within the LU
sector is not possible. This is due to the wide use of 1996 Intergovernmental Panel on Climate
10 Methodology and Data
Change (IPCC) Guidelines for National Greenhouse Gas Inventories that do not foresee a
differentiated reporting of emissions in the LU sector for forests and other LU like more recent IPCC
Guidelines do. Similar is the treatment of LU related emissions in the INDCs, where some countries
refer to other LU categories than in their emission inventories or to country-defined categories. Due
to this heterogeneity in naming LU related emissions in the INDCs, in this text ‘LU’ is used as
synonym for categories from Land Use Change and Forestry (LUCF) (IPCC 1996), Land Use, Land Use-
Change and Forestry (LULUCF) (IPCC 2000), Agriculture, Forest and Other Land Uses (AFOLU) (IPCC
2006) or other country-defined categories (e.g. biomes, ‘non-categories’ like peat fires etc.) until
otherwise specified.
Template for the assessment
The template which is the basis for all conducted assessments is presented in the following. First,
key information of each INDC was compiled in an overview table (see Table 1).
Table 1: Template: Overview table regarding key information of each INDC.
LU sector considered Time frame
All pools included Accounting method
Distinct LU sector target Reference level, LU
LU sector considered in the INDC: ‘LU sector’ summarises all LU categories, by preference as
established categories according to the IPCC; possible options: Yes/No.
All pools included: relevant carbon pools in the LU sector are according to the IPCC: biomass
(aboveground and belowground), soil (organic and mineral), litter and dead wood (together:
dead organic matter); possible options Yes/No or not defined (n.d.).
Distinct LU sector target: INDCs include an overall emission reduction target which can vary in
the level of detail; due to the special role of the LU sector that can serve as a carbon sink or
source, a distinct LU sector target enhances the transparency of the overall reduction target;
possible options Yes/No.
Time frame: countries could decide on a year after 2020 for their reduction target.
Accounting method: three potential accounting methods exist under UNFCCC (Ellison et al.,
2011):
(1) Net-net: net-emissions of a target year are compared with those of a base year, e.g. all
non-LU sectors’ emissions under the first commitment period of the Kyoto Protocol were
reduced relative to those of one base year, mostly 1990;
(2) Gross-net: for a defined time frame, accumulated net-emissions are accounted for, e.g.
under the first commitment period of the Kyoto Protocol, accumulated net-emissions from
forest management 2008-2012 were accounted for up to a defined cap;Methodology and Data 11
(3) Reference level (RL): emissions are accounted against a national benchmark, e.g. forest
management under the second commitment period of the Kyoto Protocol or REDD+;
(4) Intensity target: this option does not exist under UNFCCC, nevertheless some Non-Annex
I-parties decided to account their emission reduction relative to their gross domestic product
(GDP).
Reference level, LU: if parties account their overall emission reductions relative to a reference
level, they need to develop reference levels for all sectors covered, also for the LU sector;
possible options: Yes - in case an actual LU reference level is provided; not applicable (n.a.) -
the accounting option does not need a reference level; n.d. - the accounting option needs a
reference level but it is not provided by the party.
In further detail, the following questions are answered for every INDC:
1. Is the LU sector part of the INDC?
The country explicitly in- or excludes emissions from LU.
2. Is a clear differentiation between LU sector target and its share in the overall INDC
possible?
The country provides a distinct target for LU, e.g. X % of the overall target will be fulfilled
by a reduction in LU emissions, or the sub target for LU is Y %.
3. Is the LU sector accounting comprehensible?
The country provides the reporting and accounting categories for LU which are consistent
with historically reported categories, or provides updated categories and emission data
(also for historical years). It states the basis for the LU projection (e.g. data basis and
assumptions made) and how it is planning to achieve the LU sector target (see next
question).
4. Which measures support the LU sector target?
The country provides measures for the LU sector, in the best case with corresponding
reduction potentials.
5. How can the LU sector target be seen in the context of past emission trends? How does
it compare to existing available data and trends?
In the case of Non-Annex I countries, most countries do not provide extensive historic
emission data comparable to Annex I time series. The reason for this lies in the different
treatment of country groups under UNFCCC regarding capacities and responsibilities for
both, the reporting and the potential emission reduction commitments (compare Fehler!
erweisquelle konnte nicht gefunden werden.). Therefore, the comparison of the
provided data in the INDC with available LU data can help to assess the ambition of targets
(see next question). The informative value of this section has to be treated with caution,
as it includes some guesswork due to missing background information.12 Methodology and Data
6. How ambitious is the LU sector target?
The thorough assessment of the ambition level of emission reductions in the LU sector
should take all relevant national circumstances into account, as there are: state of the
forest, economical dependency on forests and its products, overall economic state and
development projections, national emission budget and many more. Such an assessment
is made by the Climate Action Tracker (CAT) that conducts assessments of climate pledges
by countries (CAT 2015). Here, the assessment of ambition is conducted mainly based
upon the data available under UNFCCC and in relation to comparable countries.
Remaining issues
Based on the assessment, the most urgent remaining questions regarding the LU sector
in the INDC are formulated.
For the assessment additional data sources were consulted. Whenever possible, data submitted
under the UNFCCC was used, as this data is most likely of a comparable quality level and based on
comparable calculation methods as the data in the INDC. Figure 1 displays periodical reporting
requirements for Annex I- and Non-Annex I-parties under the UNFCCC.
As there are no strict reporting requirements for Non-Annex I-parties like there are for Annex I-
parties (e.g. the use of IPCC Guidelines), UNFCCC-emission data for Non-Annex I-countries is often
incomplete and/or out-dated. Therefore additional data sources were consulted; under UNFCCC
data from National Appropriate Mitigation Actions (NAMA) and REDD+ submissions was used.
Outside the UNFCCC data from the Food and Agriculture Organization of the United Nations (FAO)
was used, namely from the Forest Resource Assessment (FRA) and from the Statistics Division (FAO-
Stat). Other sources of information were the Climate Action Tracker (CAT) that conducts
assessments of climate pledges by countries (CAT 2015), and the Climate Data Explorer of the World
Research Institute (CAIT) which provides national historical emission projections up to 2012 (CAIT
2015).Methodology and Data 13
Figure 1: Periodical reporting requirements for Annex I- and Non-Annex I-parties under the UNFCCC
(as of October 2015).
Reporting under the Convention Kyoto Protocol
GHG-Inventory + National Biennial Report GHG-Inventory +
Report Communication Report
Annex I
annual 3-5 years biennial annual
IPCC Guidelines 2006 IPCC Guidelines 2006 IPCC Guidelines IPCC Guidelines 2006
1990-201X 1990-201X 2006
1990-201X 2008-201X
Review Review Review Review + Compliance
National Biennial Update
Communication Report
Non-Annex I
3-5 years biennial
IPCC Guidelines IPCC Guidelines
1996/2003/2006 1996/2003/2006
1990/1994/2000 year minus max. 4
no Review Consultation +
Analysis
Process
Source: Own illustration. The squares display the periodicity for submissions in years, the required IPCC Guidelines, the
time frames for emission data and whether the data is reviewed or not.
Assessed Non-Annex I-parties
12 Non-Annex I-parties were selected mainly based on the climate political relevance due to their
forests (see Hargita 2014). Table 2 displays the 13 countries that comprise almost 75 % of the global
forest area in 2015 (eight are Non-Annex I-countries) and four more assessed Non-Annex I-parties
ranked according to their share in global forest area. Besides their share in global forest area
(according to FAO FRA, 2015), the table shows whether the LU sector (LU instead of forest sector as
it is not possible to extract forest net-emissions from Non-Annex I-countries inventories) is a net-
sink or a net-source, the share of LU emissions compared to remaining emissions from other sectors
and which forest activity is most relevant for the LU sector in terms of net-emissions.
The shares of net-emissions from forests in Brazil and Indonesia are not only highly relevant for the
national emission budgets (154 % respectively 148 %). Due to the high shares in global forest area
they also have a major share in global emissions from forests. China is another extreme as it is
conducting the world’s largest afforestation programme and therefore provides a major sink. But
compared to the high national emissions mainly from the Energy sector, the share of the LU sector
as national net-sink is relatively low (-6 %).14 Methodology and Data
Table 2: Analysed Non-Annex I-countries (grey) ranked according to their share in global forest area
in 2015.
Share in LU-share in
global national
Overall LU: Most relevant forest
Country forest area emissions
sink/source activity/subcategory
in 2015 (excl. LU
(%)1 emissions)2
Russia 20.4 Sink -24 % Forest Management
Brazil 12.3 Source 154 % Deforestation/Degradation
Canada 8.7 Source 6% Forest Management
US 7.8 Sink -15 % Forest Management
China 5.2 Sink -6 % Afforestation/Reforestation
EU 3.9 Sink -7 % Forest Management
DR Congo 3.8 Sink -389 % Standing forests
Australia 3.1 Source 3% Forest Management
Indonesia 2.3 Source 148 % Deforestation/Degradation
India 1.8 Sink -15 % Afforestation/Reforestation
Peru 1.8 Source 54 % Deforestation
Mexico 1.7 Source 7% Deforestation
Colombia 1.5 Source 23 % Deforestation
...
Gabon 0.6 Sink -1 % Standing forests
Ethiopia 0.3 Sink -21 % Afforestation/Reforestation
Republic of Korea 0.2 Sink -7 % Forest Management
Morocco 0.1 Source 7% Degradation
(Footnotes: 1Taken from FAO FRA (2015), 2 UNFCCC (2015): 2013 for Annex I, last available reporting year for Non-Annex I.
The table illustrates the heterogeneity within the group of assessed Non-Annex I-countries
regarding the role of forests on international (12.3 % to 0.2 % share in global forest area) and
national scale (+154 % to -1 % LU share in remaining national emissions) and regarding the relevant
forest activities (Deforestation, Afforestation, Forest Management). Compared to the Non-Annex I-
group, the group of Annex I-countries with highest shares in global forest area is relatively
homogeneous regarding the range of shares of LU in overall emissions (-24 % to +6 %) and the most
relevant forest activity (Forest Management).
The chosen Non-Annex I-INDCs provide a cross section of the heterogeneous group of Non-Annex I-
countries and consider the most forest relevant countries within this group.Summary of the INDC assessment: results and conclusions 15
3. Summary of the INDC assessment: results and conclusions
In this section the results of the assessments will be summarized, but all INDC assessments are
attached in the Annex of this document. Table 3 illustrates the key information of the assessed
countries according to Table 1. From 12 assessed INDCs, 11 explicitly include the LU sector. Only the
Republic of Korea did not consider the LU sector, but stated that it could do so in the future and will
decide later. The statement of deciding later on the inclusion of a whole sector is a noteworthy
result of missing accounting rules and ‚freedom of choice‘. Regarding the inclusion of carbon pools,
there is the clear tendency of Non-Annex I-countries not to make any statement regarding the pools.
Most likely, all assessed parties are referring at least to the reporting of the pool aboveground
biomass in the context of LU; most likely not included by the majority is the mapping and reporting
of soil carbon which is most demanding (Romijn et al. 2012).
Five parties give a distinct LU target, some in the target section like China, others in the context of
adaptation like Mexico. Thus, the level of detail regarding the LU targets is quite different and
sometimes the differentiation between a measure and a target is not that simple, as countries seem
to have used different definitions for these two. The seven countries without a distinct LU target
include the Republic of Korea which has not yet decided upon the inclusion of the LU sector.
Regarding the time frame for the overall emission reduction target, the majority chose 2030 as
target year for the post 2020 agreement, only Gabon pledged for a target in 2025.
Table 3: Overview table for key information from assessed Non-Annex I- INDCs.
Out of 12 assessed INDCs
Yes 11
LU sector considered
No 1
all 0
All carbon pools included
no specification 12
Yes 5
Distinct LU target
No 7
2025 1
Time frame
2030 11
net-net 1
gross-net 0
Accounting method
reference level 9
intensity target 2
Yes 2
Reference level, LU n.d. 6
n.a. 4
Source: Own illustration; information taken from INDCs.16 Summary of the INDC assessment: results and conclusions
The majority of countries decided for a reference level as accounting method but only two provided
a distinct reference level for the LU sector. The country specific overview in Table 4 shows that Brazil
is the only Non-Annex I-party that chose a net-net approach. China and India decided for an intensity
target which is not an established accounting method under UNFCCC.
Table 4: Country specific overview summarizing the overall accounting approach and information
provided for the LU target
Share (%) Unconditional INDC target (conditional*)
in global
INDC Accounting
Countries GHG Target relative Comment for LU target:
BY approach
emissions to BY/ RL future LU target ambitious
20123
Peaking latest
Increase in
Intensity by 2030,
China 22.4 2005 standing volume Yes
target -60 to -65 %
of forests
CO2/GDP
-33 to -35 %
Intensity Forest: projected See
India 6.0 2005 CO2/GDP by
target sink -90 Mt CO2/a analysis
2030
Constant
-29 % (-40 %*) deforestation, See
Indonesia 4.2 2005 RL
by 2030 increase in analysis
sequestration
Zero illegal
See
Brazil 3.8 2005 net-net -43 % by 2030 deforestation in
analysis
Amazon
-25 % (-40 %*) Zero net-
Mexico 1.6 2013 RL Yes
by 2030 deforestation
...
Republic decision on
1.3 - RL -37 % by 2030 -
of Korea inclusion later
-20 % (-30 %*) Mentions REDD+ See
Colombia 0.4 - RL
by 2030 Submission analysis
74% increase in
RL -64 %* by forest area, 64 %
Ethiopia 0.3 2010 Yes*
2030 of this area under
SFM
Important role
-20 % (-30%*) See
Peru 0.3 2010 RL (50 % of
by 2030 analysis
emissions)
50,000 ha
-13 % (-32 %*)
Morocco 0.2 - RL afforestation per Yes*
by 2030
yearSummary of the INDC assessment: results and conclusions 17
Share (%) Unconditional INDC target (conditional*)
in global
INDC Accounting
Countries GHG Target relative Comment for LU target:
BY approach
emissions to BY/ RL future LU target ambitious
20123
RL LU emission See
DR Congo 0 2000 -17 % by 2030
reduction -25 % analysis
RL at least -50 % Excluding sink- See
Gabon 0 2000
by 2025 effect analysis
Source: Own illustration; information taken from INDCs, 3CAIT (2015). A comparable overview for all submitted INDCs can be
found at Climate Policy Observer (2015). For the assessment it is assumed that information regarding the LU sector in the
INDCs is referring to the unconditional overall target, although it is generally not clearly indicated in the INDCs (exception is
Ethiopia with only a conditional target).
Beside information summarizing the overall accounting approaches chosen by the assessed parties,
Table 4 displays that some countries chose to pledge an unconditional reduction target they would
implement through domestic investment and expenses, but also a conditional* target that is subject
to the availability of international financing.
Although the capacities in LU reporting within the Non-Annex I-group range from low (Africa) to
higher (South America, China, India; Hargita 2014), this discrepancy in capabilities does not
necessarily shows in the quality of the submitted INDCs. Emerging economies like China or India
with comparably high capacities remained relatively vague regarding the role of the LU sector in
their intensity targets. On the other side, lower developed countries like Gabon or DR Congo
provided reference levels for their LU sectors in order to improve the transparency of their overall
targets. In Brazil and Indonesia the LU sector is due to high deforestation rates a major source of
emissions and therefore has the highest reduction potentials of all assessed countries. Indonesia
pledges for a reduction target of -29 % and with international financing -40 %. It is most likely that
the financing is needed for emission reduction measures in the LU sector as it is an important source.
The Brazilian INDC will be discussed in the following chapter. Mexico is the only assessed party that
commits for a zero deforestation target.
Implications of the different accounting approaches
In the following we will discuss the different accounting approaches and their role in, and possible
implications for, international negotiations towards post 2020.
Brazil is the only assessed party that chose a net-net accounting approach. Table 5 shows some key
elements from Brazil and the Umbrella Group members US, Canada and Australia (all Annex I). Brazil
signalled that it would submit its INDC not until the last Umbrella Group member would have
submitted its INDC which was Australia in August 2015. The direct comparison shows that Brazil has
not only chosen the same accounting approach and the same base year, but that it commits to a
reduction target well above those from some of the most important Annex I-countries.18 Summary of the INDC assessment: results and conclusions
Table 5: Comparison of key elements from the Brazilian INDC with those from the US, Canada
and Australia.
Comparable Share (%) in global INDC Accounting Unconditional target
INDCs GHG emissions 20123 BY approach relative to BY
US 12.2 2005 net-net -26 to -28 % by 2025
Brazil 3.8 2005 net-net -43 % by 2030
Canada 1.8 2005 net-net -30 % by 2030
Australia 1.1 2005 net-net -26 to -28 % by 2030
Source: Own illustration, based on US (2015), Brazil (2015), Canada (2015), Australia (2015) and 3CAIT (2015).
Brazil not only timed its own submission with those of the most developed countries. Based on the
same accounting approach and the same base year, Brazil is also providing the highest relative
reduction target within this group. As the INDC analysis shows, Brazil has already achieved -41 % of
emission reduction compared to 2005 in 2012 (PRODES, 2014) and therefore almost reached its
2030 target of -43 % (under the simplified assumption that emissions from other sectors remain
stable). Basis for the Brazilian target is a historic decrease of 70 % in emissions from deforestation
in the Amazon biome (Brazil 2014) since 2005. In this context, the Brazilian INDC may not be very
ambitious for the forest sector in the years coming, but it is a clear signal to other heavyweights in
climate negotiations- Brazil has already done its share in emission reductions up to 2030 and its
commitment is higher than those of leading Annex I-parties.
No assessed party has decided for an accounting by the gross-net accounting approach.
Consequently this accounting approach is not likely to play a role in future accounting.
India and China have committed to intensity targets. Intensity targets are defined as policies that
specify emission reductions relative to productivity or economic output (Herzog et al., 2006). In
India’s and China’s cases the targets are relative to the respective GDP. From the economic
perspective the advantage of intensity targets is that they do not penalize economies for economic
growth (Kolstad, 2004). This is an aspect which is highly relevant for emerging economies like China
and India that fear the consequence of absolute targets like emission caps. Regarding the goal to
keep global emissions within the 2°C corridor of global warming, intensity targets have to been seen
more critically. Kolstad (2004) found that ‘in order to stabilize greenhouse gas concentration, the
rate of decline in intensity must equal the rate of growth of GDP’. Otherwise they create high
uncertainty about the human impact on climate as the emissions are a function of uncertain
economic variables. PBL (2015) found in its projections that the 2020 intensity targets from India
and China will lead to an overall increase in emissions as shown in Figure 2 for India. The graph
displays historical and projected emissions in emission intensity per GDP (left) and overall emission
development (right). The curves show historic emissions and different BAU scenarios and the
coloured range the development under current policies. The dot indicates the Indian 2020 pledge
of minus 22-25 % emission intensity.Summary of the INDC assessment: results and conclusions 19 Figure 2: Historical and projected emissions for India in emission intensity per GDP (left) and overall emission development (right). Source: Both graphs are taken from PBL (2015). One can see from Figure 2 that while the emissions per GDP are substantially decreasing under the 2020 pledge, overall emissions are still increasing. The same is valid for the Chinese scenario. But in contrast to India, China announced in its INDC that its emissions will peak around 2030 at the latest, which leads to a reversal in the emission trend. From a negotiating point of view, the introduction of intensity targets into UNFCCC negotiations bears the risk that they ‘may open the door for a myriad of other variables to be considered’ which could further slow negotiations down (Dudek and Golub, 2003). The majority of the assessed Non-Annex I parties has chosen relative emission reduction targets against a reference level. Usually, reference levels are based on a business-as-usual scenario and often suggest an ongoing increase in emissions. This leads to relative emission reductions against assumed emissions for a certain future year and can result in additional emissions compared to a historic base year. Regarding the LU sector and especially the REDD+ mechanism, this approach can be evaluated as profitable accounting approach for countries with high historic deforestation rates and assumed ongoing deforestation, when profitable is defined as potential emission reductions with minimal efforts. Therefore the assumptions behind the reference level are critical to evaluate whether the expected future emission is plausible or can result in ‘hot air’ (Hargita et al. 2016). The REDD+ mechanism is explicitly mentioned only in half of the INDCs (Brazil, Colombia, DR Congo, India, Peru) but all assessed countries are engaged in the FCPF and/or UN-REDD program and thus receiving finance to take part in REDD+ (FCPF, 2015; UN-REDD 2015). Beyond the above discussed topics, the INDC analysis has shown that some basic questions regarding the emission data used for defining targets remain, in some cases even the data presented within the INDC was not consistent. For the assessed parties that was the case for Gabon and Peru, but most likely this is also the case for other countries’ INDCs. From nine parties with accounting against a reference level, only two provided reference levels in their INDCs (DR Congo, Gabon). For at least one of these two reference levels, doubts remain whether the reference level is well
20                                                 Summary of the INDC assessment: results and conclusions

established (Gabon). The overall analysis has shown that the data provided in the INDCs is generally
insufficient for a thorough analysis of the potential role the LU sector could play under a post 2020
agreement.

Conclusions

Based on the analysis attached in the Annex of this document, we discussed the overall LU-
information level of the INDCs in the previous section. The heterogeneity regarding national
circumstances, reporting capacities and of course the missing common accounting rules results in a
variety of accounting approaches. It seems that the classic Non-Annex I countries refer to accounting
against reference levels and with that at least could consider LU in form of the already implemented
REDD+ mechanism (although only three of them are explicitly referring to REDD+). Brazil is an
exception with a net-net approach. It has already significantly reduced emissions from forests and
confidently provides an INDC that can be compared to those of the most developed countries. The
remarkable approach of the Republic of Korea to decide on the inclusion of the LU sector later could
imply that it will await decisions on accounting of LU emissions first, and only decide in favor of the
inclusion if those rules are profitable on the national level. The reduction commitments (intensity
target is no accounting approach) of the emerging economies China and India could be interpreted
as signals of stepping out of the group of Non-Annex I, while claiming a special status in future
negotiations and reduction commitments.

We concluded that different reporting capacities of the parties are not necessarily reflected in the
quantity and quality of LU information presented in the INDCs. There is rather the tendency that the
more important the LU sector is for the national emission budget, the more likely it is that
information regarding its role post 2020 is provided, although in varying quality.

The evaluation whether a target is ambitious or not has proved to be a difficult task within this
analysis as information in INDCs are limited. To guarantee the reliability and the quality of present
and future emission data and the reference levels, reviews conducted by UNFCCC experts are
needed, comparable to those under the Kyoto Protocol (see Figure 1). These reviews can result in
the need to recalculate or improve data which in turn can change the absolute amounts of expected
emissions and consequently of the reduction potentials. As the LU sector is an important sector in
most Non-Annex I-countries, recalculations of its emissions have impacts of overall emission
reduction pledges. At the present state, the LU sector remains a source of uncertainty regarding
overall emissions.
References                                                                                            21

References

AUSTRALIA       (2015):      Intended      Nationally     Determined        Contribution,      11.08.2015,
              http://unfccc.int/focus/indc_portal/items/8766.php.
BRAZIL (2014): Brazil’s submission of a Forest Reference Emission Level (FREL) for reducing emissions from
             deforestation in the Amazonia biome for REDD+ results-based payments under the UNFCCC,
             10.2014.
CANADA        (2015):       Intended       Nationally     Determined       Contribution,       15.05.2015,
              http://unfccc.int/focus/indc_portal/items/8766.php.
CAIT (2015): Climate Data Explorer, http://cait.wri.org/, 05.10.2015.
CAT (2015): Climate Action Tracker, http://www.climateactiontracker.org., 05.10.2015.
CLIMATE POLICY OBSERVER (2015): INDC, http://climateobserver.org/open-and-shut/indc/, 13.10.2015.
DUDEK, D.; GOLUB, A. (2003): Intensity targets: Pathway or roadblock to preventing climate change while
            enhancing economic growth? In: Climate Policy 2003, S21-S28.
FAO FRA (2015): Global Forest Resource Assessment Report 2015. Desk Reference. Rome.
FAO-Stat (2014): Statistics Division, Emissions – Land Use – Forest Land, http://faostat3.fao.org/home/E,
            19.09.2014.
FCPF (2015): Forest Carbon Partnership Facility, http://www.forestcarbonpartnership.org/redd-countries-
            1.
HARGITA, Y. (2014): Assessing the relevance of countries and their capacities for reporting forests under
             UNFCCC, Thuenen Working Paper 36, DOI: 10.3220/WP_36_2014.
HARGITA Y., GÜNTER S., KÖTHKE M. (2016): Brazil submitted the first REDD+ reference level to the UNFCCC-
             Implications regarding climate effectiveness and cost-efficiency. Land Use Pol 55:340-347.
IPCC (1996): Revised Guidelines for National Greenhouse Gas Inventories, Intergovernmental Panel on
            Climate Change Guidelines for National Greenhouse Gas Inventories, OECD, Paris 1997.
IPCC (2000): Good Practice Guidance for Land Use, Land-Use Change and Forestry, Intergovernmental Panel
             on Climate Change Guidelines for National Greenhouse Gas Inventories, Japan, 2003.
IPCC (2006): Guidelines for National Greenhouse Gas Inventories, Intergovernmental Panel on Climate
            Change, Washington D.C., USA, 2009.
IPCC (2014): Summary for Policymakers. Edenhofer, O.; Pichs-Madruga, R.; Sokona, Y.; Farahani, E. ; Kadner,
             S.; Seyboth, K.; et al.; Cambridge University Press, Cambridge, United Kingdom and New York,
             NY, USA (Climate Change 2014: Mitigation of Climate Change. Contribution of Working Group
             III to the Fifth Assessment Report of the Intergovernmental Panel on Climate Change).
KOLSTAD, C. D. (2004): The simple analytics of greenhouse gas emission intensity reduction targets, Energy
             Policy 33, 2231–2236.
PBL (2015): PBL Climate Pledge INDC tool, http://infographics.pbl.nl/indc/, 05.10.2015.
PRODES (2014): Taxas anuais do desmatamento—1988 até 2013. Projeto PRODES,Monitoramento da
          Floresta   Amazônica    Brasileira  per    Satélite, RetrievedNovember 5,  2014.
          http://www.obt.inpe.br/prodes/prodes 1988 2013.htm.
22 References
ROMIJN, E.; HEROLD, M.; KOOISTRA, L.; MURDIYARSO, D.; VERCHOT, L. (2012): Assessing capacities of non-Annex I
countries for national forest monitoring in the context of REDD+. In: Environmental Science
and Policy 19-20, 2012, pp 33–48.
UNFCCC (2010): FCCC/CP/2009/11/Add.1, Decision 4/CP.15, United Nations Framework Convention on
Climate Change.
UNFCCC (2012): Decision 1/CP.17. and 2/CP.17. FCCC/CP/2011/9/Add.1., United Nations Framework
Convention on Climate Change.
UNFCCC (2015): Decision 1/CP.20. FCCC/CP/2014/10/Add.1., United Nations Framework Convention on
Climate Change.
UN-REDD (2015): UN-REDD Programme, http://www.un-redd.org/partner-countries.
US (2015): intended Nationally Determined Contribution, 31.03.2015,
http://unfccc.int/focus/indc_portal/items/8766.php.A.1 China – submitted to UNFCCC 2015-06-30 23
Annex
All INDCs are available online: http://www4.unfccc.int/submissions/indc
A.1 China – submitted to UNFCCC 2015-06-30
China is part of the G77+China negotiation block and a heavyweight in climate negotiations. China
caused one fifth of the global emission in 2012 (CAIT, 2015) and therefore is one of the most
important economies when it comes to impact on future emissions. Regarding its LU, China is
conducting an unprecedented afforestation project (China, 2002) and therefore has a high potential
for an increasing sink effect due to growing forest stocks.
With the Copenhagen Accord China declared to voluntary lower its CO2 emissions per unit GDP by
40-45 % by 2020 compared with the 2005 level. China declared to increase forest coverage by 40
million ha and forest stock by 1.3 billion m3 compared with 2005 (UNFCCC, 2011). The Climate Action
Tracker assessed the 2020 goal as follows ‘The 2020 pledge has large uncertainties associated with
its quantification. In general, the resulting emissions level of the intensity pledge depends critically
on future GDP growth.’ (CAT, 2015).
For 2030, China pledged for an intensity target again (emission reduction by 60-65 % per GDP) and
a peaking in emissions by 2030 at the latest (China, 2015). Thus, China considered in their 2030
pledge that depending on the GDP growth, emissions could further increase and committed to a
trend reversal. Regarding the forest sector, China is projecting increasing sequestration in its forest
area up to 2030 (increase in forest stock volume by around 4.5 billion m3 compared to 2005).
Table 6: INDC analysis regarding the LU sector for China – overview.
LU sector considered Y Time frame 2030
All pools included n.d. Accounting method Intensity
Distinct LU sector target Y Reference level, LU n.a.
China INDC: Summary regarding land Use sector (N – no; Y – yes; N/A – not applicable; n.d. – not defined);
Relevant LULUCF aspects requested by the Lima Call for Action, decision 1/CP.20You can also read