The Wages Crisis: REVISITED - Andrew Stewart Jim Stanford Tess Hardy - NationBuilder
←
→
Page content transcription
If your browser does not render page correctly, please read the page content below

The
 Wages
 Crisis:
REVISITED

 Andrew Stewart
  Jim Stanford
   Tess Hardy
the
Wages Crisis:
REVISITED
This report updates and supplements analysis originally contained in the book, The
Wages Crisis in Australia: What it is and what to do about it, edited by Andrew Stewart,
Jim Stanford, and Tess Hardy, originally published by University of Adelaide Press in
November 2018. That original book contained 20 contributions from a wide range of
Australian labour policy scholars and practitioners, documenting the extent, con-
sequence, causes, and potential policy responses to the unprecedented stagnation of
average wages in Australia visible since 2013. This report updates both the data and
policy implications in light of continued weakness in Australian wages since then.

The full original book is available for free download from:
                   www.adelaide.edu.au/press/titles/wages-crisis

About the Authors
Andrew Stewart is the John Bray Professor of Law at the University of Adelaide and
a consultant with the law firm Piper Alderman. A pre-eminent expert on employ-
ment law and workplace relations, he has co-authored recent books or reports on
decent work for interns, digital platform work, and workplace cooperation.

Jim Stanford is Economist and Director of the Centre for Future Work at the
Australia Institute. He is also Honorary Professor of Political Economy at the Uni-
versity of Sydney, and Harold Innis Industry Professor of Economics at McMaster
University in Canada.

Tess Hardy is an Associate Professor at Melbourne Law School, Co-Director of the
Centre for Employment and Labour Relations Law and an Australian Research
Council Discovery Early Career Researcher Fellow.

The authors thank without implication Marilee Hou, Ashwini Ravindram, and Greg
Jericho.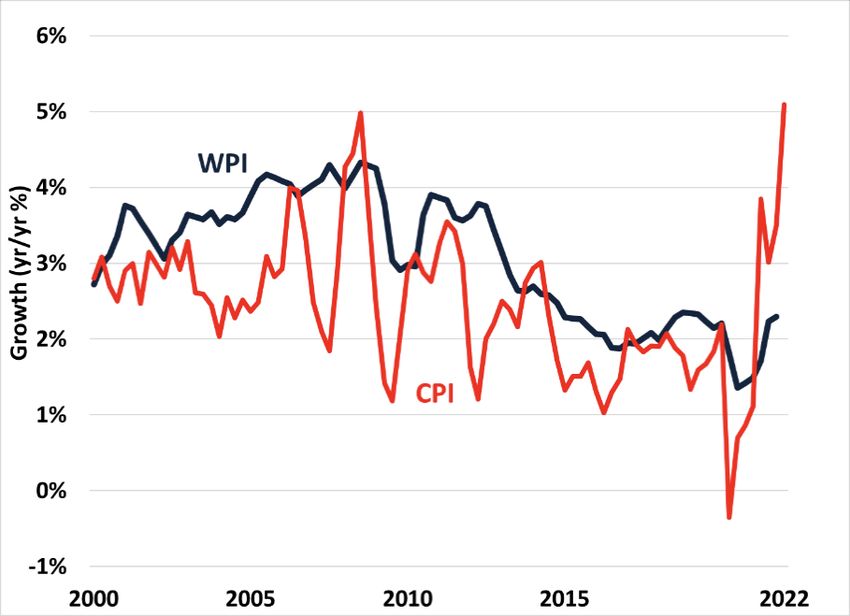
Contents
 Summary                                                               4

 1. Introduction: Wages, Consumers and Recovery                        8

 2. The Aims of this Report: Revisiting The Wages Crisis              11

 3. Charting the Wages Crisis                                         13
     3.1 Indicators of wage growth                                    13
     3.2 Other measures of labour costs                               18
     3.3 Wages and labour market conditions                           20
     3.4 Industry-level perspectives                                  23
     3.5 Wages, inflation and productivity                            24
     3.6 Wages and the COVID-19 pandemic                              27
     3.7 Australian wages in international comparison                 30
     3.8 Summary                                                      31

 4. How Fast Should Wages Grow?                                       33

 5. Tax Cuts Cannot Replace Wage Gains                                36

 6. Policy and Regulatory Weaknesses                                  38
     6.1 Collective bargaining                                        39
     6.2 Statutory wage-fixing                                        43
     6.3 Gender pay inequity                                          45
     6.4 Government wage policies                                     46
     6.5 Wage underpayments                                           49
     6.6 Migrant workers                                               51
     6.7 Fragmented business structures and organisational networks   53
     6.8 Sham self-employment and freelancing                         54
     6.9 Other forms of precarious work                               57

 7. An Agenda for Reform                                              61
     7.1 Ending wage suppression by government                        62
     7.2 Revitalising collective bargaining                           63
     7.3 Strengthening minimum wage regulation                        64
     7.4 Responding to business models that avoid or outsource
         employment responsibilities                                  65
     7.5 Improving compliance with employment standards               67
     7.6 A final word                                                 68

 References                                                           70

                                       3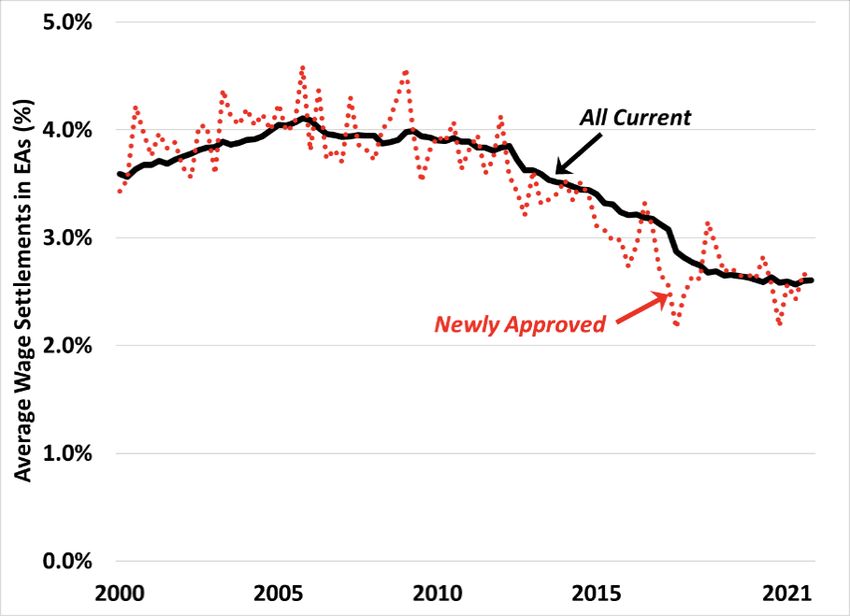
Summary
For several years, nominal                         This report reviews the scale, likely causes,
                                                   and potential remedies for the continuing
wage growth in Australia’s                         weakness in Australian wage determination.
economy has been unusually                         The report is a sequel to a collection of
weak.                                              original research published four years ago:
                                                   The Wages Crisis in Australia: What it is and
Beginning in 2013, the traditional pace of
                                                   what to do about it (Stewart, Stanford and
wage increases decelerated by roughly half:
                                                   Hardy 2018).
from around 4% per year prior to 2013, to an
average of around 2% since then. The nine          This new report begins by providing a
years since 2013 have thus represented the         comprehensive empirical description of the
weakest sustained period of wage growth in         wages slowdown, confirming by several
Australia’s postwar history.                       indicators that the slowdown has continued
                                                   in the years since our 2018 book was
Despite unprecedented disruptions in
                                                   published – including through the
Australia’s labour market during the
                                                   unprecedented events of the COVID-19
COVID-19 pandemic, this weak trajectory in
                                                   pandemic and its aftermath. This evidence
wages growth still predominates. Even with
                                                   suggests that the wages slowdown does not
the unemployment rate falling to a multi-
                                                   seem to be the result of changes in supply-
decade low as the economy re-opened after
                                                   and-demand balances in the labour market,
COVID lockdowns, wage growth has
                                                   which did not substantially differ between
remained stubbornly slow. The
                                                   the pre- and post-2013 periods. Instead,
consequences of wage stagnation are felt in
                                                   explanations for the slowdown are more
numerous areas of the economy: including
                                                   likely to be found in the evolution of certain
household financial pressures, restrained
                                                   structural, institutional, and policy variables
consumer spending, slower government
                                                   affecting wage determination.
revenue growth, and a shift in national
income distribution away from labour and           The report then considers the dimensions of
toward capital.                                    a healthy or ‘normal’ pace of nominal wage

                                               4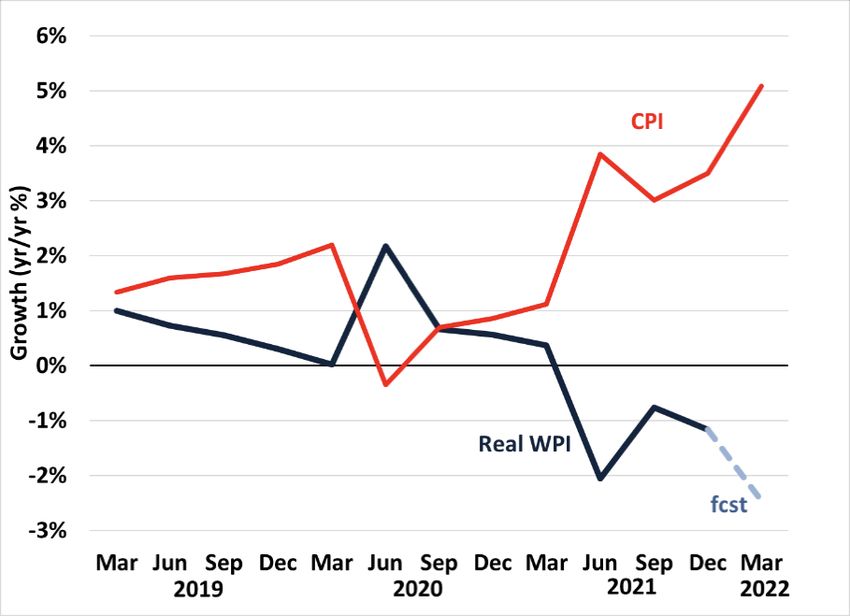
growth, suggesting that wages should grow              there is no guarantee that the tribunal’s
faster than 4% per year in the medium-term             recent willingness to lift minimum rates
in order to restore normal relationships to            will continue. Much will depend on who
inflation, productivity growth, and dis-               is appointed as the President of the
tribution of national income between labour            Commission to replace Justice Iain
and capital. Incremental changes in tax                Ross, who is due to retire in January
policy (such as those advanced in the most             2024.
recent Commonwealth budget) cannot
replace the loss of normal wage increases in         • Gender pay inequity. There remains a
household finances or macroeconomic                    persistent gap between male and female
functioning.                                           earnings, and there is little sign that the
                                                       equal remuneration provisions in the
The report then reviews a range of possible            Fair Work Act can be used to raise
factors that have likely contributed to the            minimum wages in feminised industries.
sustained wage slowdown in Australia since
2013. We focus in particular on the                  • Government wage policies. Governments at
institutions and rules governing the labour            all levels have been actively seeking to
market, identifying nine distinct areas of             restrain wage growth, and not just for
policy and regulatory weakness:                        their own employees (through pay caps
                                                       imposed on public servants).
 • Collective bargaining. Enterprise-level ne-         Compensation in large segments of
    gotiation is meant to be the main way of           broader public and non-government
    gaining a wage increase under the Fair             services has also been depressed by
    Work Act 2009. As union member-ship                government funding and procurement
    has declined, however, so too has bar-             policies. The aged care sector provides
    gaining, to the point where only 11% of            a clear example of how damaging those
    private sector employees are now cov-              policies can be, with the Royal
    ered by a current (non-expired) enter-             Commission into Aged Care Quality and
    prise agreement. Rather than bolstering            Safety recommending that wage
    worker power, the Morrison govern-                 increases should become an explicit
    ment’s 2020 ‘Omnibus Bill’ sought un-              policy objective of aged care funding.
    successfully to weaken the better off
    overall test (BOOT), which protects em-          • Wage underpayments. The underpayment
    ployees from being disadvantaged under             of employees (or ‘wage theft’) has
    an enterprise agreement. A further                 become endemic, harming workers and
    proposal would allow employers to se-              allowing unscrupulous employers to
    cure long-term ‘agreements’ on wages               reap a competitive advantage. The
    for major projects without union or                Omnibus Bill proposed in various ways
    worker consent.                                    to strengthen the Fair Work Act’s
                                                       compliance and enforcement frame-
 • Statutory wage-fixing. In recent years, the         work. But the Morrison government
    annual wage reviews conducted by the               dropped these reforms, despite strong
    Fair Work Commission have been one of              support for them in the Senate.
    the very few ways for Australian
    workers to gain significant wage rises.          • Migrant workers. The number of
    But the minimum wage ‘bite’ (its                   temporary migrant workers fell
    relationship to median earnings) re-               dramatically during the pandemic, but
    mains at a historically low level. And             will rebound in coming months as the

                                                 5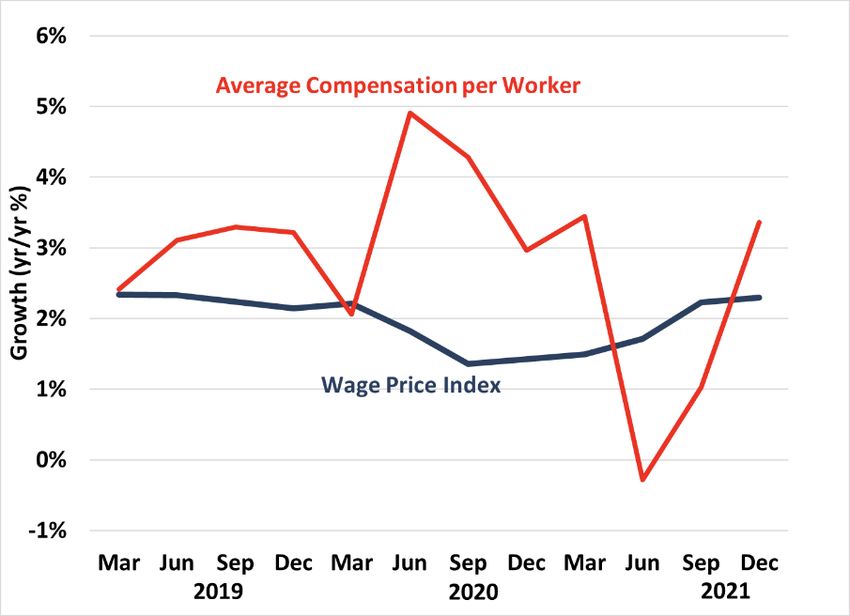
international border is reopened.                       changes in the economy. But there have
  Temporary visa holders remain                           been notable increases in the rates of
  extremely vulnerable to wage theft.                     both multiple job-holding and
  Little has been done to implement                       underemployment. And casual
  recommendations of the Migrant                          employment continues to be overused,
  Workers’ Taskforce that sought to                       with far too many workers in this
  address some of the significant drivers                 category performing work that is not in
  of this exploitation.                                   reality temporary, irregular or
                                                          uncertain. Far from addressing this
• Fragmented business structures and                      problem of ‘permanent casual’
  organisational models. Businesses have                  employment, the Morrison
  increasingly found ways to avoid                        government’s legislative reforms have
  directly employing workers, whether                     entrenched it.
  through subcontracting, labour hire or
  franchising. Such arrangements not                  In our conclusion to the 2018 book, we set
  only reduce the chances of workers                  out a five-point plan to address these
  being organised and engaging in                     various concerns. We remain convinced that
  meaningful collective bargaining, they              important and sustainable improvements in
  can be used to create competition                   wage growth could be achieved through
  amongst suppliers that drives down                  focused, pragmatic action on each of these
  wages. The same can result from                     matters:
  government outsourcing. Little has been
  done to counter this trend by involving              1. End wage suppression by government
  lead firms in supply chain or network                   Governments at all levels should lift
  bargaining, or by imposing liability for                artificial caps on public sector wages,
  underpayments beyond the employment                     support decent wage growth in sectors
  relationship.                                           affected by public funding and
                                                          procurement, and make lifting wages a
• Sham self-employment and freelancing. The               central goal of economic policy.
  proportion of workers who earn their
  primary income from supplying services               2. Revitalise collective bargaining
  as an independent contractor has been                   The rules for the making and approval
  fairly stable over the past two decades.                of enterprise agreements, and for the
  But that may be about to change, with                   taking of protected industrial action,
  two landmark High Court decisions in                    should be simplified. But it should also
  February 2022 rewriting the rules on                    be harder for employers to block
  determining employment status. It                       genuine collective bargaining, by
  should now be much easier for                           addressing issues concerning
  organisations to draft contracts that                   unrepresentative voting cohorts and the
  present workers as being self-employed,                 termination of expired agreements.
  even if in reality there is little to suggest           Consideration should be given to
  they have a business of their own. This                 allowing industry-level or supply-chain
  has obvious implications for attempts to                bargaining in sectors or situations
  regulate the burgeoning ‘gig economy’.                  where there are practical constraints on
                                                          enterprise-level negotiations.
• Other forms of precarious work. Some
                                                          Competition laws should be reformed to
  forms of insecure work have not grown
                                                          enable self-employed workers to engage
  lately, or have fluctuated according to

                                                  6
in effective and meaningful collective            5. Improve compliance with employment
  bargaining. And governments, tribunals,               standards
  unions and business groups should                    To help tackle the systemic
  actively promote a more cooperative                  underpayment of wages, there should be
  approach to workplace relations.                     increased funding for federal and State
                                                       inspectorates and more severe
3. Strengthen minimum wage regulation
                                                       sanctions, either in criminal or civil
  The Fair Work Commission should be                   form. To strengthen deterrence and
  empowered to set a ‘living wage’ target,             improve compliance with employment
  and encouraged to place greater weight               standards, there should be more
  on the needs of the low-paid when                    emphasis on enhancing detection
  reviewing minmum wages. It should                    mechanisms, increasing the use of
  also be required to to look for and                  administrative sanctions, incapacitating
  redress the undervaluation of work                   repeat or egregious wrongdoers, and
  traditionally or predominantly                       harnessing the resources and influence
  performed by women, without needing                  of key third parties, such as lead firms
  to identify male benchmarks or                       and unions. There must also be an
  comparators.                                         accessible forum for the speedy
                                                       recovery of backpay.
4. Respond to business models that avoid
   or outsource employment                         These proposals will no doubt spark
   responsibilities                                dialogue and debate among labour market
  To protect the integrity of minimum              stakeholders, and will require further
  wage standards, there should be a                research and elaboration. But as the
  statutory definition of employment. This         research compiled in this report confirms,
  should presume anyone who agrees to              the wages crisis is a pressing economic and
  supply their personal labour to be an            social issue which demands action. These
  employee, unless there is clear evidence         five initiatives – first advanced in our 2018
  they have an independent business of             book, but just as timely and important now
  their own. Lead businesses should also           – would represent important steps toward
  be included in bargaining and held               this goal.
  responsible for underpayments where
  they exert sufficient influence or control
  over subsidiary employers in a supply
  chain or business network.

                                               7
1.
Introduction:
Wages,
Consumers and
Recovery
For several years,                                             by far the longest-lasting one-sided ‘miss’ in
                                                               the history of Australian inflation targeting.
Australia’s labour market
has experienced unusually                                      For all these reasons, concern over the
                                                               unprecedented and sustained weakness of
slow increases in wages.                                       wage growth has been mounting for years.
From traditional rates of wage growth of                       But that concern took on a new urgency as a
around 4% per year (sometimes stronger),                       result of the COVID-19 pandemic, the
that pace was cut roughly in half after 2013.                  subsequent recession, and then economic
Nominal wage growth has averaged just                          recovery. When the economy began to
over 2% per year in the nine years since                       reopen from the extraordinary initial
then. This unusually slow pace of income                       lockdowns, the mantle of economic
growth has sparked growing concern in                          leadership rested squarely on the shoulders
several areas of economic policy. It has                       of the Australian consumer. Impatient to
contributed to financial stress among                          spend after weeks of health restrictions, and
households, and constrained consumer                           with wallets bulging with extra savings
spending. It has weakened aggregate                            accumulated during the lockdowns,
economic activity, and undermined the                          consumers burst from the gate when shops
vitality of government revenue flows (from                     and restaurants opened again – sweeping
income taxes and the GST). It has made it                      the whole national economy along on a giant
difficult for monetary policy, led by the                      shopping spree. Retail sales grew 16% in
Reserve Bank of Australia (RBA), to achieve                    May 2020 in a single month, and double-
its target inflation rate. Indeed, from                        digit gains were maintained as the year went
September 2014 through to June 2021, the                       on. By the end of 2020, total spending for
year-over-year inflation rate fell below the                   the year was up more than 6% from 2019,
RBA’s 2.5% target for 27 quarters in a row,1                   despite the pandemic. Ironically, for the

1   From Australian Bureau of Statistics (ABS), Consumer Price Index.

                                                           8
year as a whole, 2020 marked the best                            the total expansion in real GDP. Household
growth in retail sales since 2007 – despite                      spending on new residences accounted for
the unprecedented catastrophe of the                             another 15%.4 All told, consumers thus
pandemic.2                                                       carried 95% of the weight of post-COVID
                                                                 recovery.
The resilience and exuberance of Australian
consumers contrasted sharply with the                            Any mechanic knows that an engine can’t
relative weakness of other major economic                        run well on one cylinder. The failure of
engines, such as business investment,                            other critical drivers of economic growth
exports, and even public services.                               (business investment, value-added exports,
Continuing uncertainty kept business capital                     and government services and
spending mired at postwar lows. Exports                          infrastructure) has produced a recovery that
deteriorated in the face of global trade                         is still unbalanced and fragile. And even that
disruptions, even as imports poured in to                        one cylinder, working as hard as it can,
meet the booming demands of Australian                           needs fuel to keep working. Consumers
consumers. The result was a big                                  can’t ramp up purchases for long unless
deterioration in the trade balance. Even                         they have growing real spending power to
government expenditure on programs and                           pay the resulting bills. The initial burst of
capital was relatively subdued. The huge                         post-lockdown consumer spending was
deficits incurred during the pandemic were                       powered by pent-up demand, renewed
mostly the result of transfer payments to                        optimism (interrupted by subsequent waves
individuals and businesses, through                              of COVID), and discretionary savings.5 That
programs like JobKeeper and the                                  initial burst soon petered out, however, and
Coronavirus Supplement to JobSeeker. In                          retail sales began to slow down. Pent-up
contrast, spending on public sector delivery                     demand dissipated, lockdown savings were
and employment grew only modestly, as did                        spent, and confidence was shaken by new
public capital projects.3                                        COVID variants. Making matters worse,
                                                                 after years of historically slow growth in
As a result, consumers accounted for the                         wages, employment incomes (for those
lion’s share of economic growth as the                           Australians who kept their jobs) grew
economy began to recover. In fact, through                       during the pandemic at the slowest pace yet.
the first year of recovery from the initial                      In the face of all these headwinds,
lockdowns (from the June quarter 2020, the                       Australia’s recovery stumbled. GDP
low point of the recession, to the June                          declined again in the September quarter of
quarter of 2021), increased household                            2021, before regaining positive ground at the
consumer spending accounted for 80% of                           end of the year.6

2   All data in this section calculated from ABS Retail Trade, Australia.
3Massive government transfer payments played a vital role in sustaining consumer confidence and spending
through the pandemic. But the government sector’s own consumption and investment (which shows up directly in
GDP) grew just 6% in real terms in the year after the initial lockdowns, compared to the 15% increase in household
consumer spending over the same period (data calculated from ABS, Australian National Accounts, Table 2).
4Counting investment in dwellings and related transfer costs; calculations from ABS Australian National Accounts,
Table 2.
5Paradoxically, personal savings in Australia increased sharply during the pandemic: partly because restrictions
on activity prevented spending, and partly because large government transfer payments more than offset (in
aggregate) the decline in employment income. Not all households, of course, increased their savings; many that
experienced job loss and/or were excluded from income support programs experienced dis-saving through the
pandemic. Data on household savings from ABS Australian National Accounts, Table 20.
6   ABS Australian National Accounts, Table 2.

                                                             9
However, the ongoing crisis in wages has suddenly and autonomously adjust to reflect
now taken on a new and worrisome accelerating inflation. So years of stagnant
dimension, as a result of the sudden nominal wage growth set the stage for the
acceleration in consumer price inflation that present decline in real wages – a
followed post-lockdown re-opening. This devastating development that will inflict
has captured the attention and concern of tangible harm on most Australian
households.
working Australians and policy-makers
alike. After seven straight years of falling For all these reasons, the long-lasting crisis
below the RBA target, the rate of CPI in Australian wages has taken on a new
inflation has surged since mid-2021, urgency, as the national economy grapples
reaching 5.1% year-over-year by the March with the next stages of post-COVID
quarter of 2022. There is no evidence that adjustment and recovery. With continued
rising prices are the result of wage uncertainty in business investment and
pressures. To the contrary, nominal wage exports, Australia’s continued post-COVID
growth has remained subdued, in line with recovery will need sustained support from
post-2013 rates of growth, despite a decline consumer spending – which, after all,
in the official unemployment rate (which accounts for over half of total GDP. Even
fell to 4% by March 2022). Rather, the surge prior to the present surge in inflation,
in inflation clearly reflects unique factors, Australia needed stronger wage growth to
largely external, related to the pandemic validate the consumer spending that has
and other global shocks. These include been the dominant source of economic
disruptions in supply chains, shortages of recovery. Now, with accelerating post-
some products (such as semiconductors and COVID inflation, workers need much higher
building supplies), and huge increases in nominal wages just to stand still.
energy prices following the Russian invasion
In sum, the historic weakness in wages
of Ukraine. The implications for wages,
which has been experienced for almost a
however, are dire: real wages (measured by
the ratio of nominal wages to inflation) fell decade poses a fundamental threat to
by over 2% in the year to March 2022, and Australia’s future economic and social
are poised to fall further in the next year.7 success. Simply hoping that this crisis will
somehow be automatically reversed – if
About the only silver lining from the only unemployment falls a little bit lower, or
previous decade’s gloomy wage trends had deficits are brought under control, or
been that consumer price inflation, most business confidence strengthens, or inflation
years, had been just as slow as, or even is wrestled back down – hasn’t worked for
slower than wages – thus largely preserving nine long years. Confronting and repairing
the real purchasing power of wages. With
the wages crisis will require a more honest
the post-COVID surge in inflation, this is no
and direct approach: first, by acknowledging
longer true. Real wages have begun to fall,
that something has structurally changed in
and quickly. And the failure of the labour
market to produce any significant real wage Australia’s labour market and wage
gains in the preceding nine years has made determination system to explain persistent
that reduction in real living standards all the stagnation in wages, and then by designing
more painful. Without proactive wage- and implementing strong and proactive
boosting policies, there is little reason to policy measures aimed explicitly at getting
believe that nominal wage growth will them growing again.
7Data in this section based on calculations from ABS Consumer Price Index, Wage Price Index, and Labour Force,
Australia.
102.
The Aims of this
Report:
Revisiting
In 2018, five years into the weak, despite a lower unemployment rate
and supposed labour ‘shortages’ arising in
wages slowdown, we some industries, and repeated assurances by
convened a workshop of government that stronger wage growth
leading scholars and would naturally reappear thanks to the
workings of an efficient labour market. Now
employment relations the COVID-19 pandemic, in complex ways,
practitioners, hosted by the has made matters worse. As the national
Adelaide Law School. economy continues to recover, employers,
trade unions, regulators, and policy-makers
Some 20 contributions were presented
confront an uncertain and challenging
exploring the varied causes, consequences,
employment relations landscape. We thus
and possible solutions to the wages crisis.
thought it timely and important to revisit the
Arising from that workshop, we put together
research we organised in the original Wages
a compendium of that research,
Crisis collection. How has the trajectory of
supplemented by additional papers
nominal and real wage growth changed
commissioned afterwards. This work was
since the original publication of that work?
published by the University of Adelaide
Is there reason to believe the wages crisis
Press under the title The Wages Crisis in
will solve itself? And what policy responses
Australia: What it is and what to do about it,
are most appropriate and promising, in
and made available open-access on the
order to restore normal wage benchmarks
internet (Stewart, Stanford and Hardy
and achieve a more desirable and
2018).8
sustainable income distribution in
Four years later, the wages crisis is still with Australia’s economy?
us. Wage growth has remained historically
8 See www.adelaide.edu.au/press/titles/wages-crisis.
11To that end this report, The Wages Crisis: Section 6 revisits several of the policy
Revisited, aims to update our findings from decisions and regulatory failures that were
the 2018 workshop and book, and place them identified in the 2018 book as having
in the context of Australia’s post-COVID contributed to the sustained slowdown in
recovery. The report is organised as follows. wages. It considers what has happened (or
Section 3 provides a comprehensive in many instances not happened) in relation
empirical review of the course of Australia’s to collective bargaining, the setting of
wages, including a detailed analysis of wage minimum wages, gender pay inequities,
changes during the initial lockdowns and wage underpayments, and the treatment of
subsequent recovery. It confirms that migrant workers. It also examines the
nominal wages have demonstrated a weaker failure of governments to respond to the use
structural tendency since 2013, growing of ‘fragmented’ business structures that
consistently slower than would be expected distance workers from the businesses which
given labour market conditions, inflation, ultimately profit from their labour, the
monetary policy, and productivity trends. potential growth of ‘sham contracting’
This has produced stagnant (and now, arrangements that deprive workers of
declining) real wages, consistent employment rights and protections, and
disinflationary pressures, and a decline in other forms of precarious work, such as the
labour’s share of GDP and total factor ‘permanent casual’ jobs which have become
income. such an entrenched feature of Australia’s
labour market.
Section 4 considers appropriate benchmarks
for normal expected wage growth, to set a Finally, in Section 7 we revisit and update
broad context for future wage-boosting five key policy proposals that we outlined in
policies. Section 5 queries whether the 2018 as having the potential to revitalise
economic and distributional consequences wage growth to more normal and healthy
of wage stagnation can be corrected by tax levels. We conclude by calling on all
cuts, aimed at enhancing disposable income stakeholders in Australian employment
within the constraint of flat pre-tax relations to place top priority on targeted,
incomes. The evidence is clear: tax cuts proactive measures to strengthen wage
cannot offset the damage done by sub-par growth, as Australia’s economy traverses
wage growth. the next stages of its post-pandemic
recovery.
123.
Charting the
Wages Crisis
This section of the report index (WPI), calculated quarterly by the
ABS. The WPI aims to provide a measure of
provides a range of ‘pure’ wage inflation. By controlling for
empirical data on the changes in the composition of employment
slowdown in nominal wage (such as shifts in occupation, industry, or job
status), it attempts to capture pure inflation
growth that has been in wages (paid to a fixed basket of
experienced in Australia illustrative workers). Because of this
since 2013. methodology, the WPI may misportray
trends in actual realised labour incomes. For
By several different measures, nominal
example, if the composition of employment
wage trajectories experienced a structural
is shifting toward lower-wage industries,
break, shifting on a sustained basis to
occupations, or job statuses (such as part-
average annual growth rates about half the
time, casual, and other forms of insecure
typical pace experienced prior to 2013. The
work), then the WPI is likely to overstate
implications of this slowdown for other
growth in realised labour incomes. On the
related economic variables – including unit
other hand, if job quality is improving (with
labour costs, national income distribution,
a shift toward higher-paid and more secure
and inflation – are also described.
roles), then the WPI will underestimate
improvements in received labour
compensation.9
3.1 Indicators of wage growth
Figure 1 illustrates the trend in WPI growth
The most commonly reported measure of
(measured on a year-over-year basis, sea-
wage growth in Australia is the wage price
9This methodological aspect of the WPI is important to keep in mind when analysing changes in wages during the
COVID-19 pandemic, as described below.
13sonally adjusted) since the turn of the cen- occurred around 2013. From 2000 through
tury. Nominal wages (adjusted for employ- 2013, WPI growth averaged 3.7% per year.
ment composition) grew at an average of Since then it has averaged 2.1% per year.
3.7% per year through the first years of the This bifurcation of wage trends is visible in
21st Century – and in some years faster than other indicators as well, as discussed further
4%. This pattern was interrupted by a sharp below.
but temporary deceleration during the
global financial crisis (GFC) of 2008–09, Figure 2.
when wage growth slowed to 3%; but wages Wage growth by sector, 2000-2021
then quickly recovered to pre-crisis rates of
increase. After 2013, however, wage growth
slowed more dramatically and persistently.
Year-over-year WPI increases fell to 2% by
2016–17. Nominal wage growth picked up
slightly after that (reaching 2.35% by late
2018), but then declined sharply again dur-
ing the COVID-19 pandemic and resulting
recession. Wage growth fell to 1.36% year
over year (and less than 1% on an annu-
alised quarter-to-quarter basis) in
mid-2020. After the initial reopening (inter- Source: Calculations from ABS Wage Price Index, Table 1
rupted by the Delta and Omicron waves),
WPI growth recovered to its pre-pandemic WPI data is also available by industry and
pace (just above 2%), but remained well be- sector. We consider industry-level trends
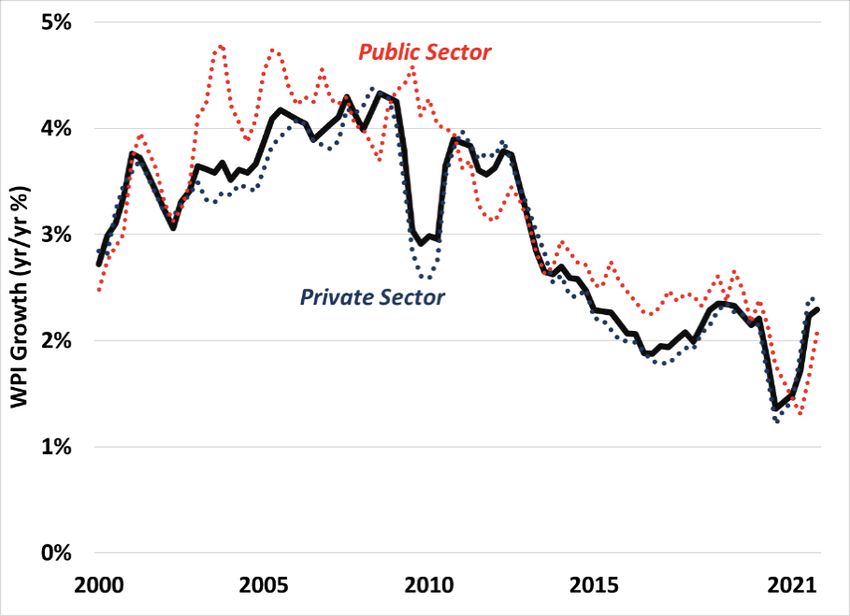
low normal pre-2013 patterns. further below. Figure 2 compares wage
trends in private sector and public sector
Figure 1. workplaces. In general, nominal wage
Wage price index, 2000-2021 growth was weaker in the private sector
throughout the entire period since 2000,
and the deceleration of private sector wage
growth after 2013 clearly preceded a
subsequent slowdown in public sector
wages. This is consistent with the
institutional and political reality of wage
determination in public sector settings.
Governments at all levels have pointed to
weak wage trends in the private sector as
justification for the imposition of wage caps
and other forms of compensation restraint
Source: Calculations from ABS Wage Price Index, Table 1 in public sector workplaces, as discussed
below in section 6.4. By 2021, however,
Figure 1 suggests a clear structural break in wages were growing even more slowly in
the pattern of nominal wage growth that the public sector than in the private sector.10
10 A similar but temporary pattern was visible in 2012–13, when governments (grappling with deficits in the wake
of the GFC) imposed wage restraint in public sector compensation – just as private sector wage growth was
recovering from its previous but temporary downturn. See Henderson (2018) for more discussion of the impact of
this post-GFC public sector wage restraint on the subsequent path of broader wage growth.
14In addition to the WPI, several other 4.4%. That is faster than the average growth
measures of wage growth are published by of the WPI over that same period (3.7%),
the ABS, using different methodologies. indicating wage-boosting shifts in
These measures more directly capture employment composition (toward higher-
realised changes in labour incomes, since paying industries and better jobs) during
they do not attempt to control for changes in that period, as well as strength in
the composition of employment (as does the supplemental compensation (such as
WPI). For example, the ABS series on overtime and bonus payments). The
average weekly earnings (AWE) provides subsequent deceleration in average weekly
semi-annual data on realised earnings by wages after 2013 was initially more severe
industry, and for different categories of than the decline in the corresponding WPI
workers and compensation. Trends in this measure. Growth in AWE fell to barely 1%
series will reflect both ‘pure’ wage inflation, by 2015. This suggests that coincident with
and the impact on wages of changes in the the slowdown in pure wage inflation after
composition of employment (such as 2013, realised wage incomes were also
increases or decreases in the proportion of suppressed by a shift toward part-time,
part-time and casual employment). The casual, and lower-paid jobs. A partial
year-over-year growth in AWE for all recovery in the growth of average weekly
workers is illustrated in Figure 3. wages was experienced in 2018 and 2019,
Figure 3.
reflecting some incremental improvements
Average weekly earnings, in average job quality.
2000-2021
Then, with the onset of the COVID-19
pandemic, average weekly wages suddenly
jumped by over 5% (on a year-over-year
basis). This was due to a shock in the
composition of employment during the
initial lockdowns. Because lower-paid part-
time and casual workers bore a
disproportionate share of job losses, the
average wage for those who remained
employed shifted upward.11 However, once
the economy reopened and those lower-
Source: Calculations from ABS Average Weekly Earnings (annual wage workers (in generally insecure jobs)
averages)
were rehired, the average weekly wage fell.
The AWE series is more volatile than the Despite this volatility during the pandemic,
WPI, in part because it reflects changes in the trend in AWE confirms the post-2013
employment composition, overtime structural shift in wage patterns. In fact, by
earnings, bonuses, and other factors that are this measure that shift was more severe
filtered from the WPI’s measure of narrow (with a 2.2 percentage point deceleration in
wage inflation. But the trend in AWE is average annual wage growth) than
similar to the bifurcated pattern evident in according to the WPI series (1.6 percentage
the WPI series. From 2000 through 2013, points).
AWE grew at an annual average rate of
11The impact of the COVID-19 pandemic on nominal and real wage growth will be considered in further detail
below, and is also documented by Stanford (2021).
15Another useful measure of wage trends can annual average rate of 4%. Again, this is
be derived from the ABS’s quarterly faster than the average growth in the WPI
national income statistics. In the course of during this period, reflecting the impact of
measuring GDP by income, the ABS tallies wage-boosting changes in employment
total labour compensation accruing to composition (excluded by design from the
employees. This can be compared to the WPI). A shortlived slowdown in average
number of employees working each quarter compensation per employee during the GFC
to generate a measure of average was quickly reversed, and compensation
compensation per worker.12 This series rebounded during the subsequent two years
shows even more dramatic fluctuations, due at a robust rate (over 5%). Growth in
to changes in its various (separately average compensation then fell sharply after
measured) components (see Figure 4). Since 2013, to just 2% on average from 2013
it portrays aggregate employee through 2021. A spike in compensation
compensation for all jobs, it captures the growth in the initial COVID lockdowns (for
impact of changes in employment similar compositional reasons as described
composition and job quality (similar to the above for AWE) was quickly reversed as the
series on AWE). A shift toward more part- economy reopened. Again, this series
time employment, for example, obviously confirms that nominal compensation growth
reduces compensation per employee – both for Australian employees was halved after
because of the fewer hours worked by part- 2013: from 4% per year in 2000–2013, to 2%
timers, and the lower hourly wages paid. per year since then.
Figure 4. Workers covered by a collective agreement
Average labour compensation fared better during the post-2013 wage
per employee, 2000-2021 slowdown,13 although a lasting deceleration
of wage growth is also clearly visible in
negotiated wage increases. Figure 5
illustrates annualised average wage
increases (AAWI) in federally-registered
enterprise agreements.14 The black line
shows the average across all current
enterprise agreements (that is, those which
have neither expired nor been terminated);
the red line shows the average in newly
approved agreements. Since 2013 average
Source: Calculations from ABS National Accounts, Table 24 wage gains in newly approved deals usually
(annual averages)
fell below the average for all current
Over the 2000–2013 period, nominal agreements, hence pulling down the overall
compensation per employee increased at an AAWI (as newly approved agreements, with
12This series, appropriately, considers only waged employees, not self-employed workers whose income is
accounted for in GDP statistics as mixed income.
13As discussed below in section 6.1, the share of workers covered by a current enterprise agreement has declined
rapidly since 2013, and the erosion of collective bargaining has certainly been an important factor in the overall
wage slowdown. Kylon (2018) discussed this issue in our initial collection.
14Figure 5 excludes non-quantifiable wage provisions (such as those tied to CPI or minimum wage changes) and
enterprise agreements regulated by State governments (primarily State-level public service agreements in States
other than Victoria).
16Figure 5. enterprise agreements have fared somewhat
Wage gains in enterprise agreements, better – but there, too, average wage growth
2000-2021 is slipping steadily. Table 1 summarises the
broad averages for these four wage
indicators across the two sub-periods of our
analysis.
The ABS initiated its WPI series in 1997, and
hence it does not permit a longer-term view
of the evolution of wage trends. However,
other ABS series are available over longer
time periods, and they confirm that the
sustained post-2013 slowdown in nominal
Source: Attorney-General’s Department, Trends in Federal
wage growth has been historically unique.
Enterprise Bargaining (federally registered agreements only) For example, AWE data is available in
various formats dating back to 1949.15 From
lower wage increments, gradually replace that point through 1990, AWE in Australia
older expired agreements). From average grew at an average annual rate of almost 9%
wage gains of 4% in the latter 2000s, wage – and even faster during the 1970s (13% per
increases in enterprise agreements have year). In 1992, in the wake of a painful
slowly flattened, reaching 2.6% in 2020 and recession and deliberate wage restraint
2021. As with the WPI, negotiated wage measures, annual wage growth temporarily
gains have generally been
slightly stronger for public Table 1.
sector deals (which now Indicators of wage growth, Australia, 2020-2021
account for over one-third of 2000-2013 2013-2021 Change
all enterprise agreement- (%/yr) (%/yr) (%pts)
covered workers in WPI 3.65% 2.11% -1.54%
Australia). In 2020 and 2021,
AWE 4.36% 2.17% -2.19%
however, public sector wage
gains fell below private sector Compensation per employee 4.03% 2.03% -2.00%
trends due to wage caps and Average wage gains in
3.87% 3.01% -0.86%
other restraints imposed by enterprise agreements
federal, State and Territory Source: Calculations from ABS Wage Price Index, Average Weekly Earnings, and National
governments. Accounts; Attorney-General’s Department, Trends in Federal Enterprise Bargaining
According to all four of these indicators, slowed to below 1% – but wages quickly
therefore, Australia experienced a marked rebounded as the economy recovered,
deceleration of nominal wage growth that recovering to 4% by 1994. The ABS’s
began around 2013. From average annual average compensation per employee
rates of around 4% (and sometimes higher), measure extends back to 1978. From 1978
wage growth fell by about half: to around 2% through 2000 that indicator of
on average since 2013. Workers covered by compensation grew at an annual average
15A composite historical series on average weekly earnings can be assembled from several overlapping sources,
including the ABS Average Weekly Earnings series (which dates back to 1994, with a series break in 2012); previous
ABS series 6302.0, 6304.0, and 6350.0; and historical data from the RBA (1997).
17rate of 6.2%. Both these longer-term series is volatile, driven mostly by
empirical series confirm therefore that the significantly changes in estimated
post-2013 wage slowdown has been by far productivity (which itself is a ratio of
the most severe and sustained in the entire separate estimates of total output and total
postwar era. employment).
Nominal unit labour costs are a useful
measure of the underlying inflationary
3.2 Other measures of labour pressure arising from labour costs (which
costs are the most important single cost of
In addition to the four direct measures of production in most industries, and in the
wage compensation reviewed above, other economy as a whole). In general, nominal
indicators further confirm the sustained unit labour costs should increase at
deceleration of wage growth and labour approximately the same pace as the Reserve
costs after 2013. The ABS national accounts Bank’s inflation target (2.5%), thus
system reports changes in nominal labour providing an underlying foundation for
costs for employers (including inflation at the desired pace. In the first
superannuation and other employment- portion of Figure 6, covering the 2000–13
related expenses), adjusted for changes in period, nominal unit labour costs grew at an
the productivity of workers. This ratio is average pace very close to target inflation
defined as the unit labour cost, and indicates (2.8% per year). That fell within the RBA’s
how labour costs are changing relative to target band.16 Not coincidentally, overall
the value of output. It is thus an important CPI inflation in this period followed a
indicator of the impact of wage changes on similar trend, with consumer prices also
overall production costs, prices, and factor rising 2.8% per year on average. After the
income shares. Figure 6 illustrates the year- post-2013 deceleration in nominal wage
over-year growth in nominal unit labour growth, however, nominal unit labour costs
costs, as reported quarterly by the ABS. The slowed to less than half that pace: rising at
just 1.3% per year, barely half of the RBA’s
Figure 6. inflation target and well below its band. CPI
Nominal unit labour cost, inflation in Australia also fell below the
2000-2021 RBA’s target range for most of this period,
averaging 1.8% per year from 2013 through
2021. The RBA has indicated that the
unusually slow growth of wages and
nominal labour costs has been a major
barrier to its efforts to achieve the desired
2.5% inflation target (Lowe 2018).
Figure 6 reveals the sharp fluctuations in
nominal unit labour costs that were
experienced during the COVID-19
pandemic. Initially unit labour costs fell
Source: Calculations from ABS National Accounts, Table 42
(annual averages) dramatically – in large part due to the effect
16The RBA tries to keep inflation within one-half percentage point either direction of its 2.5% target – in other
words, between 2% and 3% per year.
18of powerful wage subsidies (through the As indicated in Figure 7, real unit labour
JobKeeper program) offered by government costs have declined steadily through most of
to encourage employers to retain employees the last two decades. Even before the
who were not needed in light of health deceleration in nominal wages after 2013,
restrictions on many businesses. Nominal real wages were already increasing more
unit costs then bounced back rapidly with slowly than real labour productivity. Real
economic reopening and the cancellation of unit labour costs flattened for several years
those subsidies. Considered over the whole after the GFC in 2008–09 – mostly because
period of the pandemic, however, nominal of a reduction in productivity growth
unit labour costs have increased at the following the 2009 economic slowdown. But
restrained, pre-pandemic pace. They grew real unit labour costs declined again in the
at an annual average rate of 1.75% from the latter half of the 2010s, and even further
end of 2019 through the end of 2021 – still during the COVID-19 crisis. Real unit labour
below the RBA’s target band. There is no costs first dropped steeply during the initial
evidence in the pattern of nominal unit COVID lockdowns (reduced again by
labour costs, therefore, that the current JobKeeper subsidies), and then partially
surge in consumer prices can be attributed rebounded as the economy reopened. By the
to labour costs – which have clearly lagged, end of 2021 they had settled at a level
not led, the acceleration of inflation. significantly below their pre-pandemic
starting point.18 By late 2021 real unit labour
Another perspective on labour costs is costs were 10% lower than at the turn of the
provided by ABS data on real unit labour century. This continues a longer-run decline
costs. This series adjusts both wages and in real unit labour costs (and labour’s share
productivity for changes in prices, and thus of total output) that dates back to the 1970s.
provides an indicator of both inflation
pressures and distributional trends. If real Figure 7.
wages are growing more slowly than real Real unit labour cost, 2000-2021
labour productivity on average, then real
unit labour costs will decline. This implies a
decline in the labour share of total output.17
That creates economic space for increased
profits, even without changes in the rate of
inflation. Similarly, if real wages grow faster
than real labour productivity, then real unit
labour costs increase, labour’s share of total
output increases, and firms may feel
pressure to increase prices (to protect profit
margins).
Source: ABS National Accounts, Table 42
17Indeed, when measured in percentage terms (rather than as an index, as in Figure 7), real unit labour cost is
equivalent to the labour share of output.
18 The sharp swings in both nominal and real unit labour costs during the pandemic also reflected big changes in
recorded labour productivity. Apparent labour productivity increased significantly during the lockdowns (because
a disproportionate share of job losses were initially experienced in low-productivity service industries like retail
and hospitality), and then declined as economic activity recovered after re-opening (see ABS Australian National
Accounts, Table 24). That produced an initial decline in both nominal and real labour costs, reversed when the
economy re-opened.
19If real labour productivity is growing faster The labour share then declined again with
than real wages (and hence real unit labour the COVID-19 pandemic and resulting
costs are declining), this implies an erosion recession: partly because labour
in the share of total national output received compensation weakened (due to reduced
in the form of labour compensation employment), and partly because corporate
(including wages, salaries, superannuation, profits increased strongly during the
and other forms of compensation). This is pandemic. The labour share hit post-war
confirmed by separate ABS data on the record lows during the pandemic.
distribution of national income between
factors of production. It shows a sustained
redistribution of income away from labour
toward capital. As illustrated in Figure 8,
3.3 Wages and labour market
labour’s share of total factor income in the
conditions
economy19 has declined markedly since the Evolving wage trends are commonly
mid-1970s, falling by about 12 percentage attributed to changes in supply and demand
points of the total (from 62% to just 50% by conditions in the labour market. If there is
2021). not enough labour demand arising from
employers, and willing workers are unable
Figure 8.
to find work, then wages will supposedly
Labour share of factor income, moderate to facilitate a better balance
1975-2021
between supply and demand. The reverse
should be true if labour demand is strong
and unemployment is low. This conventional
understanding views the labour market as
essentially similar to markets for other
commodities: competitive forces should
cause price adjustments (in this case,
changes to the price of labour) that push the
market toward equilibrium.
Unfortunately, however, conventional
Source: ABS National Accounts, Table 24 supply-and-demand analysis does not shed
much light on the visible deceleration in
The labour share of total factor income wage growth in Australia that occurred after
depends not only on trends in wages, but 2013. Broad macroeconomic and labour
also on returns to other factors – most market conditions did not differ
notably profits on capital. The decline in significantly across the two periods
profitability of some Australian industries considered in our analysis. Yes, Australia
following the 2014 downturn in global experienced a significant recession (its first
commodity prices temporarily boosted the in three decades) in 2020 during the
labour share in subsequent years. That was COVID-19 pandemic. But the employment
reversed as corporate profits recovered. recovery after the lockdowns ended was
19 Factor income equals the sum of income received by factors of production (labour and capital). It equals GDP
less indirect taxes net of subsidies on production and imports. Capital income includes operating surpluses for
incorporated businesses, and a share of the mixed income of unincorporated businesses (held to reflect return to
proprietors’ capital, rather than their work).
20swift. And Australia had also experienced a Curve relationship was imperfect, and
major slowdown and near-recession during explained only a small portion of wage
the previous period (namely, the 2008–09 growth. Even when unemployment was
GFC), with negative but temporary effects high, for example, nominal wage growth
on wage growth. On average, never fell below 3%.
macroeconomic indicators differ little
between the two periods defined above. Figure 9.
Average unemployment was only slightly
Wage growth and unemployment,
higher across the 2013–2021 period (5.7%) 2000-2021
than in the preceding dozen years (5.4%).20
It seems doubtful that the historic
deceleration in wages after 2013 can be
blamed on a change in supply and demand
balances in the labour market.
The case for a structural shift in wage
determination patterns after 2013 is
strengthened by an analysis of the
relationship between nominal wage growth
and unemployment. In the conventional
‘Phillips Curve’ understanding, there should
Source: Calculations from ABS Wage Price Index, Table 1, and
be a predictable negative relationship Labour Force, Table 1
between the two: lower unemployment leads
to faster nominal wage growth, and vice After 2013, however, this Phillips Curve
versa. Monetary policy is informed by this shifted downward (so that wage growth was
understanding, with the goal (in an inflation lower at all levels of unemployment) and
targeting regime) being to keep lost all of its explanatory power (as
unemployment at or above a rate (the Non- indicated by the red line of Figure 9). In
Accelerating Inflation Rate of fact, were it not for a single observation
Unemployment, or NAIRU) consistent with associated with COVID lockdowns (2020),
stable inflation at or near the central bank’s the relationship between wage growth and
target.21 Comparing unemployment rates unemployment has been perversely positive
and wage inflation (measured by yearly since 2013: in other words, lower
average WPI growth) in the 2000–2012 unemployment was generally associated
period indicates a modest Phillips-type with slower wage growth during this period.
relationship (indicated by the blue line in So while reducing unemployment remains a
Figure 9). Wage growth was somewhat vital economic and social priority, this
stronger in the latter 2000s (up until the evidence suggests that Australians cannot
GFC), when unemployment was at or below rely on tightening labour markets alone to
5%. Wage growth was somewhat lower in solve the wages crisis. More direct
most years when the unemployment rate measures are necessary to strengthen wage
exceeded 6% (particularly in the early growth, regardless of prevailing
2000s). Even before 2013, this Phillips unemployment levels.
20 Calculations from ABS Labour Force, Australia.
21See Richardson (2019) for a theoretical and empirical critique of the conventional NAIRU model as practiced in
Australia.
21Some researchers (such as Lewis 2017, 3%. But after 2013 the curve shifts
Eslake 2021, and Jericho 2022a) have downward (so that wage growth is
suggested that the traditional unemployment significantly slower for any given utilisation
rate is no longer an accurate indicator of the rate than in the earlier period), and loses
true state of overall labour market slack. much of its predictive power.22
Changes in working arrangements have
produced other pools of underutilised We believe the longer-term increase in
labour that are not captured in the underemployment in Australia is indeed
conventional unemployment rate – such as relevant to the slowdown in wage growth,
individuals who are employed but working albeit for reasons that differ from the
fewer hours than preferred (known as conventional conception of
underemployment). The ABS generates a underemployment as an indicator of supply-
broader alternative measure of demand imbalance. Most underemployment
underutilisation which includes both is experienced by individuals in non-
unemployment and underemployment. It is standard and generally quite insecure work
plotted against annual WPI growth in Figure arrangements: including casual jobs, part-
10. time roles, and precarious forms of self-
employment (especially unincorporated
Figure 10. own-account small businesses, in which the
Wage growth and underutilisation, proprietor has no employees). Few
2000-2021 individuals in conventional full-time
permanent positions report they would like
to work more hours (hence being
considered underemployed), and they
account for only a small share of total
underemployment. In this context,
underemployment may be more relevant as
an indicator of employment precarity, rather
than supply-demand imbalance; this
conclusion is reinforced by the fact that
underemployment has increased steadily
over recent decades, largely regardless of
Source: Calculations from ABS Wage Price Index, Table 1, and
Labour Force, Table 22 the cyclical condition of the
macroeconomy.23 Workers in casual, part-
This figure also suggests a structural break time, and other non-standard positions are
in wage determination after 2013. Until then, typically anxious to work more hours, but
a stronger negative relationship between they face continuing insecurity in their
wage growth and underutilisation is visible employment tenure; this undermines their
– although even at the highest bargaining power in seeking higher wages.
underutilisation experienced before 2013 In this context, even the weak relationship
(over 13%) wage growth never fell below between underutilisation and wage growth
22Again, the outlying observation for 2020 (when underutilisation was very high due to JobKeeper subsidies and
other measures which kept workers on the payroll even with sharp reductions in hours worked) imparts much of
the apparent Phillips-type trend to the data during the post-2013 period.
23 Figure 21, in section 6.9 of this report, illustrates this secular rise in underemployment.
22You can also read