The Variation of Radiation Effective Dose Rates and Single Event Effect Rates at Aviation Altitudes with Magnetospheric Conditions and Geographic ...
←
→
Page content transcription
If your browser does not render page correctly, please read the page content below
submitted to Journal of Space Weather and Space Climate
                                                   © The author(s) under the Creative Commons Attribution 4.0 International License (CC BY 4.0)

                                                    The Variation of Radiation Effective Dose Rates
                                                  and Single Event Effect Rates at Aviation Altitudes
arXiv:2212.08229v1 [physics.app-ph] 16 Dec 2022

                                                   with Magnetospheric Conditions and Geographic
                                                                       Location
                                                          C. S. W. Davis1 , K. Ryden1 , F. Lei1 , B. Clewer1 , A. Hands1 , C. Dyer1,2

                                                      1   University of Surrey
                                                      2   CSDRadConsultancy

                                                                                                   ABSTRACT

                                                      The geographic structure of radiation dose rates at aircraft altitudes in Earth’s atmosphere dur-
                                                      ing the irradiation of Earth by proton spectra from incoming solar particle events is examined
                                                      using the recently developed MAIRE+ software. Conditions are examined under two incoming
                                                      proton spectra, a low/hard spectral index and a high/soft spectral index spectra, which are rep-
                                                      resentative of some of the solar particle events that have caused reasonably sized Ground-Level
                                                      Enhancements/Events (GLEs) over the past 70 years. It is found through the use of ‘cut-throughs’
                                                      of the atmosphere, that the atmosphere can be divided into three volumes; a high dose rate polar
                                                      region, a low dose rate equatorial region, and a transition region between the two. The location of
                                                      these regions as a function of latitude, longitude and altitude is characterised. It is also found that
                                                      the location of the transition region changes for different magnetospheric disturbance levels, im-
                                                      plying that the total radiation dose rate an aircraft will experience if it passes through the transition
                                                      region will be subject to large systematic uncertainties, particularly during the currently unknown
                                                      levels of magnetospheric disturbance that a major solar event could cause. The impact that various
                                                      magnetospheric conditions might have on dose rates that specific flight routes might experience is
                                                      also discussed.
                                                      Key words. radiation – aviation – magnetosphere

                                                  1. Introduction
                                                  Radiation dose rates in Earth’s atmosphere are reasonably predictable most of the time. During quiet
                                                  periods of relative solar inactivity, cosmic rays and the secondary particles they produce when pass-
                                                  ing through matter are the main source of atmospheric radiation levels. Cosmic rays originate from
                                                  outside the solar system, and bombard Earth at a roughly constant rate day-to-day, typically only
                                                  varying in intensity on the scale of years as the solar cycle varies. However, every so often events
                                                  such as Coronal Mass Ejections (CMEs) or solar flares can cause the Sun to eject a large cloud of

                                                                                                                                                                  1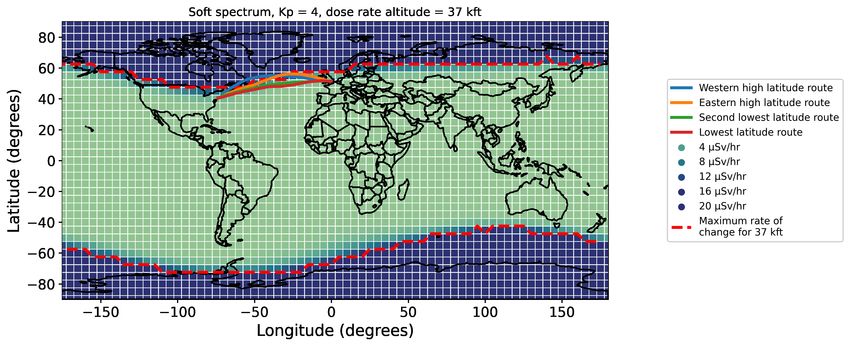
Davis et al.: Rad. Dose Rate Variation with Mag. Conditions and Location, 2023

charged particles. If such an event is sufficiently high energy, such that it would cause significant
radiation increases, it is known as a Solar Particle Event (SPE) (Reames, 2013), or in more common
English, a solar storm. If an SPE happens to hit Earth and is comprised of particles that are suffi-
ciently high energy such that detectable levels of dose-inducing radiation are generated in Earth’s
atmosphere from the event, the SPE can cause what is known as a Ground-Level Enhancement
(GLE) (Poluianov et al., 2017), which is also sometimes called a Ground-Level Event.
   During a Ground-Level Enhancement (GLE), high energy solar particles hitting the Earth’s at-
mosphere generate showers of particles, which can hit both electronics and humans and lead to
radiation effects (Dyer et al., 2020; Hubert et al., 2020; Matthiä et al., 2015). Major GLEs, such as
the GLE of February 1956 (sometimes labeled as GLE05) (Belov et al., 2005), have been known to
induce so much radiation in the atmosphere that it dwarfs the radiation induced by cosmic rays by
orders of magnitude. It is unknown exactly how strong these events can get, as the radiation dose
rate due to GLEs has only been detectable since the 1940s, and only 73 GLEs have been directly
measured to date, as of the time of writing (database, 2022). However recent research into cosmo-
genic radionuclides has revealed several events in the past that have exceeded events such as GLE05
by orders of magnitude (Dyer et al., 2017). If such an event happened today, it could pose a serious
risk to the electronics in planes flying at any particularly susceptible regions of the atmosphere.
   Because GLEs occur on a highly intermittent irregular timescale and only last for several days
at maximum, there are only a few experimental datasets available that directly measured the full
radiation dose experienced by aircraft during such events (Beck et al., 2009) as there are only a
few regular flights that have contained permanently stationed dose rate monitors. MAIRE+, which
is used for the simulations in this paper, was validated against data during the GLEs of 1989 from
CREAM on Concorde (Hands et al., 2022; Dyer et al., 1989). While there are some projects under-
way to develop sensors that are capable of detecting such dose rates (Clewer et al., 2019; Clewer,
2020) while being permanently stationed on aircraft such that they catch an event in action, for the
time being it is necessary to rely on simulation data to understand what might happen during such
events.
   There has been a reasonable level of past research that has been done into the variation of dose
rates during a GLE with location and magnetospheric conditions. Such research in the past has
been generally limited by the computational power available at the time, as both trajectory calcula-
tions within Earth’s magnetosphere and dose rate calculations are quite computationally complex.
It has therefore only been possible to perform full-scale calculations of dose rates on reasonable
timescales and without the aid of high-performance computers in recent years.
   It has been known for a long time from theoretical calculations, simulations and experimen-
tal observations from sources such as the global neutron monitor network (Mishev and Usoskin,
2020) that dose rates generally increase with latitude, and also increase with altitude until about
20 km/65 kft in altitude (this altitude is known as the Pfotzer maximum, and is higher in altitude
than most currently operating commercial aviation) (Grieder, 2001). The increase in dose rates with
altitude below the Pfotzer maximum is caused by the complex physics underlying the penetration
of the atmosphere by incoming particles, and the generation of secondary particles at different at-
mospheric levels. The increase in dose rates with increasing latitude on the other hand, is caused by
Earth’s magnetic field becoming less effective at shielding Earth from incoming particles at regions
closer to Earth’s magnetic poles. This effect is typically quantified by a value at each latitude-
longitude coordinate known as ‘vertical cut-off rigidity’ (also sometimes referred to as effective

                                                                                                    2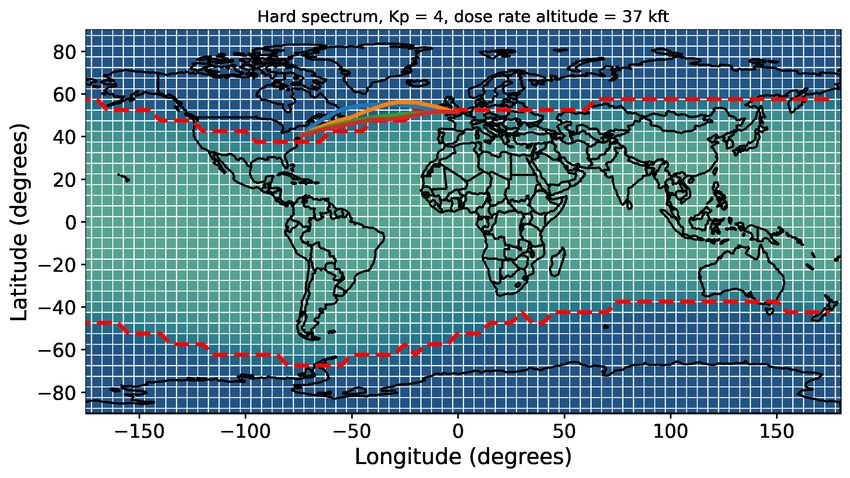
Davis et al.: Rad. Dose Rate Variation with Mag. Conditions and Location, 2023

vertical cut-off rigidity) (Cooke et al., 1991), a parameter that quantifies how difficult it is for a
particle traveling towards Earth to penetrate the magnetic shielding of Earth.
   It is also generally well known that increases in magnetospheric disturbance levels caused by
solar wind and solar storms also generally cause increases in dose-rate across Earth. This is be-
cause disturbances to Earth’s magnetosphere generally cause reductions in vertical cut-off rigidity
across Earth (Smart and Shea, 2005), allowing more dose-inducing particles to penetrate Earth’s
magnetosphere and hit the atmosphere.
   While the general characteristics of how dose rate varies with changes in single parameters and
at single locations are known, there has been little published modern research examining how dose
rates vary as a complex multidimensional function of all geographic location and relevant parame-
ters associated with a solar storm. The atmosphere is a 3-dimensional environment, and so under-
standing the full volumetric picture of dose rates in the atmosphere is crucial for gaining a qualitative
understanding of the atmosphere during GLEs. A knowledge of the big picture for how dose rates
can vary across the atmosphere is especially important for airlines and policy makers, who will have
to provide guidance to pilots on the safe locations to fly, and volumes of the atmosphere to avoid,
during major solar storms.
   Additionally, it is well known that during a solar event of the sort of scale that has not been seen
so far since the invention of proper measurement equipment at the dawn of the space age, levels
of disturbance in Earth’s magnetosphere could reach levels that have never been seen before and
that it is not currently possible to simulate with verifiable accuracy. Therefore building a qualitative
picture of what happens to the volumes of the atmosphere that are associated with certain dose
rates as magnetospheric disturbance increases would be useful for qualitatively understanding what
might happen during a major GLE.
   The work presented in this paper has been therefore performed to examine the full structure of the
radiation dose rate field in the atmosphere during the bombardment of Earth by two representative
simulated spectra of protons that may occur during a GLE, a low spectral index spectrum, and a high
spectral index spectrum. The atmospheric structure of dose rates were examined through the use of
atmospheric ‘cut-throughs’, and the variation of the volumes associated with these dose rates with
changes in magnetospheric disturbance levels were investigated. Only the ambient dose equivalent
rate field is investigated within this paper, however it should be expected that other classifications
of radiation dose rate will exhibit the same or similar atmospheric structure. Specific dose rates that
transatlantic flights will experience during different magnetospheric conditions are also discussed.

2. Methodology
Simulation results were gathered using a variant of MAIRE+(Hands et al., 2022) known as MAIRE-
S. MAIRE+ is a new software that has been developed recently to calculate radiation dose rates at
aircraft altitudes at any time using the current solar and magnetospheric conditions. During quiet
solar conditions, MAIRE+ uses a variant of the ISO model developed by Matthiä et al. (Matthiä
et al., 2013) to determine the cosmic ray spectrum. During high energy solar event conditions,
MAIRE+ adds a ‘GLE’ dose rate component onto dose rates by assuming a rigidity power law
spectrum and applies an algorithm to determine the extra GLE proton spectrum occurring at a
given time(Hands et al., 2022). MAIRE-S is simply a version of MAIRE+ that has been modified
to be able to be programmatically run across historic and user defined solar and magnetospheric

                                                                                                       3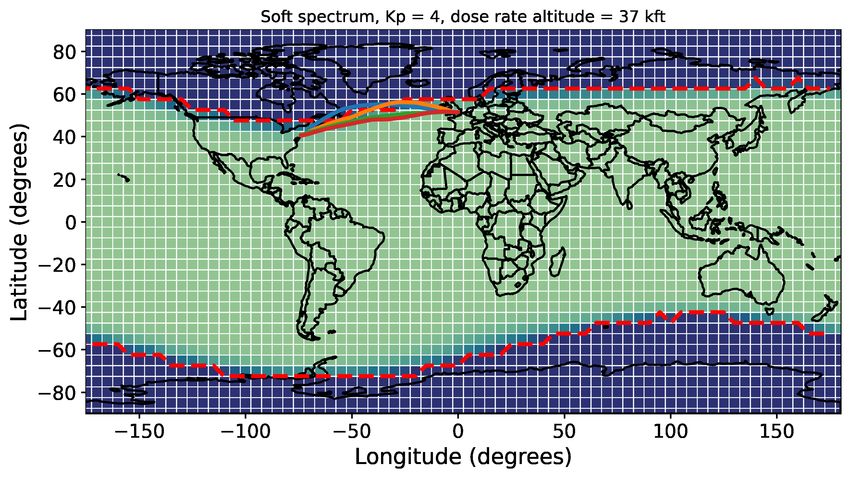
Davis et al.: Rad. Dose Rate Variation with Mag. Conditions and Location, 2023

Table 1: Characteristics defining the spectra used in the simulations described in this paper. GLE
proton spectra were modelled as a power law distribution in rigidity (with units of GV).

                Spectrum label   GLE normalisation factor used   GLE spectral index
                                    (protons/m²/s/sr/GV)
                    ‘hard’               1.69 × 10⁴                      2.65
                    ‘soft’               2.67 × 10⁵                      6.54

conditions. The assumptions that are present in MAIRE+ are therefore the assumptions that should
also be considered with regards to the data presented in this paper. Some of the main assumptions
of MAIRE+ include:
– The incoming particle distribution hitting Earth’s magnetosphere is isotropic. This is true for
  many GLEs, particularly during the tail end of a GLE.

– Vertically incident particles dominate radiation doses, such that vertical cut-off rigidities can be
  used to describe the full effect of Earth’s magnetosphere on dose rates.

– The assumptions present in the Tsyganenko 1989 (Tsyganenko, 1989) magnetic field model and
  the extension to the Tsyganenko 1989 model made by Boberg et al. (Boberg et al., 1995).
   All results in this paper were generated from two single ‘snapshot’ input spectra. The two spectra
and corresponding atmospheric dose rates, and vertical cut-off rigidities, were taken from MAIRE+
simulations of GLE42, which occurred in September 1989. The spectra were chosen somewhat ar-
bitrarily in order to showcase a relatively hard differential power law spectral index, and a relatively
soft differential power law spectral index; due to the variability in GLE intensity the normalisa-
tion factor of the spectra were not considered to be too significant within the scope of this particular
study into the geographic structure and variability of the dose rates. According to Tylka et al. (Tylka
and Dietrich, 2009), spectral indices for most recorded GLEs range between about 3 and 10 (the
spectral indices reported by Tylka et al. are reported in terms of an integral power law and therefore
the number 1 needs to be added to it to get the differential spectral indices used here).
   Only dose rates due to the GLE component of incoming particles were considered here. The total
dose rate would actually be the summation of GLE component + cosmic ray component, however
for the purposes of this study only the GLE component was considered. In any case, during a major
GLE of importance, the GCR component would be dwarfed by the GLE component. This GLE
component was described by a simple power law in rigidity, with the relevant parameters for the
two spectra shown in table 1.
   These two spectra were chosen as representative of periods of time during GLEs where the GLE
spectra might be soft and hard respectively. The spectra given in table 1 where directly taken from
runs of MAIRE-S across GLE42 in 1989, so both spectra are possible in real world scenarios, and
the spectral indicies represent different regions of the potential range of GLE spectral indicies as
aggregated by Tylka et al.(Tylka and Dietrich, 2009). The main parameter of interest for spectra
that may significantly alter the structure of radiation dose rates throughout the atmosphere is spec-
tral index, which will affect how many particles are able to penetrate the atmosphere at different
locations due to cut-off rigidity, and alter the geographic structure of radiation dose rates. The nor-
malisation factors used here are somewhat arbitrary. While the normalisations do represent real

                                                                                                      4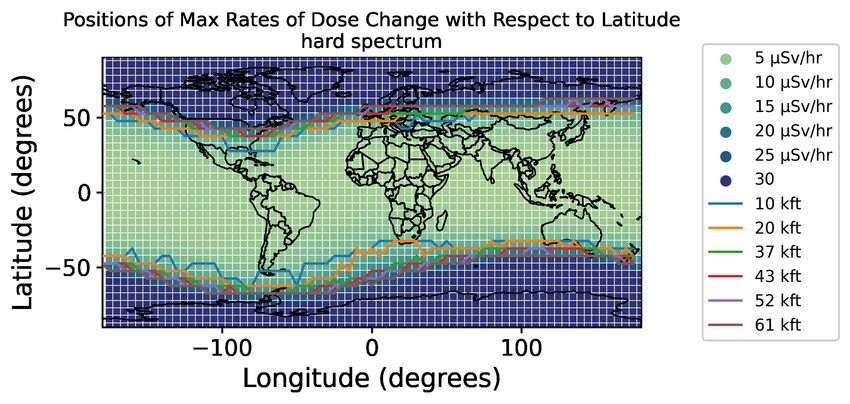
Davis et al.: Rad. Dose Rate Variation with Mag. Conditions and Location, 2023

Fig. 1: An example of an atmospheric ‘cut-through’ as used in this paper. The cut-throughs are effec-
tively atmospheric cross-sections at a particular latitude. The displayed cut-through shows ambient
dose equivalent rates as a function of latitude and altitude at a longitude of 0.0°.

MAIRE-S-predicted normalisation factors during GLE42, they do not affect the structure of dose
rates throughout Earth’s atmosphere, and only act to scale overall dose rates. Normalisation factors
also vary by orders of magnitude between different GLEs.
   Throughout this paper, dose rate ‘cut-throughs’ have been generated using output dose rate maps
generated by MAIRE-S. These cut-throughs are effectively geometric cross-sections of the atmo-
sphere, showing dose-rates as a function of latitude and altitude at a given longitude, as displayed in
figure 1. The term ‘cut-through’ will be used in this paper as opposed to cross-section in an attempt
to prevent possible confusion with the entirely different concept of interaction cross-sections which
are also used in radiation physics.

3. The Variation of Dose Rates as Function of Kp Index
The rigidity cut-off at (50.0°N, 0.0°E) in each of the Kp index simulations is plotted in figure 2 as
a function of date and time. The date and time here correspond to the internal geomagnetic field
between 28/09/1989 00:00 UTC and 30/09/1989 12:00 UTC. As Kp was held constant for each
of these simulations, all variations in the rigidity cut-off are therefore caused by the rotation of
the Earth rather than direct magnetospheric phenomena. Similar results for the magnitude of daily
variation of cut-off rigidity can be found in (Smart et al., 2000) albeit for a different time period,
and at Durham, USA rather than the (50.0°N, 0.0°E) used here.
   figure 2 indicates that the rigidity cut-off at (50.0°, 0.0°) decreases from lows of about 3.0 GV
to lows of below 2.4 GV when Kp index is changed from 0 to 8. This lines up with research on
rigidity cut-offs that has been performed before by Smart et al. (Smart et al., 2006; Smart and Shea,

                                                                                                     5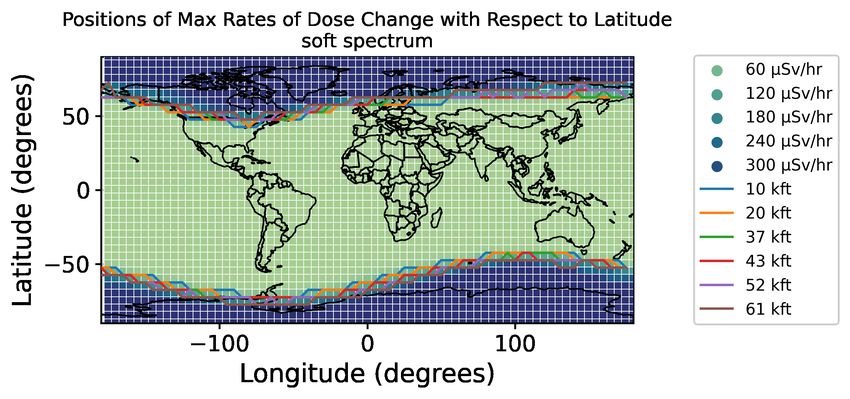
Davis et al.: Rad. Dose Rate Variation with Mag. Conditions and Location, 2023

Fig. 2: Vertical cut-off rigidities as a function of Kp-index and datetime at (50.0°N, 0.0°E). Increases
in Kp index decrease the effective cut-off rigidity by up to approximately 0.7 GV at maximum, and
the vertical cut-off rigidity varies by up to about 0.25 GV across a full day. The curves are somewhat
jagged in this plot due to the relatively granular interpolation with respect to time that MAIRE+ uses
to calculate cut-off rigidities within a day.

2009), as does the general structure of the variation in cut-off rigidity over time shown in figure 2.
One interesting point to note is that the variability of cut-off rigidity over time increases as Kp
index increases here (from a range of approximately 0.1 GV at Kp = 0 to a range of approximately
0.25 GV at Kp = 8), indicating that the time of day may become an important variable in dose rate
calculations at high Kp indices.
   The effect of Kp index on the MAIRE-S GLE dose rates can be seen in the atmospheric cut-
throughs plotted in figure 3. There is minimal variation in dose rate at most regions of the at-
mosphere, except for regions that are already slightly south of the transition region between the
equatorial region of the sky and the polar region.
   Essentially this could be thought of as the transition region moving to lower altitudes as Kp index
increases. While the transition region is relatively narrow with respect to the whole atmosphere, the

                                                                                                      6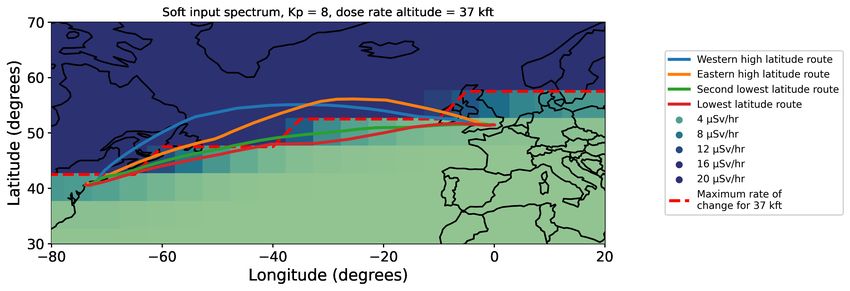
Davis et al.: Rad. Dose Rate Variation with Mag. Conditions and Location, 2023

Fig. 3: Ambient dose equivalent rate atmospheric cut-throughs for multiple Kp indices. The
30 µS v/hr curve plotted shows the overall shape of the high dose rate polar region, and shows
where the region where an aircraft may cross between ICAO thresholds. The main variations in
dose rate with Kp index occur at the lower latitude side of the high dose rate polar region, where
the region expands to slightly lower latitudes as Kp index increases. Note that the color scales for
each spectral case are slightly different.                                                         7
Davis et al.: Rad. Dose Rate Variation with Mag. Conditions and Location, 2023

latitude of the transition region is positioned at a location that a significant proportion of flights
cross daily, such as transatlantic flights for instance. Additionally, and perhaps more importantly,
during a GLE on the scale of a 1 in a 100 or 1 in a 1000 year event, magnetospheric conditions
could reach extreme levels that have never been measured before, such that they could vastly ex-
ceed the magnetospheric upset levels described by Kp = 8, as the physics of such an event is not
well understood yet. The results given in figure 3 indicate that in such an event, the transition region
between high and low dose rates would move southwards, perhaps even approaching latitudes of
50°N, which roughly corresponds to cities such as London, Paris, Brussels and Frankfurt near the
simulated longitude of 0°E in figure 3. The results given here are consistent with similar findings
from Shea and Smart (2005)(Smart and Shea, 2005), where it was found that the latitude corre-
sponding to a given vertical cut-off rigidity decreases with increasing Kp-index, across the entire
vertical cut-off rigidity range.
   figure 4 below displays the percentage increase of ambient dose equivalent rate as Kp index
increases, and further highlights the influence that changing Kp has on radiation dose rates in the
transition area between equatorial and polar regions. It also shows how much more significant the
effect is between Kp=0 and Kp=8, where dose rates within the transition region increase by up to
about 1250% in the soft spectrum case relative to dose rates in the more equatorial region. Dose
rates for the hard spectrum case increase by up to 40% near the transition region at 60 kft altitudes.

4. The Variation of Dose Rate Atmospheric Cut-through Structures as a
   Function of Longitude
In addition to examining how changes in Kp indices affect radiation dose rates, it is also useful to
examine the impact that longitude has on atmospheric cut-throughs. Cut-throughs of the atmosphere
are displayed in figure 5 and illustrate that the main impact of longitude appears to be to move the
cut-off threshold position towards lower latitudes at certain locations, while not significantly altering
the dose rate profile as a function of changing altitude. This effect is caused by the location of the
magnetic north pole differing somewhat from the location of the geographic north pole, which was
positioned over northern Canada in 1989 (and still is today).
   Plots showing the full range of Earth’s latitudes are also displayed in figure 6, so that the quali-
tative full dose rate structure in Earth’s atmosphere can be seen, as well as dose rates above several
southern hemispheric locations.
   figure 5, together with figure 3 highlights the fact that almost the entirety of the geometry for
the event can be described by a narrow transition region which varies with longitude and mag-
netospheric conditions under the approximations and spectra given earlier in table 1. The low
latitude/‘equatorial’ side of this transition region has relatively low dose rates at all altitudes. In
contrast, high latitude/‘polar’ sides of the transition region exhibit high dose rates but with a rea-
sonably consistent profile at constant altitude. It should be noted that this high latitude dose rate
region stretches to much lower latitudes than the auroral region.
   While the transition region between these two areas is reasonably narrow with respect to the
total range of possible latitudes, it still wide enough, on the order of several degrees latitude, such
that some aircraft may spend a reasonable time in the transition region during a flight. While an
aircraft will experience a lower overall dose rate in this region than if it flew exclusively over polar
regions, flying over the transition region would lead to a significant uncertainty in dose rates, given

                                                                                                       8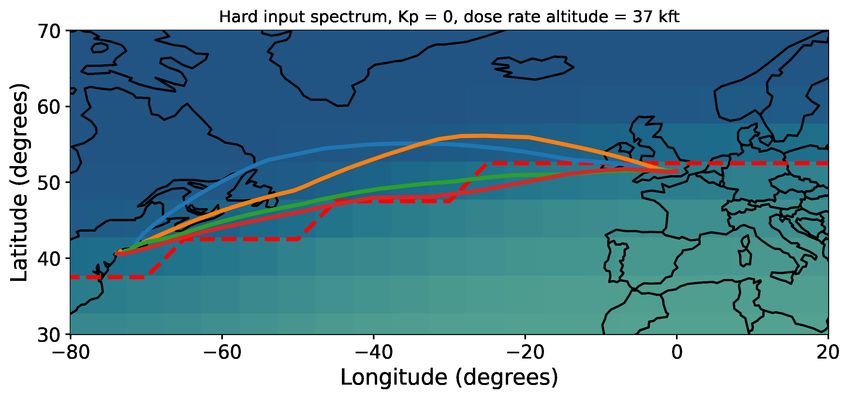
Davis et al.: Rad. Dose Rate Variation with Mag. Conditions and Location, 2023

Fig. 4: Percentage increases in total ambient dose equivalent rate (GCR-induced + GLE-induced)
between different Kp indices. Changes in Kp index between Kp=0 and Kp=8 show increases of up
to 1250% around the transition region between the equatorial and polar areas in the soft spectral
index case. In the hard spectral index case, the percentage increase is only up to approximately 40%
at maximum.

how much dose rates in this region appear to vary with magnetospheric conditions and with flight
latitude. It should also be noted that some of the busiest flight routes in the world pass through the
latitudes associated with this transition region, including most transatlantic Europe to USA flights
for instance. Therefore it is useful to examine the structure and properties of this transition region
in more detail.

                                                                                                    9
Davis et al.: Rad. Dose Rate Variation with Mag. Conditions and Location, 2023

Fig. 5: Ambient dose equivalent cut-throughs for different longitudes. Several cities near to the
plotted longitudes are also displayed for geographic context. There is minimal change in dose rate
with altitude as longitude changes, however the high dose rate polar region stretches and contracts
as longitude changes. At longitude=270.0°E, corresponding to North American airspace, the high  10
dose rate region stretches as far south as approximately 45°N-50°N, due to its closer proximity to
the North magnetic pole in 1989.
Davis et al.: Rad. Dose Rate Variation with Mag. Conditions and Location, 2023

Fig. 6: Cut-throughs of the full range of latitudes above Earth’s atmosphere during hard spectral
index conditions at longitudes corresponding to Cape Town, South Africa and Sydney, Australia.

Fig. 7: The sensitivity of dose rates to changing latitude, expressed in terms of the derivative of
ambient dose equivalent to latitude, ∂H∂θ(10) . The area of maximum sensitivity corresponds to the
                                           ∗

transition area between the equatorial and polar dose rate regions. As was previously indicated in
figure 5, the transition region for longitude=270.0°is at a lower latitude than for longitude=0.0°.

5. The Sensitivity of Dose Rate to Latitude

The transition region described above can be thought of as the region of atmospheric cut-throughs
that are most sensitive to changes in latitude. The appropriate quantity that can be used to describe
the transition region is therefore the rate of change of dose rate with respect to latitude, ∂H∂θ(10) ,
                                                                                                     ∗

where H ∗ (10) is ambient dose equivalent, and θ is latitude.
   ∂H ∗ (10)
      ∂θ
             could be determined using the data for the atmospheric cut-throughs in this paper through
taking the difference between dose rates as latitude changes, i.e. ∂H∂θ(10) ≈ ∆H∆θ(10) . The difference in
                                                                          ∗         ∗

latitudes corresponding to these changes was therefore always 5°, the resolution of the outputted
data here. ∆H∆θ(10) is plotted as a function of latitude and altitude in figure 7 and figure 8.
                ∗

                                                                                                       11
Davis et al.: Rad. Dose Rate Variation with Mag. Conditions and Location, 2023
Fig. 8: The sensitivity of ambient dose equivalent rate to latitude, ∂H
∂θ
, plotted as a function of latitude
and altitude for longitude=0.0°E. Spectrum 1, which was had a lower spectral index, shows a much
wider transition region than spectrum 2, which had a higher spectral index.
figure 7 shows the feature that has been discussed previously; that there is a reasonably thin
transition region which is positioned at a specific latitude that varies with longitude. figure 8 shows
the same data but displayed as a line plot rather than as a cut-through. It is straightforward to see
the location of the transition region as a peak in ∆H∆θ(10) on figure 8. It is interesting to note that
∗
the transition region is significantly wider and less sharp in ‘hard spectrum’ case than in the ‘soft
spectrum’ case. This could reflect how the spectrum is broader in the case of the harder spectrum,
and is therefore susceptible to a broader range of cut-off rigidities than in the softer spectrum case.
In both spectral cases, the latitude sensitivity of dose rates increases significantly with altitude, as
might be expected given that overall dose rates also increase significantly with increasing altitude.
Its possible to use the data in figure 8 to characterise the location of the transition region by
taking the location of the transition region as the latitude at which the latitude sensitivity ∆H∆θ(10) is
∗
at a maximum. Determining the location of the maximum latitude sensitivity for each atmospheric
cut-through gives a curve when plotted on a map as in figure 9. Ambient dose equivalent rates at 37
kft are also plotted on figure 9 for comparison.
figure 9 shows how the location of maximum latitude sensitivity divides the dose rate map into
two regions quite well. Its also interesting to note that the curves of maximal latitude sensitivity
move further from the equator as altitude is increased. This is likely to be due to dose rates at lower
altitudes being less affected by lower energy particles than at higher altitudes, and therefore being
slightly less susceptible to lower vertical cut-off rigidities.
12Davis et al.: Rad. Dose Rate Variation with Mag. Conditions and Location, 2023
Fig. 9: Positions of maximum sensitivity of ambient dose equivalent to latitude, ∆H∆θ(10) |max , plotted
∗
on a dose rate map of Earth’s atmosphere at 61,000 ft. The positions of maximum sensitivity cor-
respond well with the clear transition regions in dose rate between polar and equatorial dose rate
areas that can be observed on the dose rate map. The transition region moves slightly towards the
poles as altitude is increased.
6. Implications for Aircraft, Air Crew, and Airlines
Radiation in general has two consequences for the aviation industry. The first and most well-known
about impact is the effect of radiation on crew and passengers. Pilots and cabin crew consistently
flying through routes that experience high dose rates, such as any flights traveling across the North
13Davis et al.: Rad. Dose Rate Variation with Mag. Conditions and Location, 2023
Atlantic (most transatlantic flights from Europe to North America) are at higher risk of developing
cancer than the general public. This is true during quiet solar conditions, however during a major
solar particle event this effect is even more dangerous to crew, as radiation doses can increase by
factors of 1000 or more. In instances like that, air crew might breach the recommended general
public exposure limit within a single flight (Dyer et al., 2007; Cannon et al., 2013; Tobiska et al.,
2015; Dyer et al., 2017), and could even go well above this during a solar particle event on the
largest scales that research using tree rings and ice cores has indicated have occurred during the last
few millennia (Miyake et al., 2012, 2013; Dyer et al., 2017; Mekhaldi et al., 2015; Kovaltsov et al.,
2014).
The second impact is often less discussed but has a potentially higher impact than crew exposure,
and deadlier. Electronics exposed to radiation can experience device errors (Olsen et al., 1993;
Hands et al., 2009; Cannon et al., 2013; Dyer et al., 2017), including issues known as Single Event
Upsets (SEUs) and Single Event Latch-ups (SELs). SEUs are single errors introduced in electronics,
often memory devices, as a particle passes through it, flipping individual bits.
If a Single Event Upset (SEU) happens in a particularly important part of a device, or if so
many upsets are happening at once that the aircraft electronics are overwhelmed, aircraft electronics
could respond in unknown and dangerous ways. Alternatively, electronic devices may shut down,
potentially leaving pilots to deal with multiple electronics failures simultaneously during extreme
radiation conditions.
Single Event Latch-ups (SELs) on the other hand, represent more permanent damage to devices,
and cannot be fixed by on-board systems. SELs could therefore not only cause electronics to crash
or give false readings, but could actually cause devices to completely fail.
Each of these issues represent a potential immediate threat to aircraft and passengers aboard as
soon as the aircraft enters a region with high enough radiation levels that electronics failures could
occur. Dyer et al. (Dyer et al., 2020) found that modern electronics devices at ground-level may have
a significant probability of failure during an event ten times greater than the GLE that occurred in
February 1956 (21% of silicon power metal–oxide–semiconductor field-effect transistors and 14%
of insulated gate bipolar transistors if the devices are unrated). As has been discussed in this paper,
the single-event effect rate is orders of magnitude greater at aviation altitudes.
MAIRE+ is capable of estimating static RAM (SRAM) SEU and SEL rates at a particular lo-
cation by multiplying its internally calculated >10 MeV neutron flux by cross-sections of 10−13
upsets/cm²/bit and 10−8 latch-ups/cm²/device respectively. These cross-sections are representative
values that are within the range of cross-sections that devices have been shown to exhibit (Dyer
et al., 2020). It should be noted that individual devices have highly variable cross-sections, although
devices with these cross-sections have been used in avionics. Figure 10 and figure 11 below shows
SEU and SEL rates plotted in the same format as the ‘cut-through’ plots above and for the incoming
particle spectra that have been investigated in this paper.
Figure 10 and figure 11 show a very similar relationship between SEU/SEL rates and latitude
as were shown in figure 3 and figure 5 previously. The actual rate of SEUs that aircraft electronics
can cope with at 40,000 feet during an event similar to something like the GLE that occurred in
February 1956 is unknown, as most devices are not tested for these conditions. It is possible that
aircraft electronics are indeed safe under the conditions of a 1 in 100 year intensity radiation storm,
but it is not yet possible to rule out a worst-case scenario where aircraft to the north of approximately
14Davis et al.: Rad. Dose Rate Variation with Mag. Conditions and Location, 2023
Fig. 10: The MAIRE+ predicted Single Event Upset (SEU) rates as a function of latitude and al-
titude at longitude = 0.0°N during the spectral conditions. The threshold of 0.5 upsets/hr/Gb is
primarily a guide to the eye in this plot rather than a hard boundary between some safe level and
some dangerous level.
65°North in latitude (and approximately 50°North above the USA) all suffer multiple electronics
failures simultaneously.
15Davis et al.: Rad. Dose Rate Variation with Mag. Conditions and Location, 2023
Fig. 11: The MAIRE+ predicted Single Event Latch-up (SEL) rates as a function of latitude
and altitude at longitude = 0.0°N during the spectral conditions. The threshold of 1×10⁻⁴ latch-
ups/hr/device is primarily a guide to the eye in this plot rather than a hard boundary between some
safe level and some dangerous level.
The message that airlines should take from this and the earlier plots displaying radiation dose
rates is that during a major solar storm they should endeavour to reduce aircraft altitude, and also
possibly reduce their latitude, depending on what route the flight is taking. This is already somewhat
known to airlines, and has been suggested by other previous papers (Matthiä et al., 2015). ICAO
16Davis et al.: Rad. Dose Rate Variation with Mag. Conditions and Location, 2023
advice does suggest that planes in high latitude regions could attempt to reduce both altitude and
geomagnetic latitude during radiation storms (Organization., 2018). However, this advice is usually
discussed from the perspective of generally reducing the longer term accumulated doses received
by the aircraft crew, rather than addressing the potential immediate threat that SEU/SEL errors pose
to the aircraft. The existence of threats due to high SEU/SEL rates means that speed and urgency
may be paramount once an alert has been issued for a large GLE. This necessary rapidity would
also be currently nearly impossible if this large solar event occurs at the same time as a HF radio
blackout, which would render communication with many aircraft nearly impossible. This is not to
mention the difficulties that would occur with such an event happening at the same time as other
solar storm related effects on society.
What the research presented in this paper adds to this discussion is some clarity over which
strategies could be chosen by an aircraft during a large GLE. For the incoming radiation distribution
discussed in this paper, radiation dose rates were found not to vary significantly with latitude except
at the boundary between the low dose rate, equatorial, region and the high dose rate, polar, region.
Under these conditions most aircraft situated well within the polar region would not benefit much
from changing latitude, and reducing their altitude might be preferable. It should be noted that
flying at lower altitudes can take a significant amount of fuel, so it may not always be possible for
an aircraft to fly at low altitudes underneath a region of high dose rates for long, but an aircraft may
be able to at least do so for long enough to miss the peak of an event.
In contrast, an aircraft traveling approximately along the boundary/transition between the two
dose rate regions (which happens to align approximately with many commonly used transatlantic
routes) might be able to significantly to reduce their radiation dose and SEU/SEL rate by traveling
just a few degrees further south - providing the location of the transition region could be accurately
determined in real time, which would require an accurate real-time determination of magnetospheric
disturbance levels and incoming particle spectral index. Flight routes are constantly updated accord-
ing to atmospheric factors such as zones of high turbulence, and zones of high radiation dose could
simply be considered another factor for such flights in what route they should take.
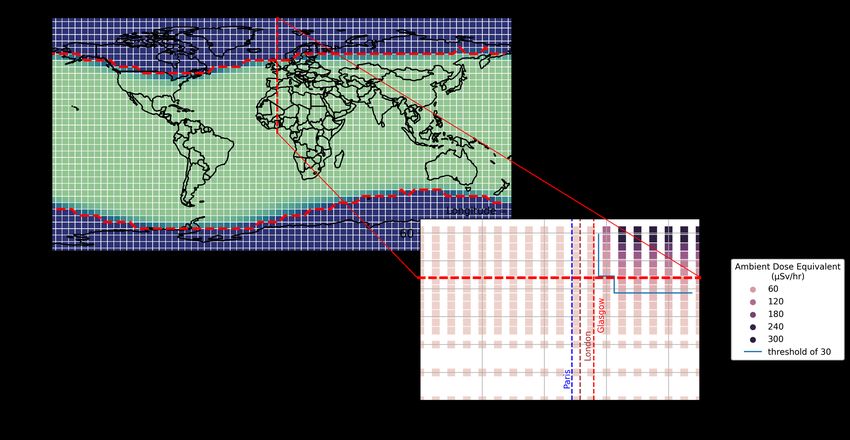
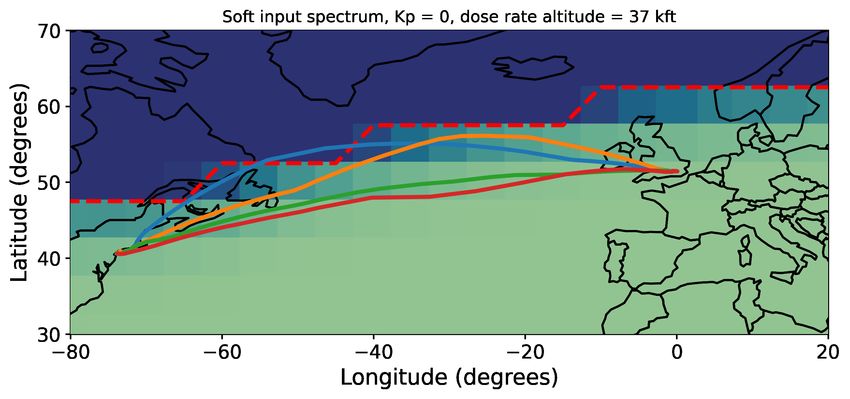
This is illustrated by figure 12, which shows a map of four flight routes heading between
Heathrow airport (London, UK) and John F. Kennedy airport (New York City, USA), as well as
the corresponding dose rates at 37,000 ft from the simulations described in this paper. The lati-
tude and altitude profiles can also be seen in figure 13. These are real flight routes collected from
FlightRadar24 (FlightRadar24, 2022), which flew between 2020 and 2022. It should however be
noted that the ‘time’ on the x-axis does not necessarily correspond with the actual take-off time of
the aircraft, rather the time that Flightradar24 began recording the aircraft’s location. In addition,
the Eastern high latitude flight and the second lowest latitude flight’s time coordinates have been
translated backwards to be 2 hours less than the value given by Flightradar24 for easier comparison
with the other flights on time plots, as the flights took several hours to take-off from the beginning
of Flightradar24’s recording. The lowest latitude flight was actually a flight from New York JFK
to London Heathrow, in contrast to the other flights, which travelled in the opposite direction. The
flight route was therefore reversed in this analysis so that coordinates roughly correspond with those
of the other flight routes (i.e. in the lowest latitude flight case, time represents approximately the
time until landing, whereas in all the other flights, time represents approximately the time from the
flight beginning).
17Davis et al.: Rad. Dose Rate Variation with Mag. Conditions and Location, 2023
Fig. 12: Dose rate maps of Earth at 34,000 ft and the paths of the flight routes that were investigated
in this paper. The maximum rate of change of dose rate with respect to latitude is also plotted to
indicate the location of the transition region between the low and high dose rate regions. In the high
spectral index case, the transition region between the low dose rate ‘equatorial’ region and the high
dose rate region lies between the flight routes.
The routes encompass a range of different latitudes, and it can be seen in figure 12 that in the low
spectral index/soft spectrum case at Kp = 4, some of the flights cross through the transition region
into and out of the high dose regions, while others stay in the low dose rate region for the entirety
of the flight. During the hard spectrum conditions, all of the flights investigated happen to be within
the high dose rate region for Kp = 4.
The dose rates and accumulated doses for these flight routes are displayed in figure 14, table 2,
figure 15 and figure 16, where it can be seen that in the soft input spectral index case, the high
latitude flights are subject to significantly higher dose rates than the lower latitude flights. This is
not the case in the low spectral index/hard spectrum case, which is likely caused by the fact that the
transition region boundary is consistently lower than all the flight routes in the hard spectrum case,
while the high latitude flights cross the transition region in the soft spectrum case.
18Davis et al.: Rad. Dose Rate Variation with Mag. Conditions and Location, 2023
Fig. 13: The latitude and altitude time profiles for the flights shown in figure 12. The lowest latitude
flight was a flight from New York JFK to London Heathrow LHR, in contrast to the other flights
which went from LHR to JFK, and the flight route profile has therefore been reversed for the lowest
latitude flight for better comparison.
Table 2: Peak dose rates and accumulated doses for each of the investigated flight routes and in-
coming spectra. The integrated values were determined through taking the integral over the curves
displayed in figure 14
Western high latitude route Eastern high latitude route Second lowest latitude route Lowest latitude route
Hard spectrum Soft spectrum Hard spectrum Soft spectrum Hard spectrum Soft spectrum Hard spectrum Soft spectrum
Peak dose rate (µS v/hr) 13.35 33.58 10.43 13.14 10.54 7.22 8.52 4.44
Ambient dose equivalent
Accumulated dose (µS v) 82.37 105.8 60.76 41.57 57.19 17.68 40.67 8.62
Peak upset rate (Upsets/hr/Gb) 0.98 3.35 0.74 1.42 0.75 0.76 0.61 0.47
Single event upset rate
Accumulated upset count (Upsets/Gb) 5.89 10.98 4.34 4.47 3.91 1.77 2.74 0.87
Peak latch-up rate (×10−5 Latch-ups/hr/device) 9.76 33.47 7.41 14.21 7.55 7.59 6.09 4.72
Single event latch-up rate
Accumulated latch-up count (×10−5 Latch-ups/device) 58.94 109.8 43.42 44.73 39.05 17.67 27.44 8.71
Accumulated doses were calculated through integrating the dose rate over time for each flight
route. Accumulated SEU and SEL count rates were also found using this method, giving accu-
mulated latch-up probabilities for each SRAM device on the western high latitude flight route of
about 0.06% in the hard spectrum case and 0.11% in the soft spectrum case. These accumulated
probabilities assume a static event with constant spectral conditions taken from two arbitrary snap-
shots within GLE42 in 1989. Taking into the account the fact that aircraft may have many SRAM
devices, that many devices aboard an aircraft may have significantly higher single event damage
cross-sections than SRAMs (Dyer et al., 2020), and most importantly that GLEs can be signifi-
cantly larger than the event used here (The peak GLNM percentage increase in GLE05, February
1956 was approximately 12 times higher than the peak GLNM percentage increase in GLE42, 1989
(Dyer et al., 2017)) means that the probability of many high latitude aircraft experiencing numerous
devices becoming damaged simultaneously may become high during a large ground-level enhance-
ment.
It can also be seen that all flight routes experience significantly higher dose rates at higher Kp
indices in the soft spectrum/high spectral index case. This does not seem to be true in the hard
19Davis et al.: Rad. Dose Rate Variation with Mag. Conditions and Location, 2023
Fig. 14: Dose rate characteristics of the flight routes investigated. In both spectral index cases, the
higher latitude flights experience generally higher dose rates, however in the high spectral index
case the high latitude flights experience significantly higher doses than the low latitude flight.
spectrum/low spectral index case, where high Kp indices only slightly increase dose rates. This is
likely due to the transition region between moving southwards with increasing Kp index in the soft
spectrum case, such that it encompasses a higher percentage of each flight route, an effect that was
previously shown in figure 3 and figure 4. This effect is also shown in figure 17, which shows how
dose rate maps at 37 kft change with varying Kp index for both spectral cases.
20Davis et al.: Rad. Dose Rate Variation with Mag. Conditions and Location, 2023
Fig. 15: The total accumulated/integrated dose for each of the flights as a function of Kp index.
There are only slight variations for each of the selected flights in dose with Kp index in the hard
spectrum case, however there are large variations in dose in the soft spectrum case for all of the
flights.
These results for the high spectral index case in figure 16 and in figure 4 previously complicate
the possible strategy of flying to lower latitudes during a large ground-level enhancement. During
high spectral index conditions, the actual location of the boundary between the low and high dose
rate regions will be subject to a large amount of uncertainty, as it will be highly susceptible to the
current conditions of Earth’s magnetic field and of the spectral index of the solar particle spectrum
bombarding Earth - parameters which currently have a large degree of uncertainty. Previous work
using the QARM model has also made this point by showing the deviation flight route dose rates
can have from those of a great circle route (Dyer et al., 2007). The effect of Earth’s magnetic field
on dose rates that an aircraft might experience is displayed in figure 17.
It should be noted that not every model uses Kp index as an input parameter. However, all models
use complex methods of representing Earth’s magnetosphere and its effect on radiation dose rates in
Earth’s atmosphere. Given how quickly dose rate varies with latitude at the transition region under
the softer spectral conditions in this work, small deviations in simulations of Earth’s magnetosphere
from reality may lead to large errors in dose rate predictions near the transition region and for
transatlantic flights.
This means that at least for the current level of technology and scientific knowledge of Earth’s
magnetosphere, a large buffer zone might have to be assumed a number of degrees south of the
boundary zone location as predicted by current dose rate calculation software. Aircraft attempting
to fly out of the high dose rate polar region would have to ensure they crossed the whole buffer zone
to be reasonably confident of no longer experiencing high radiation dose rates.
Alternatively, the only way for an aircraft to know if and when it has truly crossed into the lower
dose region would be if they are equipped with a multi-particle onboard radiation detector, and the
possibility of equipping all aircraft with radiation dose monitors has been discussed in previous
work (Clewer et al., 2019). Monitors for this purpose were previously used on Concorde aircraft
(Dyer et al., 2003; Bagshaw, 2000), and emergency descent procedures were put in place in case of
high radiation dose rate levels.
21Davis et al.: Rad. Dose Rate Variation with Mag. Conditions and Location, 2023
22Davis et al.: Rad. Dose Rate Variation with Mag. Conditions and Location, 2023
Fig. 17: Dose rate maps around the investigated flight routes for several Kp indices. In the high
spectral index case, the transition dose rate region moves towards lower latitudes with increasing
Kp index, as was previously shown in figure 3, and crosses over the flight routes.
23Davis et al.: Rad. Dose Rate Variation with Mag. Conditions and Location, 2023
7. Conclusions
The results create an overall picture that during a ground-level enhancement, the Earth’s atmosphere
can be divided into three approximate zones; a low dose rate equatorial and low altitude region, a
high dose rate polar and high altitude region, and a transition region between the two.
The properties of the transition region define many of the geometric features of the GLE. The
transition region varies in shape and structure with both the incoming particle spectra and Earth’s
magnetospheric conditions. This transition region is therefore the region where dose rates exhibit
the highest levels of systematic uncertainty and any aircraft flying through this region (such as
transatlantic flights) will experience a highly uncertain radiation dose. This is shown in this paper,
where several flight routes between London Heathrow and New York JFK airports were simulated
to experience significantly different dose rates during the same spectral and magnetospheric con-
ditions. Dose rates for these flights were also shown to vary significantly with Kp index during
relatively soft spectral conditions.
The results presented in this paper indicate that the high dose rate polar region stretches further
south during highly disturbed solar conditions. During extreme ground-level enhancements that
have an intensity on a scale that hasn’t been so far recorded in modern history, Earth’s magneto-
sphere could be significantly more disturbed than has been measured since the dawn of the space
age and the high dose rate polar region in such events may therefore move significantly further
south. It would likely pass closer to the equator than 45°in latitude, particularly over North America
and Australia. This would breach well into the ICAO latitude bands of MNH and MSH (Middle lat-
itudes Northern Hemisphere and Middle latitudes Southern Hemisphere), but specifically at these
longitude regions.
8. Open Research Statement
All of the data used to generate the results and plots in this paper can be found at
https://doi.org/10.5281/zenodo.7410799 along with relevant usage instructions.
9. Funding Information
This research was funded as part of the UKRI SWIMMR SWARM project.
References
Bagshaw, M., 2000. British Airways measurement of cosmic radiation exposure on Concorde supersonic
transport. Health physics, 79(5), 545–546. 6
Beck, P., C. Dyer, N. Fuller, A. Hands, M. Latocha, S. Rollet, and F. Spurnỳ, 2009. Overview of on-board
measurements during solar storm periods. Radiation protection dosimetry, 136(4), 297–303. 1
Belov, A., E. Eroshenko, H. Mavromichalaki, C. Plainaki, and V. Yanke, 2005. A study of the ground level
enhancement of 23 February 1956. Advances in Space Research, 35(4), 697–701. 1
24Davis et al.: Rad. Dose Rate Variation with Mag. Conditions and Location, 2023
Boberg, P., A. Tylka, J. Adams Jr, E. Flückiger, and E. Kobel, 1995. Geomagnetic transmission of solar
energetic protons during the geomagnetic disturbances of October 1989. Geophysical research letters,
22(9), 1133–1136. 2
Cannon, P., M. Angling, L. Barclay, C. Curry, C. Dyer, et al., 2013. Extreme space weather: impacts on
engineered systems and infrastructure. Royal Academy of Engineering. 6
Clewer, B. J., 2020. The demonstration of a smartphone-enabled detector and network for a citizen science
approach to aviation space weather radiation monitoring. Ph.D. thesis, University of Surrey. 1
Clewer, B. J., K. A. Ryden, A. C. R. Dyer, A. D. P. Hands, and D. R. Jackson, 2019. A Citizen Science
Network for Measurements of Atmospheric Ionizing Radiation Levels. Space Weather, 17(6), 877–
893. Https://doi.org/10.1029/2019SW002190, https://agupubs.onlinelibrary.wiley.com/doi/
pdf/10.1029/2019SW002190, URL https://agupubs.onlinelibrary.wiley.com/doi/abs/10.
1029/2019SW002190. 1, 6
Cooke, D., J. Humble, M. Shea, D. Smart, N. Lund, I. Rasmussen, B. Byrnak, P. Goret, and N. Petrou, 1991.
On cosmic-ray cut-off terminology. Il Nuovo Cimento C, 14(3), 213–234. 1
database, G., 2022. GLE database. gle.oulu.fi. 1
Dyer, A., A. Hands, K. Ryden, C. Dyer, I. Flintoft, and A. Ruffenach, 2020. Single-Event Effects in Ground-
Level Infrastructure During Extreme Ground-Level Enhancements. IEEE Transactions on Nuclear
Science, 67(6), 1139–1143. 1, 6, 6
Dyer, C., A. Hands, K. Ryden, and F. Lei, 2017. Extreme atmospheric radiation environments and single
event effects. IEEE Transactions on Nuclear Science, 65(1), 432–438. 1, 6, 6
Dyer, C., F. Lei, S. Clucas, D. Smart, and M. Shea, 2003. Calculations and observations of solar particle
enhancements to the radiation environment at aircraft altitudes. Advances in Space Research, 32(1), 81–
93. 6
Dyer, C., F. Lei, A. Hands, and P. Truscott, 2007. Solar particle events in the QinetiQ atmospheric radiation
model. IEEE Transactions on Nuclear Science, 54(4), 1071–1075. 6, 6
Dyer, C., A. Sims, J. Farren, and J. Stephen, 1989. Measurements of the SEU environment in the upper
atmosphere. IEEE Transactions on Nuclear Science, 36(6), 2275–2280. 1
FlightRadar24, 2022. Flightradar24: Live Flight Tracker - Real-Time Flight Tracker Map. https://www.
flightradar24.com. 6
Grieder, P. K., 2001. Cosmic rays at Earth. Elsevier. 1
Hands, A., C. S. Dyer, and F. Lei, 2009. SEU rates in atmospheric environments: Variations due to cross-
section fits and environment models. IEEE Transactions on Nuclear Science, 56(4), 2026–2034. 6
Hands, A., F. Lei, C. Davis, B. Clewer, C. Dyer, and K. Ryden, 2022. A New Model for Nowcasting
the Aviation Radiation Environment With Comparisons to In Situ Measurements During GLEs. Space
Weather, 20(8), e2022SW003,155. 1, 2
25Davis et al.: Rad. Dose Rate Variation with Mag. Conditions and Location, 2023
Hubert, G., S. Aubry, and J. A. Clemente, 2020. Impact of ground-level enhancement (GLE) solar events on
soft error rate for avionics. IEEE Transactions on Aerospace and Electronic Systems, 56(5), 3674–3684.
1
Kovaltsov, G., I. Usoskin, E. Cliver, W. Dietrich, and A. Tylka, 2014. Fluence ordering of solar energetic
proton events using cosmogenic radionuclide data. Solar Physics, 289(12), 4691–4700. 6
Matthiä, D., T. Berger, A. I. Mrigakshi, and G. Reitz, 2013. A ready-to-use galactic cosmic ray model.
Advances in Space Research, 51(3), 329–338. 2
Matthiä, D., M. Schaefer, and M. M. Meier, 2015. Economic impact and effectiveness of radiation protection
measures in aviation during a ground level enhancement. Journal of Space Weather and Space Climate,
5, A17. 1, 6
Mekhaldi, F., R. Muscheler, F. Adolphi, A. Aldahan, J. Beer, et al., 2015. Multiradionuclide evidence for the
solar origin of the cosmic-ray events of AD 774/5 and 993/4. Nature communications, 6(1), 1–8. 6
Mishev, A., and I. Usoskin, 2020. Current status and possible extension of the global neutron monitor
network. Journal of Space Weather and Space Climate, 10, 17. 1
Miyake, F., K. Masuda, and T. Nakamura, 2013. Another rapid event in the carbon-14 content of tree rings.
Nature communications, 4(1), 1–6. 6
Miyake, F., K. Nagaya, K. Masuda, and T. Nakamura, 2012. A signature of cosmic-ray increase in AD
774–775 from tree rings in Japan. Nature, 486(7402), 240–242. 6
Olsen, J., P. Becher, P. Fynbo, P. Raaby, and J. Schultz, 1993. Neutron-induced single event upsets in static
RAMS observed a 10 km flight attitude. IEEE Transactions on Nuclear Science, 40(2), 74–77. 6
Organization., I. C. A., 2018. Manual on space weather information in support of international air navigation.
6
Poluianov, S., I. Usoskin, A. Mishev, M. Shea, and D. Smart, 2017. GLE and sub-GLE redefinition in the
light of high-altitude polar neutron monitors. Solar Physics, 292(11), 1–7. 1
Reames, D. V., 2013. The two sources of solar energetic particles. Space Science Reviews, 175(1), 53–92. 1
Smart, D., and M. Shea, 2005. A review of geomagnetic cutoff rigidities for earth-orbiting spacecraft.
Advances in Space Research, 36(10), 2012–2020. 1, 3
Smart, D., and M. Shea, 2009. Fifty years of progress in geomagnetic cutoff rigidity determinations.
Advances in Space Research, 44(10), 1107–1123. 3
Smart, D., M. Shea, and E. Flückiger, 2000. Magnetospheric models and trajectory computations. Cosmic
Rays and Earth, 305–333. 3
Smart, D., M. Shea, A. Tylka, and P. Boberg, 2006. A geomagnetic cutoff rigidity interpolation tool: Accuracy
verification and application to space weather. Advances in Space Research, 37(6), 1206–1217. 3
Tobiska, W. K., W. Atwell, P. Beck, E. Benton, K. Copeland, et al., 2015. Advances in atmospheric radiation
measurements and modeling needed to improve air safety. Space Weather, 13(4), 202–210. 6
26Davis et al.: Rad. Dose Rate Variation with Mag. Conditions and Location, 2023
Tsyganenko, N. A., 1989. A magnetospheric magnetic field model with a warped tail current sheet. Planetary
and Space Science, 37(1), 5–20. 2
Tylka, A. J., and W. F. Dietrich, 2009. A new and comprehensive analysis of proton spectra in ground-level
enhanced (GLE) solar particle events. In 31th International Cosmic Ray Conference. Universal Academy
Press Lodź. 2, 2
27You can also read