The Subscription Economy Index TM March 2021 - SUBSCRIPTIONS: DESIGNED AROUND CUSTOMERS, MODELED FOR RESILIENCE - AMIC
←
→
Page content transcription
If your browser does not render page correctly, please read the page content below
The Subscription
Economy Index
                          TM

March 2021

SUBSCRIPTIONS: DESIGNED
AROUND CUSTOMERS,
MODELED FOR RESILIENCE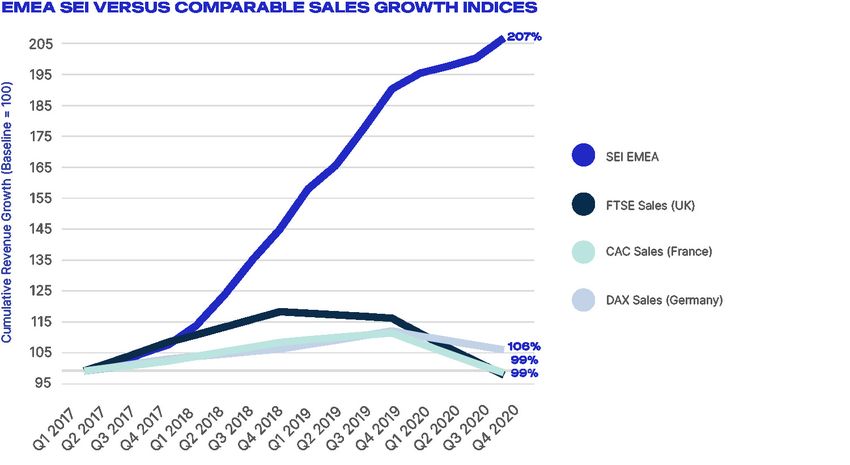
Table of Contents

INTRODUCTION                     2
DEFINITIONS & TERMINOLOGY        4
KEY FINDINGS                     6
STATE OF SEI BY SECTOR         10
SAAS                            11
TELECOMMUNICATIONS             13
MANUFACTURING                  15
BUSINESS SERVICES              17
IOT                            19
MEDIA                          21
PUBLISHING                     23
HEALTHCARE                     25
EDUCATION                      27
STATE OF SEI BY WORLD REGION   28
METHODOLOGY                    31

1
Introduction

SUBSCRIPTIONS: DESIGNED AROUND CUSTOMERS,
MODELED FOR RESILIENCE
The ongoing COVID-19 pandemic continues to upend plans and expectations
and transform the way the world does business. In an attempt to react
to shifting market conditions and consumer demands, companies across
industries were challenged to migrate to digital service models. Many
businesses were ill-equipped for digital transformation, with a lack of
understanding of how to successfully transition from products to services. But
many companies that have successfully embraced subscription models have
reaped the rewards and demonstrated great resilience.

The Subscription Economy® has grown nearly 6x (more than 435%) over the
last 9 years, and subscription businesses in the Subscription Economy IndexTM
(SEI) report have consistently grown five to eight times faster than traditional
businesses. In 2020, subscription businesses in the SEI demonstrated revenue
growth at a rate of 11.6%, while revenues of its product-based peers declined,
changing -1.6%. In Q4 alone, subscription companies in the SEI experienced
revenue growth at a rate of 21%, seven times faster than S&P 500 companies’
growth rate of 3%.

2
Overall and throughout COVID-19, companies in the SEI report did not
slow; in many cases, they have thrived. The year’s lockdowns and other
safety measures have accelerated a new era that Zuora refers to as the
End of Ownership in which consumers are increasingly less interested in
owning things and more inclined to achieve desired outcomes through
easy-to-access services.

For example, consumers have become accustomed to convenience as
an experience. They expect to be able to access movies, TV, and music
on demand. Many consumers want transportation, whether it’s a car
or bicycle, to be available as-needed, without onerous upfront costs.
Many consumers want clothing and groceries delivered to their home
regularly, and customized to their specifications.

The latest SEI report highlights the ways in which companies with
subscription models were able to adapt to these changing customer
preferences during the pandemic. Many companies across industries
are propelling their businesses forward by automating administrative
processes, broadening access to services, and placing the power in the
hands of the subscriber to choose and self-manage subscriptions.

Now and in the future, we expect that resilient businesses will design
their offerings for ultimate consumer flexibility and freedom — not solely
creating products to be sold as one-time transactions, but designing
services that customers can tap into anytime, anywhere, to whatever
extent that they choose.

3
Definitions
& Terminology

SECTORS:
•   The SaaS Index includes companies whose software is accessed
    online via subscriptions, including traditionally perpetual software
    shifting to SaaS, pure B2SMB SaaS, B2Every SaaS, and Enterprise
    SaaS.

•   The Telecommunications Index includes videoconferencing,
    satellite communications, broadband networks, digital
    infrastructure, and fiber networks.

•   The Manufacturing Index includes fabrication services, industry-
    specific software providers, industrial design, heavy equipment, and
    tool manufacturers.

•   The Business Services Index includes management consulting,
    legal assistance, data services, market research, staffing and
    recruitment, marketing and advertising, and records management.

•   The IoT Index includes a broad mix of several industries including
    security, technology, energy, transportation, scientific instruments,
    and construction. All of the companies in this index, however,
    manage digital services based on connected hardware.

•   The Media Index includes content providers, OTT streaming media
    companies, television and radio broadcasters, cable operators,
    search and navigation services, editing services, and production
    companies.

•   The Publishing Index includes newspapers, magazines, book
    publishers, educational content providers, and corporate research
    providers.

•   The Healthcare Index includes healthcare software, health and
    personal care stores, nursing and residential care facilities, medical
    equipment, and supplies manufacturing.

•   The Education Index includes education and training software and
    services, internet educational services, vocational schools, and
    internet and online services providers.

4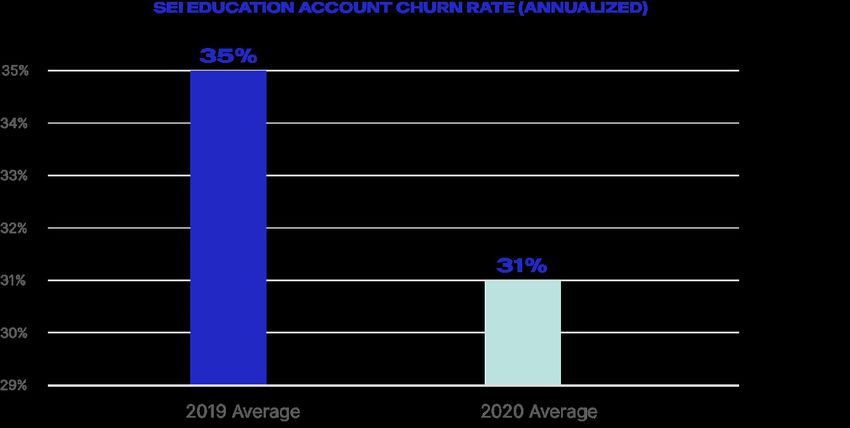
TERMINOLOGY:
The following company performance metrics are reported as annualized
percentage changes:

•   Churn Rate: The percentage of lost customers over a set period
    of time.

•   Net Account Growth Rate: The percentage of gained accounts
    over a set period of time.

•   ARPA Growth Rate: The growth rate of Average Revenue Per
    Account.

The following pricing and packaging metrics are reported as
percentages:

•   Usage Billing: Billing a customer on how much they use the service.

•   Monthly Renewals: The subscription is renewed on a monthly basis.

•   Evergreen Renewals: The subscription has no end date and
    customers are automatically billed until the subscription is canceled.

•   Discounts: Reduction of the regular price of a service.

•   Free Trials: A service is offered to customers for free for a limited
    time period.

5
Key Findings 6
Subscription Economy
in Five Figures

1. S
    EI REVENUE GROWTH RATE CLIMBED QUARTER
   OVER QUARTER IN 2020, NEARLY RETURNING TO
   PRE-PANDEMIC LEVEL.

2. Q4 2020 SEI AVERAGE REVENUE PER ACCOUNT
    RATE SURPASSED THE 2019 RATE.

7
Subscription Economy in Five Figures
3. AVERAGE ACCOUNT DISCOUNTS RETURNED TO
PRE-PANDEMIC NORM.
4. SAAS AND TELECOMMUNICATIONS LED IN
REVENUE GROWTH RECOVERY AMONG SEI
SECTORS.
8Subscription Economy in Five Figures
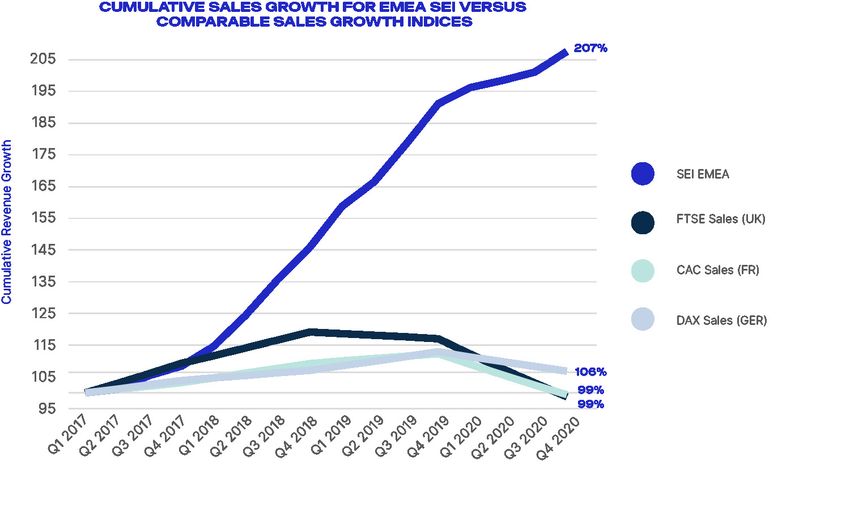
5. IN APAC AND EMEA, SUBSCRIPTION COMPANIES
SURGED WHEN COMPARED TO REGIONAL STOCK
MARKETS.
9State of SEI
by Sector
10“ There’s a reason why successful SaaS companies
use subscription models. Any as-a-service
business needs to re-think the traditional go-to-
market model and focus on building a customer
experience that makes services easy to use,
renew, and expand.
”
– Michael Fauscette, Advisor, G2
SaaS
SaaS led SEI revenue growth in the final quarter of 2020, driven by Q4 small
business recovery.
The SaaS sector includes digital software solutions that support businesses
and consumers. The “SaaS” model was already the predominant and
preferred approach for accessing software capabilities, and the trend toward
subscription-based software only accelerated as a result of the pandemic.
Because these solutions are delivered via the cloud, customers benefit from
anytime, anywhere access. This was especially critical this past year, when
many people were working, learning, and living in their homes.
11Companies that offer subscription software solutions are generally resilient
due to a number of factors, just one of which is a recurring revenue model.
A key strength lies in their ability to constantly respond to customer demand
and to improve, update, and innovate via the cloud.
In 2020, companies in the SEI that offer subscription software solutions
demonstrated a revenue growth rate of 18%, on average, driven by a strong
comeback in Q4 which saw a revenue growth rate of 24%. Gartner forecasts
that the revenue for cloud application services, or SaaS, will grow almost $36
billion from 2020 to 2022, reflecting an increase of approximately 34% during
that period.1
The SEI report shows that companies in the SaaS sector outperform other
sectors, experiencing the most robust growth trajectory in the SEI.
1
Gartner Newsroom. (July 2020) https://www.gartner.com/en/newsroom/press-releases/2020-07-23-gartner-
forecasts-worldwide-public-cloud-revenue-to-grow-6point3-percent-in-2020#:~:text=The%20worldwide%20
public%20cloud%20services,%2C%20according%20to%20Gartner%2C%20Inc.&text=Software%20as%20a%20
service%20(SaaS,2020%20(see%20Table%201).
Recommendation:
To optimize for growth, we recommend
companies in this sector consistently innovate
around the customer experience and build go-to-
market strategies for retention and expansion
as well as acquisition.
12“ Telecommunications companies are increasingly
adding new subscription services – expanding
beyond voice and high speed Internet access –
bundling video conferencing, OTT streaming, and
IoT with their core offerings. According to The 5G
Economy2, 5G’s full economic benefit should be
realized around the globe in 2035, when a broad
range of industries could produce up to $12.3
trillion worth of goods and services enabled by
5G mobile technology.
– Jeff Allen, CEO, Andelan Ventures
”
Telecommunications
SEI Telecommunications sector led in year over year revenue growth.
In response to shelter-in-place mandates, 2020 saw an influx of remote and
mobile work environments. Meanwhile, individuals faced travel restrictions
and were limited in their ability to meet in-person with friends and families.
Telecommunications enabled remote workers to collaborate and helped keep
people connected. But in 2020, S&P 500 Telecom Index companies took a
dip in sales; quite the opposite, revenue of subscription telecommunications
companies in the SEI grew an average of 10% in 2020.
13Subscription telecommunications providers in the SEI more than tripled new
account growth in 2020’s Q4 compared to 2019’s Q4, while keeping account
churn low.
Remote workforces are a key factor supporting continued growth for
telecommunications providers3. A July 2020 survey from Gartner found that
82% of business leaders plan to allow employees to work remotely at least
some of the time4.
2
IHS Economics. The 5G Economy: How 5G technology will contribute to the global economy. (2017) https://cdn.ihs.
com/www/pdf/IHS-Technology-5G-Economic-Impact-Study.pdf
3
Philip, R. IoT for All, How “Work From Home” During Covid-19 Has Transformed The World Of Telecommunications.
(August 2020): https://www.iotforall.com/work-from-home-telecommunications
4
Gartner Newsroom. (July 2020) https://www.gartner.com/en/newsroom/press-releases/2020-07-14-gartner-survey-
reveals-82-percent-of-company-leaders-plan-to-allow-employees-to-work-remotely-some-of-the-time
Recommendation:
In order to maintain growth, we recommend that
subscription telecommunications companies
strive to flex with customers’ needs — however
they return to work and travel. These companies
should continue adaptively learning subscribers’
preferences and delivering targeted services to
meet them.
14“ With access to product data and subscription
behaviors, industrial natives are in a powerful
position to continuously innovate and create the
next generation of digital services and products.
It is amazing what can be learned from managing
hundreds of users and how they consume your offer.
”
– Stephan Liozu, Chief Value Officer, Thales Group 7
Manufacturing
The growth for manufacturing companies in the SEI slowed, but avoided the
downturn experienced by traditional industrial manufacturers.
In recent years, traditional equipment manufacturers in the S&P 500
Industrials Sector have experienced slowed product sales growth, which
had essentially flatlined before the pandemic. Meanwhile, forward-looking
manufacturers sought new revenue streams in aftermarket services5, including
equipment maintenance and repair as well as data and analytics services for
their customers. According to IDC, these services offer manufacturers “an
opportunity to differentiate and deliver unrivaled value to customers.”6
15In 2020, the manufacturing sector was impacted by extreme disruptions to
the supply chain and capital budget cuts due to the COVID-19 pandemic.
Compared to the last quarter of 2019, S&P 500 Industrials Sector sales
declined by nearly 14%. Meanwhile, revenue in the Manufacturing SEI
increased by nearly 6% since the last quarter of 2019.
5
Wellener, P., Lineberger R., Millar K., Bendig O., Hussain A., Deloitte: Aftermarket services transforming manufacturing
in the wake of the COVID-19 pandemic (May 2020). https://www2.deloitte.com/us/en/insights/industry/manufacturing/
aftermarket-services-digital-differentiator-beyond-COVID-19.html
6
Pinder, A. IDC MarketScape: Worldwide Manufacturing Service Life Cycle Management Systems Integrators/
Business Process Outsourcing 2020 Vendor Assessment (November 2020). https://www.idc.com/getdoc.
jsp?containerId=US45629420
7
Originally appeared in Industry Week (September 2019). https://www.industryweek.com/leadership/article/22028258/
a-manufacturing-subscription-model-is-its-own-beast-8-considerations-to-succeed
Recommendation:
We recommend manufacturers reassess their
businesses and invest in digital offerings to meet
customers’ needs for data driven insights, increased
efficiency, and a changing environment.
167% In 2020, the revenue of Business
Services companies in the SEI grew
at a rate of 7% compared to S&P 500
Commercial & Professional Services
Sales Growth rate of 4.7%.
Business Services
Sign-ups spiked mid-year, as businesses rapidly responded to pandemic
challenges.
In 2020, companies offering subscription business services were able to
demonstrate value to their customers by providing always-on support. These
businesses outpaced sales growth of the S&P Commercial and Professional
Services sector by nearly 1.5x. In 2020, the revenue of Business Services
companies in the SEI grew at a rate of 7% compared to S&P 500 Commercial &
Professional Services Sales Growth rate of 4.7%.
17Subscription business in the SEI services saw a significant sign-up spree in the second quarter, its highest account spike in years. Recommendation: Subscription models can help consultancies scale, for instance, by supporting clients with clear and timely invoicing and flexible payment options. We recommend subscription corporate services companies focus on nurturing new accounts gained in 2020, innovating for 2021’s needs. 18
“ After businesses got back to work after the first
     lockdowns, they determined that remote access
     to manufacturing IoT data, services that provide
     occupancy levels, and touch-free options for
     employee access were necessary. Many of these
     IoT products have a subscription component that
     was activated to help bring employees back to
     work or provide information so plant workers could
     stay home safely while still keeping manufacturing
     operations running.
                                 ”
     – Stacey Higginbotham, Founder, Stacey on IoT

IoT
Subscription IoT revenue slowed but continued to grow, in reverse direction of
S&P peers.

Subscription IoT businesses in the SEI experienced significant revenue growth
compared to the sales of their S&P peers in 2020. Connected services can
help reinforce the core value of a product or service and can create new
monetization opportunities and enduring customer relationships8.

While the rate of subscription IoT revenue growth slowed in 2020 compared
to prior years, the sub-sector saw full net account recovery in Q4, returning to
2019 Q4 levels.

19
The pandemic catalyzed companies in the IoT sector to explore the role
of digital services and subscriptions. Additionally, “product as a service”
offerings enabled IoT manufacturers to enter new markets and find new
opportunities for monetization. For example, IBM used IoT to track their
buildings’ use and adapt to social distancing and enhanced cleaning
protocols.9 IBM and others pivoted in light of a pandemic-specific challenge.
8
Subscribed.com: 5 Strategies for Monetizing Connected Devices (2020). https://www.subscribed.com/read/
subscription-strategy/5-strategies-monetizing-connected-devices
9
IBM Global Real Estate: Optimizing space and safety for employees in the COVID-19 era. https://www.ibm.com/
downloads/cas/A5RAGNO9
Recommendation:
We can expect corporations to continue to explore
IoT solutions that help them meet pressing needs in
the future, such as reducing their carbon footprint.
We recommend IoT companies focus on services to
deepen customer relationships and reap the benefits
of new revenue streams.
20“ Today, overall consumer spending is about $1.4
trillion for consumer internet and media. We believe
that over the next three years, we’re going to add
$141 billion in revenue and subscriptions and
another $46 billion in single transactions.
– Michael Wolf, Co-Founder and CEO, Activate13
”
Media
Flexible, customizable subscription options helped media companies defend
against churn.
According to Deloitte’s Digital Media Trends Survey, before COVID-19, the
average U.S. consumer had 12 paid media and entertainment subscriptions.10 As
reported in the same survey, since the pandemic began, 23% of U.S. consumers
have added at least one new paid video streaming service. This is evidence
of the growing popularity of streaming media. Subscription models help
media companies to create subscriber-centric experiences, building ongoing
relationships with their subscribers across whatever channels they choose.
21In 2020, OTT media companies saw the highest rates of churn — or
cancellation — in spring. When lockdowns relaxed in summer months, one
may have expected viewers to step away from screens and cancel their OTT
subscriptions, but rather, churn fell, nearly six percentage points by the end of
the year.
Subscription media companies are well-positioned to address and reduce
churn in the sector. Unlike a one-and-done transaction, subscription
experiences allow subscribers to ease into their relationships with vendors
and land on optimal solutions that meet their needs and preferences.
According to a Deloitte study on media consumption habits in June 2020,
20% reported making changes to their music subscription.11 And, according
to research from the Subscribed Institute, providing customers the option to
suspend then resume their subscription can effectively reduce churn.12
10
Wescott, K., Downs, K., Loucks, J. Deloitte Digital Media Trends Survey: 14th Edition. Deloitte Insights. https://www2.
deloitte.com/us/en/insights/industry/technology/digital-media-trends-consumption-habits-survey/summary.html
11
Westcott, K., Loucks, J., Downs, K., Arkenberg, C., Jarvis, D. Digital media trends survey, 14th edition. Deloitte
Insights. (June 2020). https://www2.deloitte.com/us/en/insights/industry/technology/digital-media-trends-
consumption-habits-survey/summary.html
12
Konary, A. and Gold, C. Subscription Suspend/Resume: Impact on Churn Mitigation. The Subscribed Institute. https://
www.zuora.com/resource/subscription-suspend-and-resume-impact-on-churn-mitigation/
13
Subscribed Podcast (November 2020): https://www.zuora.com/2020/11/17/subscribed-podcast-activates-michael-
wolf-on-the-future-of-media-technology/
Recommendation:
We recommend media companies leverage
insights to improve the subscriber experience
and place that experience at the center of
the business.
22“ Publishers know that what works is a direct
relationship with a reading customer. If you can
get $100 from somebody, it’s better than getting
15% of some kind of revenue pool that isn’t going
to pay the journalists in the newsroom.
– Ken Doctor, President, Newsonomics17
”
Publishing
Publishing subscriptions filled a much-needed gap for readers in a historic year.
For years, the publishing industry has grappled with the challenges of
declining ad revenue. According to PwC’s Media Outlook report, global
newspaper advertising (print and online) will fall from $49.2 billion in 2019 to
$36 billion in 2024, a decline of more than a quarter (27%) over five years 14.
Subscription publishing companies in the SEI grew revenue by 16% in 2020.
From the COVID-19 pandemic, to Brexit, to protests in response to racial
injustice, to a monumental U.S. election, 2020 may go down as one of the
most news-breaking years in the existence of digital publishing. Meanwhile,
public trust in all sources of information reached record lows. Trust levels
declined across traditional media, search engines, and social media — by
eight, six, and five percentage points, respectively — and many readers
turned to alternative information sources.15 Subscription publishers were
able to supply crucial reporting to subscribers during this time by providing
them with easy access and options for consuming the news. For instance,
The Atlantic added 36,000 new subscribers in four weeks, even as they lifted
paywall restrictions on coronavirus coverage.16
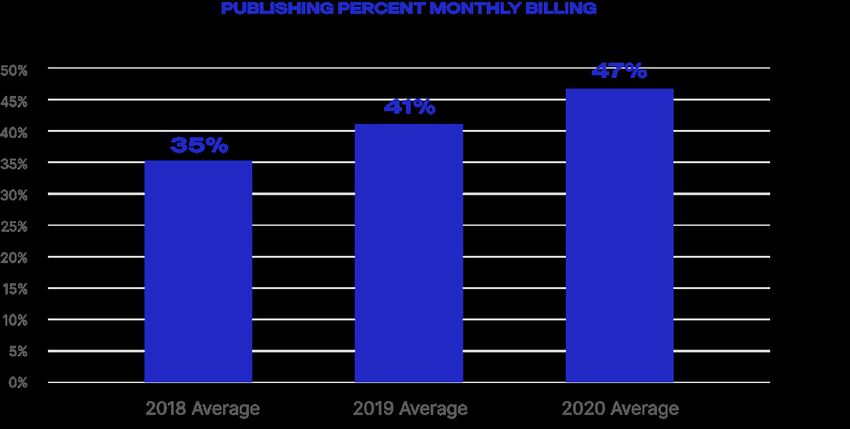
23This year, publishers in the SEI experimented with new subscription billing
models, including more monthly billing (over annual billing), which offers
subscribers the option of smaller, more frequent payments.
Creative subscription models can help publishing companies offer readers
customizable packages and seamless options to upgrade, suspend, or renew
their accounts. Ultimately, innovative approaches in digital publishing can help
expand access to information that matters.
14
PwC. Media Outlook Report 2020-2024: (2019). https://www.pwc.com/gx/en/industries/tmt/media/outlook.html
15
Edelman Trust Barometer 2021: Global Report. (February 2021). https://www.edelman.com/trust/2021-trust-barometer
16
Scire, S. NiemanLab. (April 2020). https://www.niemanlab.org/2020/04/for-its-must-read-coronavirus-coverage-the-atlantic-
is-rewarded-with-a-huge-surge-of-digital-subscriptions/
17
Subscribed Podcast. July 2020: https://www.subscribed.com/listen/podcasts/subscribed-podcast-ken-doctor-on-covid-19s-
impact-on-publishing
Recommendation:
To scale rapidly, we recommend subscription
publishing companies offer their subscribers
options to customize their pricing, packaging
and, ultimately, their experience based on
readers’ preferences.
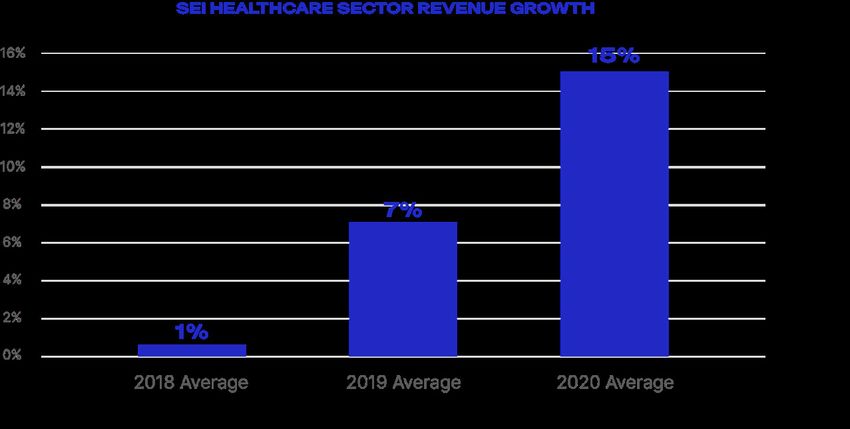
2459 By the end of 2020, the SEI Healthcare
sector was 59 percentage points higher
than the Fidelity MSCI Health Care Index.
Healthcare
Subscription models offer solutions for the future of healthcare.
The past year has changed the trajectory of healthcare. Front and center is
the need to provide wider, more affordable access — and to provide services
remotely when possible. Subscription healthcare companies saw the lowest
churn rates in the SEI, underscoring how vital relationships, customer-centric
models, and flexible access are to this sector in particular.
25Healthcare also utilizes the highest levels of usage-based billing in the SEI.
Usage-based pricing is a way of quantifying the value of the product or
service provided; it can take different forms, such as volume-based pricing,
overage pricing, or tiered models. For each, the goal is to let customers
— patients or healthcare systems — pay only for the services they need.
Incorporating usage-based pricing makes it easier for companies to align
and grow with customer needs and offer predictability to their customers.
And, according to a Subscribed Institute benchmark on usage-based pricing,
companies that have usage-based pricing that makes up between 1-50%
of their overall revenue grew at 28% year-over-year (1.5 times higher than
companies with no usage-based pricing at all).18
Innovative pricing models are promising for healthcare because they can
unlock access and affordability for patients. For example, rather than selling
drugs at the highest viable price, pharmaceutical companies can enter into a
subscription contract with healthcare systems with the goal of reaching the
most possible patients.
18
The Subscribed Institute. Benchmark: Usage Based Pricing: https://www.subscribed.com/article/subscription-
economy-benchmarks-report-2/
Recommendation:
We recommend healthcare companies unlock
innovative models for service provision and
payment to reduce cost on health systems
and expand access to patients.
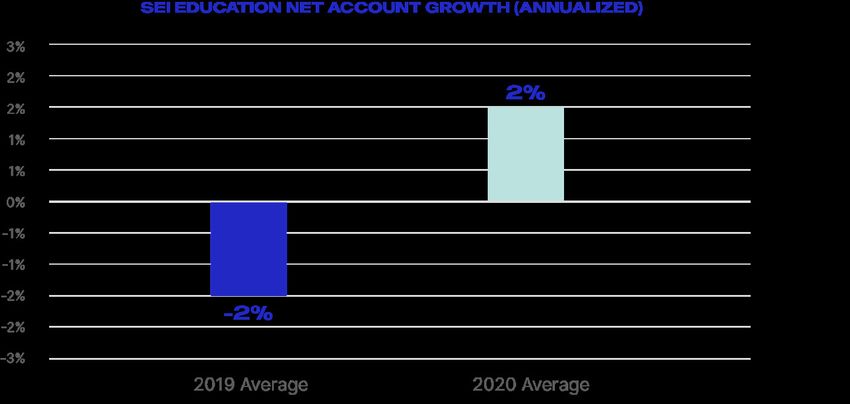
26Education in the SEI
Subscriptions have a role to play in the future of education
According to UNICEF, more than 90% of countries established some form of remote
learning policy due to the COVID-19 pandemic.19 In 2020, as compared to the prior
year, education companies in the SEI saw an increase in net account growth (up 4
percentage points, and growing compared to last year’s contraction) and a decrease
in churn (also up four percentage points). In other words, there were more sign-ups
to subscription education services, and fewer subscribers canceled their accounts.
19
COVID-19: Are Children Able to Continue Learning? UNICEF. (August 2020). https://data.unicef.org/resources/remote-learning-
reachability-factsheet/
Recommendation:
To achieve growth, we recommend education
companies continue to use customer data to
customize offerings.
27State of SEI by World Region 28
In APAC and EMEA,
subscription companies
surged when compared
to stock markets.
Amid the pandemic, revenues for subscription companies in the SEI have
ticked up in the last two quarters of 2020, whereas regional sales indices
have continued to decline. Interestingly, in Q1, lockdowns and other safety
measures seemed to slow subscription revenue growth (in APAC, revenue
even contracted), but subscription revenue growth accelerated by Q4. This
acceleration suggests that subscription companies were effective in adapting
their offerings quickly.

29
While the APAC SEI region was the earliest impacted by COVID-19, and its
growth rate, on average, fell earlier and steeper than other regions, it also
recovered quicker and was the only region in the SEI where revenue growth rate
increased on average from 2019 (20% growth rate) to 2020 (22% growth rate).

Recommendation:
We believe that the pandemic is helping to pave
the way for the end of ownership in the future. We
expect that in the eventual aftermath, customers
won’t forget the convenience, flexibility, and
customization provided by the subscription
economy. Globally, we recommend businesses
deliver on these demands to keep customers
engaged — and loyal — while establishing a
competitive advantage.

30
Methodology
INTRODUCTION
The Subscription Economy IndexTM (SEI) report measures        report, that does not necessarily cause the index to go
the growth in the volume of business for subscription         down. A constituent leaving the pool may be associated
based products and services. The SEI report is based on       with contraction in that constituent prior to departure
anonymized, aggregated, system-generated activity on          if the tenant leaves the Zuora service due to business
the Zuora billing service,and is intended to be indicative    failure at the owner company, but that is not necessarily
of the direction of the Subscription Economy® as a whole.     the case.
The SEI report includes not only the main index but also
a set of explanatory metrics that provide insight into the    The SEI report also removes the impact of non-organic
sources of growth (Growth Factors), as well as specialized    growth in the system activity. Non-organic growth, for
indices focusing on particular business segments (Sub-        these purposes, means any increase in the activity in
Indices).                                                     the Zuora service that is not reflective of the changes in
                                                              the underlying fundamentals of the company owning the
The index itself is an indicator that increases (or           tenant in question.
decreases) at the same percentage rate as the average
volume of activity observed in tenants on the Zuora           The most common cases of non-organic changes in
service. Such tenants are known as constituents of the        activity are account migration from another billing system
index, for reasons that will be made clear below. Like        to the Zuora service and voluntary decommissioning of
many financial and economic indicators, the precise value     a tenant by a company that was using the billing service.
of the index is nominal and defined by convention. In         In contrast, declines in activity resulting from business
particular, the SEI data is defined to have a value of 100    failure remain part of the index calculation. These issues
on the historical date January 1st, 2012. After that time,    will be described in more detail below.
each percentage change in the index corresponds to the
same percentage change in the activity volume of an
average constituent. So when the index climbed from 100       CRITERIA FOR INDEX CONSTITUENTS
to 105, it means that on average the constituents of the      Borrowing a term from stock market indices, a tenant
SEI report had increased their activity volume by 5% over     on the Zuora service that produces activity used for
that time. When the index later climbs from 110 to 115,       calculating the SEI report is referred to as an index
that corresponds to only 115/110 = 4.5% growth.               constituent. Not every tenant on the Zuora billing system
                                                              will be an index constituent at any given time. The criteria
                                                              for inclusion is simply a minimum length of time that a
THE SEI REPORT AS A MEASURE                                   tenant must have been live on the Zuora billing system:
                                                              The main purpose of this minimum is removing the effect
OF ORGANIC GROWTH                                             of non-organic activity growth from the index calculation,
As will be described in detail below, the SEI report is
                                                              as described above. Other considerations are removal
designed so that it measures the organic growth of
                                                              of seasonality, and ignoring high rates of activity growth
the constituents in the index and not the growth in the
                                                              from insignificant base values. As described below, most
number of constituents. At its simplest, that means that
                                                              companies using the Zuora billing service become index
the addition of constituents to the SEI report does not
                                                              constituents after approximately two years live on the
make it go up, in and of itself. Because the index grows
                                                              system.
at a rate that is the weighted average of the growth
rates of the constituents, adding constituents to the SEI
report only dilutes the weight assigned to all the other
constituents. For that reason, adding constituents only
                                                              BURN-IN PERIOD
                                                              In order to remove the effect of account migration from
makes the index go up if the new constituents’ growth
                                                              other billing systems, a minimum burn-in period of one
rates are higher than the average growth rate of the pre
                                                              year is applied to every tenant on the Zuora billing
existing cohort. Similarly, when constituents leave the SEI
31
system. That means that the first year of system activity
POST-LIVE INVOICE CONVERSION
for a constituent is simply ignored and never used as
Usually the migration of accounts and invoices from
part of any calculation. The one year burn-in period also
another billing system to Zuora occurs before or
removes whatever growth comes immediately after a new
immediately after a tenant goes live on the platform.
company launch, when Zuora is the original billing system
Occasionally a company converts accounts and
for a new product. This is sensible because high growth
invoices to the system at a later date. Whenever such
rates measuring growth from an insignificant base level
a conversion is known to occur, the corresponding
are usually not sustainable in the long run. The burn-
quarter(s) of system activity will be removed from the SEI
in period for a constituent may be longer than one year
report calculation for those companies. The data points
whenever there is known or suspected to be significant
for those companies will be filled as necessary with the
account migration from other systems even after this
average of the quarters before and after the conversion.
time. Note however that Zuora does not have perfect
Note that Zuora does not always have complete
information about these events, and some migration
information about these events and it is possible that
of accounts from another billing platform may not be
some post-live revenue conversion may go into the index
excluded (however, any extreme outliers will be removed
calculation and would appear as growth (however, any
as an outlier, as described below.)
extreme points will be removed as an outlier, as described
below.)
CALCULATION PERIOD
As will be described in more detail below, revenue for the
MULTI-TENANT AND MULTI-ENTITY
SEI report is measured in a one year rolling window. The
In cases where a single parent company operates either
purpose of the one year window is to remove the impact
multiple entities or multiple tenants in the Zuora system,
of seasonality. After the burn-in period, the next year
the system activity for each entity or tenant is treated
of system activity for a constituent is used to establish
as if it were a separate constituent for purposes of SEI
the baseline for the measurement of future growth. As
report calculations including burn-in, calculation and
a result, a typical tenant using the Zuora service is first
churn. A separate tenant is the specific case of multiple
used as an index constituent when their one quarter
entities operating with fully separate product catalogues,
growth is calculated two years and one quarter after they
databases etc. The base date for beginning the burn
went live on Zuora system.
in period on a tenant or child entity is the later of the
customer go-live date and the earliest date for which
system activity for the tenant or entity is first processed.
REMOVAL OF INDEX CONSTITUENTS
Decommissioning of tenants and the causes are tracked
in the Zuora CRM system. System activity for a tenant
CALCULATING CONSTITUENT GROWTH
is suspended from the SEI report calculation beginning
Once a tenant on the Zuora service becomes an index
in whatever quarter their decommissioning is noted,
constituent its activity is calculated every quarter with a
and whenever the reason is other than business failure.
one year rolling window. Many subscription businesses’
Business failure decommissionings are allowed to remain
activity are subject to seasonality, although the precise
in the SEI report throughout the decommissioning as this
nature of the seasonal effect varies significantly. Using
reflects organic contraction on the tenant activity, while
a one year window for SEI report calculations removes
voluntarily decommissioning tenants are removed as that
the effect of seasonality. This means that if the SEI data
is a case of non-organic change in the activity. Note that
increases (or decreases) over any quarter it is because
this may fail to exclude migration of accounts from the
that quarter was better (or worse) than the same quarter
Zuora system that preceded the acknowledgement of
one year prior; not the quarter immediately preceding it.
decommissioning; such migration off the Zuora system
The activity measure for SEI data calculation is the one
would appear as negative growth and may influence the
year prior total of Invoice Item amounts generated from
SEI data calculation (however, any extreme points will be
recurring and usage Rate Plan Charge objects in the Zuora
removed as an outlier, as described below.)
object model database1. One time charges are excluded
from the calculation, as the SEI report is intended to
reflect the growth in recurring activity. Whether Invoice
Items are for recurring, usage or one time activity is given
32by the Rate Plan Charge object linked to the Invoice Items , etc.) Removing outliers helps to insure that even if such
in the model. Note also that any activity a constituent companies’ system activity remains in the SEI report and
makes that is outside the Zuora system is ignored by the do in fact do have extreme changes in their activity, then
SEI report calculation. A consequence of this is that in those changes will not influence the index.
cases where a division of a large corporation uses Zuora
for a single product line then that constituent is treated
as if it were a small company, independent of the larger WEIGHTING BY VOLUME OF ACTIVITY
organization. In addition to reflecting what happens to a “typical”
constituent, the SEI report is meant to reflect the amount
Once the activity of a tenant in the SEI report has been of growth in the overall Subscription Economy outside of
calculated, the growth calculation for the SEI report is the Zuora service and the opportunities that are available
the quarterly change in the one year trailing activity to creators of and investors in Subscription Economy
expressed as a percentage. That is, the quarterly growth companies. For this reason, the weighted average used in
for a constituent is calculated as: the SEI report growth calculation is weighted by the total
amount of activity each tenant has, so that companies
GQconstituent = AQconstituent -1 with higher activity take more weight in the average.
AQ-1constituent (Note the weighting is by the baseline amount of activity
for each constituent, but not the growth in activity that
where AQ represents the one year trailing activity ending with
is being averaged.) This is similar to the way that stock
the quarter denoted Q and, and AQ-1 is the same but for the
market indices are weighted by the market capitalization
year ending with the prior quarter.
of their constituents and for the same reason: the indices
are meant to represent the overall size of the market and
the opportunity available to investors, so it is weighted
AVERAGE GROWTH AND UPDATING THE more towards larger entities.
INDEX
The increase/decrease of the SEI report over any period However, complete reliance on amount weighting may fail
in time is the average of the growth in activity for to reflect what is typical if a few very large constituents
constituents who make up the SEI report at that time. dominate the activity measured by the SEI report. For
However, the average growth used is not the simple this reason the weight of any single constituent in the
average (or mean) – rather it is amount weighted average, weighted average is limited to 5% of the total. In case
subject to certain constraints. any constituent would take more than 5% of the average
weight in the SEI report (or a sub-index) based on their
total amount of activity, then that weight is capped at 5%
OUTLIER REMOVAL and the remaining weight is distributed proportionally to
The first step taken in calculating the average is to the other constituents in the pool; the process is iterated
remove outliers, those constituents in the SEI report until all constituent weights are at or below 5%.
having the largest increases or decreases in activity
for each quarter. Outliers are defined as the top and
bottom 5% of companies in the SEI report. The actual MINIMUM NUMBER OF CONSTITUENTS
number to remove is rounded up to the nearest whole Taken together, the outlier removal and weighting
number, so for example if there were 100 constituents method determine the minimum number of constituents
in the index then the top and bottom 5 companies are for calculating the SEI data or any sub-index of the
removed, but if there are 101 in the index then the top SEI report (for which the same rules apply.) Capping
and bottom 6 companies would be removed. Removing weights at 5% implies there must be no less than twenty
outliers serves two purposes: First, the movement of the constituents. However, the twenty constituents must
SEI report is meant to represent what happens to typical be available after outlier rejection, described above. The
constituents in the SEI report. However, averages can be number of constituents to remove for the top and bottom
unduly influenced by the presence of very large values. 5 percentiles is rounded up to the nearest whole number,
Also, as noted above, the SEI report calculation does not so that for more than twenty constituents the two highest
contain perfect information about non-organic changes and two lowest activity growth numbers are removed from
in activity (e.g. conversions, decommissioning of tenants the average.
33This means the minimum possible number of constituents (added) accounts. Changes in ARPA are closely related
to calculate the SEI report or one of its sub-indices to upsells and downsells: If ARPA is growing, then upsells
according to these rules is twenty four, and the SEI report and price increase must be outweighing downsells and
uses a minimum of twenty five for simplicity. discounts.
To calculate the growth factors for ARPA and Net Account
INDEX UPDATE growth, the number of accounts with activity in the
Given the growth of all constituents over the prior quarter past year is measured on each quarter end date for all
and the weights to use in the average, the average growth the constituents. ARPA is calculated simply as annual
is simply the sum of all the constituents’ growth rates activity divided by the number of accounts. Next, the
multiplied by their weight (note that all the weights add up quarterly percent changes in ARPA and the number of
to one, so this is a proper weighted average.) accounts is calculated for all constituents (similar to
One plus the average growth rate is then multiplied by the the calculation for quarterly percent change in overall
prior index level to arrive at the new index level. That is, annual activity, described above.) Finally, the averages
of ARPA growth and Net Account Growth are calculated
SEIQ=SEIQ-1 ×(1+ GQ) using the same weights as the SEI report (overall activity
weighting, subject to constraint.) These averages are
where SEIQ is the new index level, SEIQ-1 is the index level
the Growth Factors for ARPA and Net Account Growth.
after the last quarterly update, and GQ is the average
When combined with the SEI report’s change for any
constituent growth over the most recent quarter.
time period, these show whether SEI report’s growth (or
declines) was driven by increases/decreases in activity on
existing accounts or by changes in the overall number of
GROWTH FACTORS accounts, or both.
The SEI report measures the amount of growth in the
Subscription Economy, but a single indicator does
Note that for a single tenant in the SEI report, the
not give insight into what is driving it. A related set
following relationship
of metrics help to explain the sources of that growth.
holds exactly:
These metrics are called the Growth Factors of the
SEI report. Like the percentage change in activity (1+GQ) = (1+GQARPA)×(1+GQ# of Accounts)
used in the SEI report calculation, the Growth Factors
are averages of percentage changes in other activity where G indicates the percentage growth of the
based measurements. Unlike the SEI report, the Growth measurement indicated for some quarter. Also, for low
Factors are not used to update an index – they are simply levels of growth it is approximately true that:
provided as explanatory information each quarter. The
growth factors use a simple two step decomposition to GQ≈GQARPA + GQ# of Accounts
explain why the SEI report went up (or down) in any given
Meaning, when the growth is small the total growth is
quarter.
close to the sum of the two components. However,
the SEI report’s growth factors are averages over many
ARPA AND NET ACCOUNT GROWTH constituents and the multiplicative relationship shown
above will only be approximately correct. This is because
If the total amount of a company’s activity go up that
an average of a product of two sets of measurements
means at least one of two things must have happened:
is not the same as the product of the averages of the
Either the number of accounts generating the activity
same two sets of measurements – the relationship is
went up, or the amount of activity for existing accounts
nonlinear. The additive relationship is even less accurate
went up. The total of Invoice Item amounts is analogous
for the Growth Factors, as it involves one more level of
to the accounting measure of revenue, so it is referred
approximation. So the growth of the SEI report is not
to using the accounting term Average Revenue Per
simply the sum of the ARPA and Net Account Growth
Account or ARPA. This is the first level of the SEI report’s
Factors, though it will often be close. And comparing
Growth Factor decomposition: overall activity growth
these two Growth Factors still gives a powerful
is decomposed into growth in ARPA and growth in the
explanation into what caused the SEI report to grow in any
number of accounts. The latter is referred to as Net
given quarter.
Account Growth, to distinguish it from specifically new
34ACCOUNT GROWTH AND CHURN RELATIONSHIP TO REVENUE BASED
The net change in the number of accounts can be further
decomposed into two components: addition of new
RETENTION
Many subscription companies report revenue based
accounts, and loss or churn of existing accounts. These
retention and churn, and it is also common to include the
additional growth factors provide insight into what is
impact of upsells in this metric. This is useful because this
driving net changes in the number of accounts. This extra
one metric captures much about the health of the existing
level of decomposition is important because new account
customer base. To calculate an amount that is analogous
additions and losses to churn are driven by two different
to revenue based retention including upsells from the SEI
processes: New additions are the result of marketing and
report’s Growth Factors start by noting that account based
sales efforts; while churns are driven by satisfaction/
retention is simply 100% minus account based churn.
dissatisfaction of the existing customer base.
So the SEI report’s analog to revenue based retention
including upsells is calculated by multiplying the account
Companies calculate growth and churn of accounts in
based retention by one plus ARPA growth.
many different ways. The SEI report’s growth factors use
a simple calculation that makes results comparable across
That is:
the wide variety of companies in the SEI report, and is
consistent with the calculation of the SEI report’s main R = (1.0 - C)×(1+GARPA)
index and the other Growth Factors. The definition are
as follows: where C is the churn rate and GARPA is the ARPA growth rate
as described above.
1. New account additions are defined as any account that
had activity in the last quarter, but had no activity the
prior year (the prior four quarters.) SUB-INDICES
In addition to providing insight about the direction of the
2. The Account Growth rate is defined as the number Subscription Economy overall, it is useful to know about
of new accounts added in a quarter divided by the the differences between various categories of companies.
number of accounts at the start of the quarter. To support this, the SEI report’s method is also applied
to specific subsets of the constituents l. Borrowing
3. Churns are defined as an account that has had no terminology from stock market indices these constituent
activity in the last year (4 quarters), but last had groups and their associated measurements are known as
activity in the quarter prior to that. To explain churn sub-indices. Once the classifying criteria for a sub-index
another way, suppose an account had activity in Q2 are defined, the same methodology is applied to that
some year; if Q2 of the next year passes and the pool of constituents as is used for the main SEI report.
account has not had activity again at all in that year, The only requirement for creating an SEI sub-index is
then the account is considered a churn at in Q3 (up to that the category must have a minimum number of 25
one year and one quarter after the last activity.) constituents, as described above. However, for two sub-
indices a smaller number than 25 was used with the same
4. The churn rate is defined as the number of churns in a methodology described above.
quarter divided by the number of accounts at the start
of the quarter. A variety of classifications are used to define sub-indices.
Examples include the Business Model, Industry, Vertical,
Many companies use different definitions for these and Revenue Band. Additional classifications may be
metrics, and those choices are often made based on applied in the future, or combinations of classifications.
the typical customer lifespan, re-signup behavior etc. These classifications are provided by the data providers
Naturally, any definition applied to a diverse pool of InsideView and Datafox and applied to the billings
companies will not be perfectly suited to every type of system measurements via Zuora’s CRM system. For the
tenant in the zuora service. The SEI report definitions manufacturing and publishing sectors, categorization by
were chosen to remove the effects of seasonality and for either vendor is used. For other sectors, InsideView alone
consistency with the annual activity calculations used by determines the categorization.
the SEI report.
35The IoT sector is determined by an internal categorization Corporate services is defined as all companies with sub-
method based on subscription product characteristics, sectors in Commercial Printing, Environmental & Facilities
because the commercial data vendors do not yet Services, Office Services & Supplies, Diversified Support
recognize IoT as a separate category. Services, Security & Alarm Services, Human Resource &
Employment Services, Research & Consulting Services
PRICING AND PACKAGING STATISTICS Media is defined as all companies with sub-sectors in
Pricing and packaging statistics include measurements
Interactive Media & Services, Movies & Entertainment,
like the amount of free trials and discounts that are
Advertising, Broadcasting, Interactive Home
offered, the amount of customers that pay through
Entertainment
usage based billing, the frequency with which customers
Sales Growth for Publishers Weekly Stock Index, S&P 500
renew, and other measurements of how customers buy
Media Sub-Index, and S&P 500
their subscription services. The pricing and packaging
metrics are measured using anonymized, aggregated,
Corporate Services Sub-Index
system-generated activity on the Zuora billing service,and
https://www.sec.gov/edgar.shtml : Annual 10-K Reports
is intended to be indicative of the prevalence of these
practices in the Subscription Economy® as a whole.
Euro Zone Growth Rates
Averages of pricing and packaging metrics are reported
https://tradingeconomics.com/euro-area/gdp-growth-
for subindices using outlier removal, as described above.
annual
However, averages of pricing and packaging statistics
are not weighted by revenue as described above for the
© 2019 Zuora, Inc. All Rights Reserved. Zuora,
growth metrics.
Subscription Economy and Subscription Economy Index
are trademarks of Zuora, Inc. Third party trademarks
SOURCES mentioned above are owned by their respective
S&P Dow Jones Indices companies. Nothing in this report should be construed
http://us.spindices.com/indices/equity/sp-500 to the contrary, or as an approval, endorsement or
sponsorship by any third parties of Zuora or any aspect of
US Census Bureau, “Monthly Retail Trade and Food this report. To learn more about Zuora, please visit www.
Services” zuora.com
https://www.census.gov/econ/currentdata/S&startYear=19
92&endYear=2016&categories=44000&dataType=SM&ge
oLevel=US&adjusted=1¬Adjusted=1&submit=GET+DAT
FORWARD LOOKING STATEMENTS
This report contains forward-looking statements that
A&releaseScheduleId=
involve a number of risks, uncertainties, and assumptions,
including but not limited to statements regarding the
McKinsey, “Grow Fast or Die Slow”
expected growth and trends of subscription-based
http://www.mckinsey.com/industries/high-tech/our-
companies (including companies in the SEI report) and
insights/grow-fast-or-die-slow
non-subscription based companies. Any statements that
are not statements of historical fact may be deemed to
Sector and Region specific Stock Market Index Sales
be forward-looking statements, and actual results could
Growth, except for Publishers Weekly Stock Index, S&P
differ materially from those stated or implied in forward-
500 Media Sub-Inde, S&P 500 Professional Services Sub-
looking statements. This report also includes market data
Index
and certain other statistical information and estimates
http://www.etfresearchcenter.com/
from industry analysts and/or market research firms.
Zuora believes these third party reports to be reputable,
Publishers Weekly Stock Index constituents
but has not independently verified the underlying data
https://www.publishersweekly.com/pw/by-topic/industry-
sources, methodologies, or assumptions. Information
news/publisher-news/article/80632-book-biz-stock-sank-
that is based on estimates, forecasts, projections, market
over-past-six-months.html
research, or similar methodologies is inherently subject to
uncertainties and may differ materially from actual events
S&P Media Sub-Index and S&P 500 Corporate Services
or circumstances.
Sub-Index Constituents
https://wikipedia.org/wiki/List_of_S%26P_500_companies
36The Subscribed Institute The Subscribed Institute is a dedicated think tank focused on the Subscription Economy. The Institute supports its 1000+ business executives across 500+ global companies with critical data, thought leadership, and connections. Research provided by the Institute helps business leaders and their organizations to maximize the opportunities of the Subscription Economy. More at www.subscribedinstitute.com
You can also read