The Second World War, Inequality and the Social Contract in England - Leander Heldring, James A. Robinson, and Parker J. Whitfill
←
→
Page content transcription
If your browser does not render page correctly, please read the page content below
WORKING PAPER · NO. 2022-18

The Second World War, Inequality
and the Social Contract in England
Leander Heldring, James A. Robinson, and Parker J. Whitfill
JANUARY 2022

                                                              5757 S. University Ave.
                                                                  Chicago, IL 60637
                                                                 Main: 773.702.5599
                                                                   bfi.uchicago.edu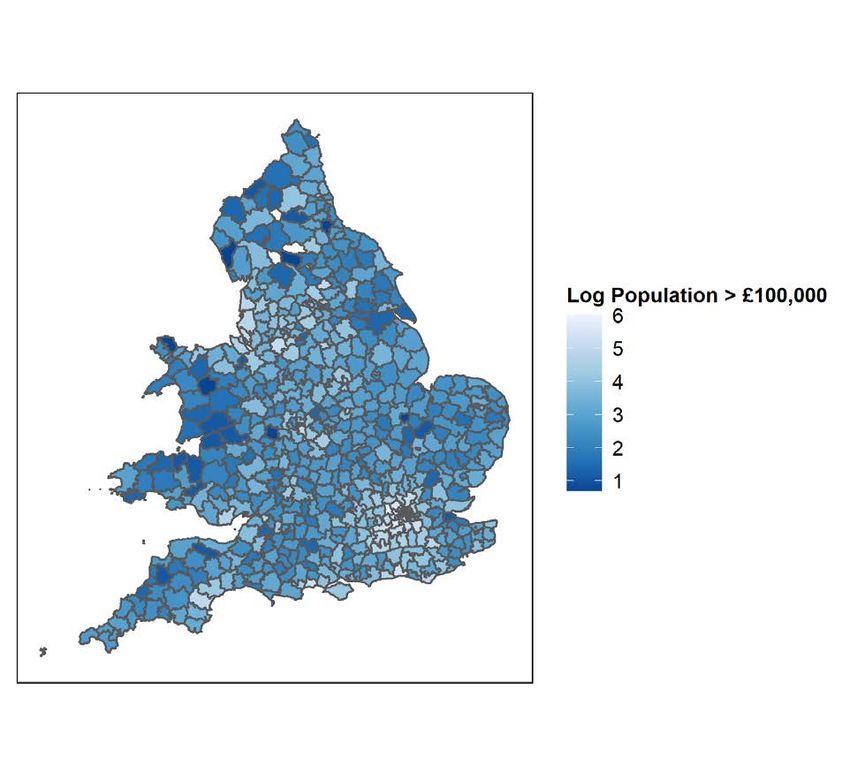
THE SECOND WORLD WAR, INEQUALITY AND THE SOCIAL CONTRACT
                              IN ENGLAND

                                       Leander Heldring
                                      James A. Robinson
                                       Parker J. Whitfill

                                         January 2022

We would like to thank Mark Harrison and Arthur Spirling for their guidance to the literature,
Daniel Waldenström for his detailed comments, and seminar participants at the London School of
Economics for helpful comments particularly Daron Acemoglu, Timothy Besley, Frank Cowell,
Steve Machin, Steve Pischke, Ronny Razin and Noam Yuchtman. We also thank an editor and
anonymous referee for their advice and suggestions.

© 2022 by Leander Heldring, James A. Robinson, and Parker J. Whitfill. All rights reserved.
Short sections of text, not to exceed two paragraphs, may be quoted without explicit permission
provided that full credit, including © notice, is given to the source.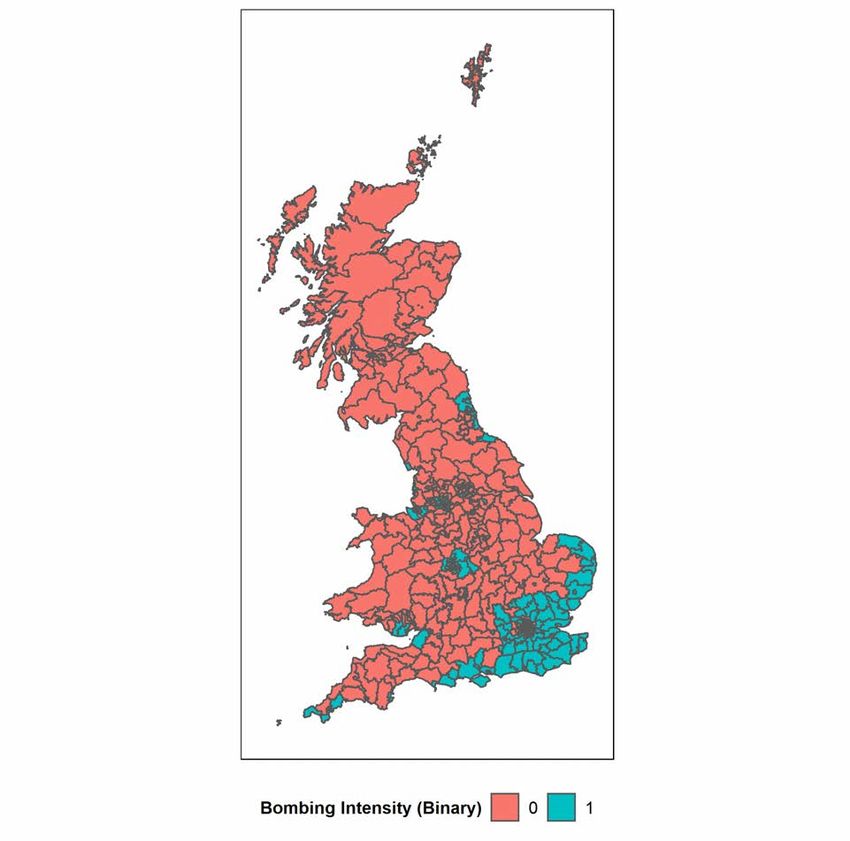
The Second World War, Inequality and the Social Contract in England
Leander Heldring, James A. Robinson, and Parker J. Whitfill
January 2022
JEL No. D3,H5,N4,O52

                                          ABSTRACT

What is the impact of warfare on inequality and the social contract? Using local data on bombing,
the evolution of wealth inequality and vote shares for the Labour Party in England around World
War II we establish two results. First, on average, we find no impact of bombing on inequality.
However, there is considerable heterogeneity and this result is driven by the south. In the north of
England bombing led to significant falls in inequality. Second, heavier bombing led to a
significant increase in the vote share for Labour after the War everywhere, but this effect is
transitory in the south while it is permanent in the north. Our results obtain both in a simple
difference-in-differences framework as well as in a panel-regression discontinuity framework in
which we exploit the limited range of German fighter escort planes. Our results provide novel
causal evidence for the inequality reducing impact of warfare and we interpret them as consistent
with the notion that the impact of the War also led to a reconfiguration of the social contract in
England.

Leander Heldring                                 Parker J. Whitfill
Kellogg School of Management                     University of Chicago
Northwestern University                          whitfillp@uchicago.edu
2211 Campus Drive
Evanston, IL 60208
and briq Institute
leander.heldring@kellogg.northwestern.edu

James A. Robinson
University of Chicago
Harris School of Public Policy
and Department of Political Science
1307 East 60th Street
Chicago, Illinois 60637
and NBER
jamesrobinson@uchicago.edu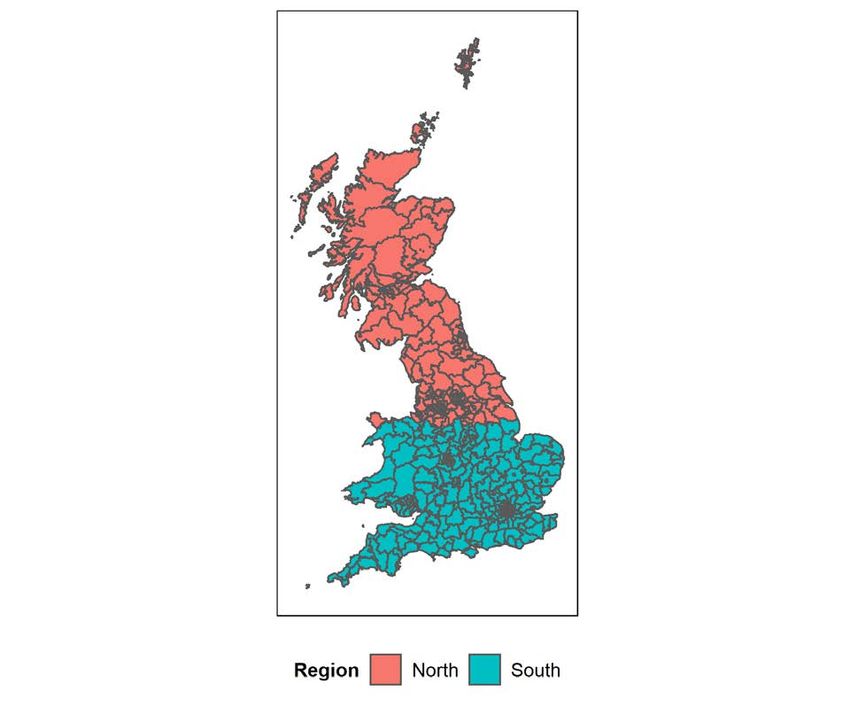
1    Introduction

The existence, sources and dynamics of inequality is one of the most controversial and important set of
topics in economics. Inspired by the work of Classical economists like Ricardo or Marx, modern research,
spearheaded by Kuznets (1955), initially focused on how the intrinsic dynamics of capitalist development
tend to lead to first increasing and then decreasing inequality (Williamson, 1985). Yet recent research has
focused more on the impact of large shocks, such as warfare or pandemics, as drivers of inequality and
has also emphasized policy choice, not simply the dynamics of accumulation (Scheidel, 2017). Shocks and
policies interact, since large shocks may not only have direct effects on inequality, for example through
the destruction of assets, or dramatically altering patterns of scarcity, but may also have indirect effects
by creating new political coalitions or leading to the re-forging of social contracts with important policy
consequences.
    In this paper, we examine the direct and indirect effects of World War II (WWII) on wealth inequality
in England. A literature stemming from Titmuss (1950, 2001) has emphasized the indirect channel via
which the need to mobilize people and compensate them for the costs and sacrifices of the war led to a
more egalitarian social contract. Or as he put it:

      “The waging of modern war presupposes and imposes a great increase in social discipline [which]
      is only tolerable if, and only if, social inequalities are not intolerable”. Consequently, war “must
      influence the aims and content of social policies not only during the war itself but in peacetime
      as well.” (Titmuss, 2001, p. 77-78)

    In Titmuss’ view, the emergence of the Post WWII welfare state and redistributive policies were a
quid-pro-quo which was necessary to get people to tolerate the sacrifices needed to defeat the Axis powers.
Titmuss discusses many channels via which individuals were impacted by the war, such as evacuation, the
consequences of the defeat at Dunkirk, mass conscription and factory work, but a salient one was simply
the effects of wartime damage and destruction. Titmuss argued that the political class quickly realized
that this made the status quo no longer tenable.

      “the bombing of homes during 1939-1940 stimulated inquiry and proposals for reform long before
      victory was even thought possible ... The mood of the people changed and ... values changed
      as well. If dangers were to be shared, then resources should also be shared” (Titmuss, 1950, p.
      508)

Titmuss points out how even the Times newspaper launched leading articles affirming the need for “economic
reconstruction” along with “equitable distribution” and argues that “This was a declaration of faith. In

                                                       1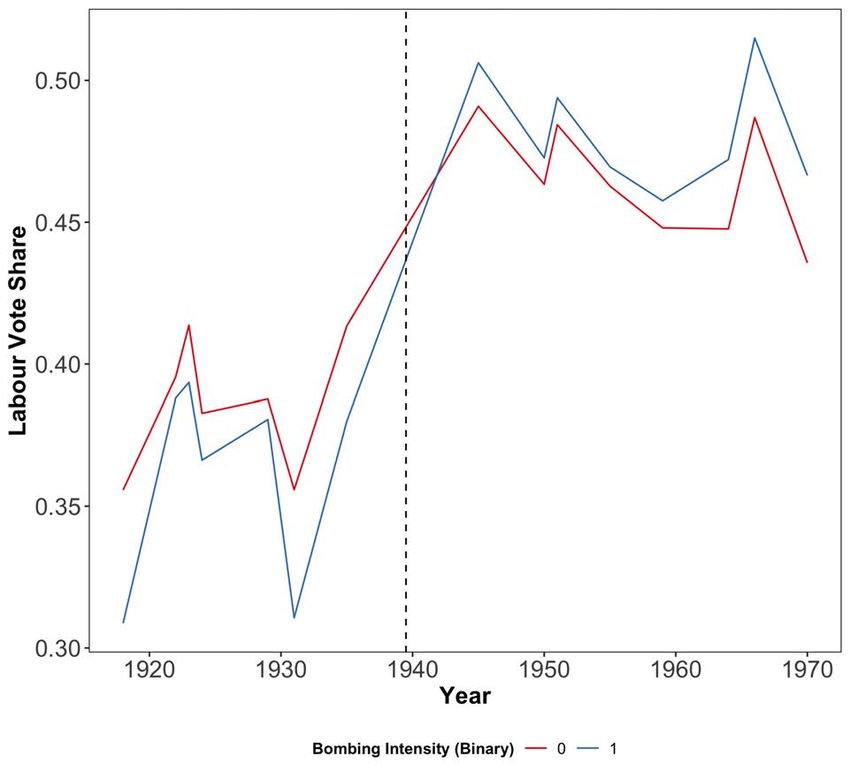
a few months it was to be repeatedly affirmed with the bombing of London and Coventry and many
other cities” (Titmuss, 1950, p. 508). Baldwin concludes his more recent study by arguing “The bombing
raids’ indiscriminate destruction, blighting Bloomsbury as thoroughly as Brixton, prepared the ground
psychologically for a wider sharing of risks” (1990, p. 109).
   The direct impact of war destruction on inequality has also received recent attention. Piketty, for
example, discussing the impact of the twentieth century World Wars on inequality in France, notes

      “most importantly, the physical destructions induced by both world wars were truly enormous
      in France. According to the best available estimates, about one-third of the capital stock was
      destroyed during World War I and about two-thirds during World War II” (2003, p. 1020)

   Piketty and Saez (2014) attribute one third of the fall in inequality in France and Germany to the
consequences of World War II emphasizing the “direct war-related physical destruction of domestic capital
assets (real estate, factories, machinery, equipment)” (p. 840). Another third is explained by a fall in asset
prices, mostly caused by government policies such as nationalization and taxation.
   Titmuss’ view dominated the scholarly literature on the emergence of the British welfare state for
decades after he wrote (e.g. Addison 1975) but has never been tested empirically. To do so is the objective
of this paper. In particular we attempt to research whether either or both the direct and indirect channels
are present. To investigate these issues we put together the most comprehensive existing dataset of wealth-
at-death for all English people subject to probate, by year, between 1930 and 1954. Though this data has
been examined in aggregate time-series before (for example by Harrison and Atkinson 1978, Alvaredo et al.
2018 and Cummins 2021) the micro-data has never been analyzed empirically. This allows us to construct
a geo-located measure of wealth inequality (the probate records record the street address of the deceased
from which we identified the latitude and longitude).
   To construct a treatment variable, we collected information of the precise location of bombing raids by
the German Luftwaffe. Though, as our discussion above suggests, there are numerous channels via which
the war impacted people lives, welfare and political views, the direct effects of the damage wrought by
bombing is one of the most discussed and obvious channels to investigate.1 Moreover, as we discuss below,
our identification strategy gives us some leverage on these other hypotheses.
   With these two datasets on wealth inequality and bombing we can first investigate the direct effect of
bombing on inequality. We do this in two ways. The first is a difference-in-difference analysis, by bombing
status, before/after bombing. In the second, we exploit a unique feature of the bombing data. Because
of the range limitations of fighter escorts, there was a definitive limit to how far German bombers could
  1 Interestingly,   Titmuss’ own house in London was bombed during the Blitz.

                                                             2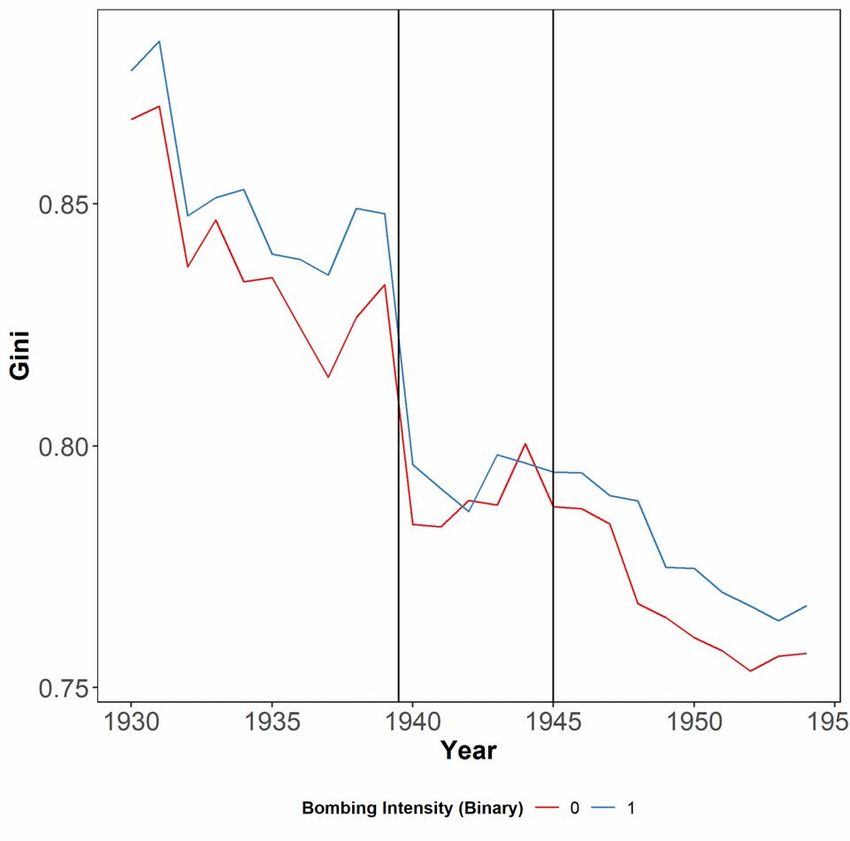
penetrate into England. This allows us to conduct a regression discontinuity exercise using the maximum
ranges of the German fighter planes from known airfields in France.
   Our first set of findings are very consistent across both empirical models. We find no statistically
significant effect of bombing on wealth inequality. On the face of it, this is consistent with Alvaredo et al.
(2018) who eyeball the time series and detect no large impact of the Second World War on wealth inequality
in the UK.
   Our second set of findings concern the indirect effects, in particular whether bombing contributed to
the formation of a new social contract. It is not obvious in Titmuss which specific aspect of the war led
to this reconfiguration, though as we saw, Titmuss did emphasize the Blitz. Measuring the social contract
itself it also challenging. Many of the new policy issues, such as the creation of the National Health Service,
were national in scope and cannot be mapped easily onto our local data about bombing. Moreover, in
reality, no policy or social change is ever unanimously preferred to another. The most natural approach to
this is to look directly at the vote share of the Labour Party at the level of a parliamentary constituency
(aggregating the bombing data to this level). As we discuss shortly, it is clear that in the 1945 general
election the Labour Party was more committed to the vision of the 1942 Beveridge Report, which laid out
a vision of a new post-war social contract, than were the Conservatives. Therefore, we hypothesize that if
the effect of bombing was to stimulate the demand for a new social contract, as Titmuss conjectured, then
this would show up in a positive correlation between bombing and the vote share of the Labour Party.
   To analyze the indirect effects on the social contract we use the same difference-in-differences and
regression discontinuity models. In the difference-in-differences model we find that a large and persistent
increase in the vote share of the Labour Party is associated with high bombing intensity. However, in
contradistinction, in the regression discontinuity analysis, we find this effect to be there only in 1945. By
the 1950 general election it goes away.
   It turns out there is a simple explanation for these differences which is very revealing about both the
direct and indirect effects of bombing on inequality: there is significant heterogeneity between the south
and the north of England (split according to the median latitude). When we re-do our analysis breaking the
sample into the north and south, our difference in difference results shows large negative effects of bombing
on inequality in the north, but nothing in the south. Our initial average zero effect was driven by the south.
Since the study boundary in our regression discontinuity is in the south (the German bombers came from
France and the Low Countries) these results do not change. Turning now to the vote share for the Labour
Party as the dependent variable, we find that the persistent change in the basic difference-in-differences
analysis is driven entirely by the north. For the south, the difference-in-differences analysis is identical to
our regression discontinuity analysis: there is a significant increase in the vote share of the Labour Party

                                                      3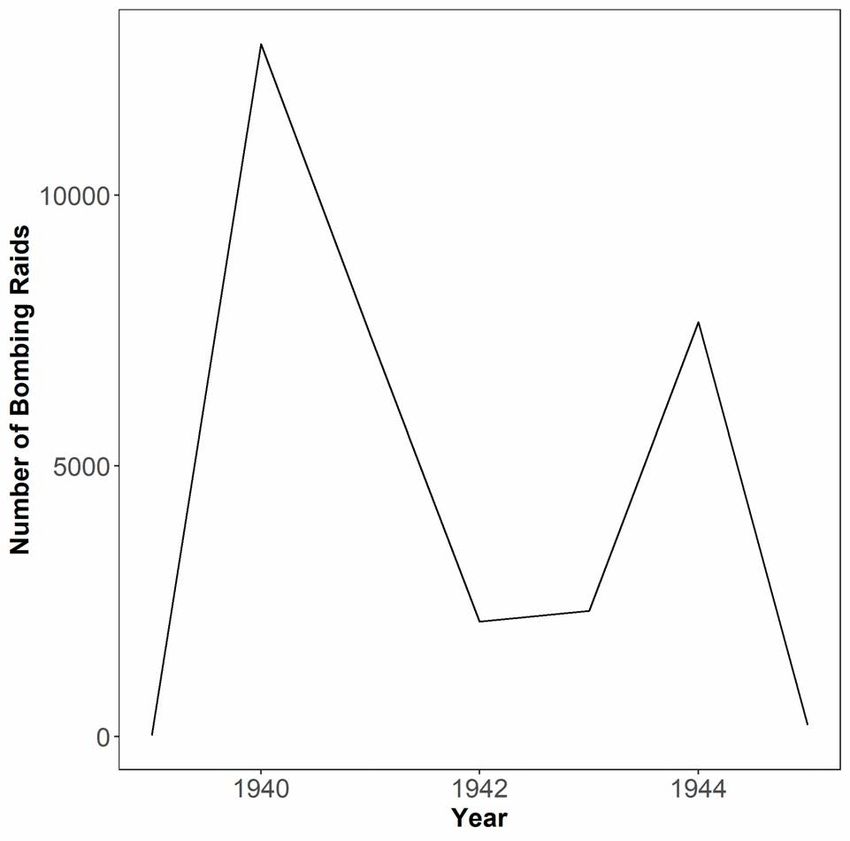
in 1945 in heavily bombed areas, but not afterwards.
   We interpret these results in the following way. The difference between the direct effects of bombing
in the north and the south is that in the north the bombing was far more targeted at ports and industrial
centers, like Leeds, Newcastle, Sheffield, Sunderland and Middlesborough, wiping out significant amounts
of capital and top wealth which were never recovered. We support this interpretation by showing that
there is a persistent negative effect of bombing on average wealth in the north. This did not happen in the
south because there the bombing was far less focused (at least partially intended to undermine “morale”)
and impacted rural areas and residential parts of London, as well as ports and industrial areas.
   With respect to the indirect effects, we believe our results are consistent with the notion that bombing
reconfigured the social contract. In 1945 there was an average shift towards the Labour Party which
is causally related to bombing intensity. The obvious interpretation of this is that wartime destruction
shifted peoples’ preferences towards the type of welfare state that Beveridge had promised but which
only the Labour Party was committed to. The reason this shift lasted only until 1951 was that Labour
delivered in a permanent way large parts of this agenda, particularly the National Health Service (NHS).
Once this was created, other political issues became salient and voters in the south switched back to the
Conservatives. In the north, the persistent negative impact of the bombing on average wealth gave other
grounds for people to continue to vote Labour, despite the fall in inequality which it also induced.
   Though our focus on bombing might be thought overly narrow, in fact our regression discontinuity
analysis is telling about the plausibility of other channels. For example, for our 1945 election result to
be driven by other mechanisms, such as wartime recruitment into military service or factory employment,
these factors would have to jump discontinuously at the bombing boundary, which seems implausible. It
might be thought that evacuation might jump at the discontinuity and detailed pre-war plans did logically
take into account the likely penetration of German aircraft. Yet, “plan 2”, formulated in January 1939
designated broad areas for evacuation, focused on London (see Titmuss 1950, p. 33) and the detailed
discussion in Titmuss 1950, Chapter 3, provides no evidence that evacuation was fine tuned to match our
boundary. Despite recent skepticism about Titmuss’ arguments, therefore, we interpret our evidence as
being highly consistent with his original emphasis on the consequences of bombing and wartime destruction.
   These findings offer quite a few innovations over the existing literature. First, while as we noted above,
scholars have proposed important impacts of war destruction on inequality in France and Germany, the
consensus seems to be that England was “little hit by war destructions” (Piketty, 2011, p. 1077) and that
this was a case “where domestic capital destruction was of limited importance” (Piketty and Saez, 2014,
p. 840). This view is echoed by British historians with Edgerton noting “In world war II the impact of
bombing as a collective threat has been exaggerated – it lasted only for some months and only applied

                                                     4
to certain restricted places” (2018, p. 223). In fact we show that wartime destruction had an enduring
negative impact on inequality (and wealth) in the north.2
Second, our results shed new light on the debate about the accuracy of Titmuss’ hypothesis. Recent
research has tended to reject this on the grounds that in fact there was no consensus about the creation
of a welfare state or the type of society that English-people wanted to see after 1945. There was therefore
no new social contract of the type Titmuss postulated. Historians illustrate this by pointing out that large
differences that remained between the Labour and Conservative parties even after the wartime coalition
government accepted the recommendations of the 1942 Beveridge Report.3 Though the coalition govern-
ment did finally produce a white paper in 1944 outlining commitment to Beveridge’s vision, there were large
gaps in reality. Baldwin notes that the initial reaction to it by the Conservative party, which appointed
a secret committee to report in response to it was to “criticize many of Beveridge’s recommendations as
extravagant and socially debilitating” (1990, p. 130). Harris, in a wide-ranging review of this issue observes
“the lack of commitment to social reformist issues shown by Churchill and his closest advisers” (Harris,
1992, p. 27). Jefferys states “the emergence of a consensus between the parties during the war has also
been overstated” and he points to the “the deep-seated differences which continued to exist between the
Conservative and Labour parties over welfare reform” (1987, p. 124). Moreover, “Conservative and Labour
members in parliament were ... not agreed upon the need for a fundamentally new approach to social
welfare” (1987, p. 124).4 Harris emphasizes not just the lack of consensus amongst the politicians, but also
amongst the people, for example as revealed by the Mass Observation project undertaken during the war
to monitor the country’s morale (Harris, 1992).
We agree that there was no consensus about many of Beveridge’s reforms, but it is plausible that they
were overwhelmingly popular. Todman, in the most recent historical synthesis of this period concludes
“The scale of the country’s military endeavour during the war had been such that the ideas of
fairness and mutual obligation inculcated by service became an influential factor once ‘normal’
electoral politics resumed” (2020, p. 761).
Likewise Kynaston (2007) though he criticizes Titmuss’ 1950 book for its “Whiggish, feel-good reading
- unity forged through adversity, irresistible pressure from below leading to longed-for change” (p. 40)
2 What “little hit” means in reality is not clear. Over the entire 1939-1945 period 62,000 civilians were killed by “enemy
action” nearly all by bombing raids (Titmuss, 1950, p. 559); around 400,000 were injured (p. 560); over 4 million people
were evacuated from their homes (pp. 563-564); 3,745,000 different houses were damaged or destroyed, about 2 out of every
7 (p. 330); 20% of all schools were damaged or destroyed (p. 331); and of course there were heavy damages to factories,
manufacturing industry and infrastructure facilities such as railways and ports.
3 There is a parallel and more vitriolic literature by historians and public intellectuals attacking Titmuss for painting a
romanticized vision of the “Blitz culture” (Titmuss himself remarks “Dunkirk, and all that the name evokes” (1950, p. 508)).
This literature argues that this whole notion is a construction of wartime propaganda and does not reflect what actually
happened during the war, see for example Calder (1991) and Ponting (1993).
4 See Smith (1986) and Lowe (1990) for other important contributions to this perspective.
5nevertheless accepts that in fact, with respect to Titmuss’ main argument, “there were plausible grounds
for it”. To be correct, Titmuss’ thesis does not require that everyone was in favor of a welfare state. In fact,
it is exactly this point which motivates our use of the Labour Party vote share as a measure of the support
for a new social contract since in 1945 they, but not the Conservatives, were committed to it. However,
once the Attlee Labour government delivered on its promises, “Its historic mission seemed to be fulfilled”
(Hennessey, 2006, p. 423),5 innovations like the NHS were a fait accompli, and by the 1950 and 1951
elections what became known as “Butskellism” emerged, whereby the Conservatives became reconciled to
the welfare state. With this issue off the table, people in the south who had voted Labour switched back to
the Conservatives. Our results therefore re-instate at least some notion that bombing did create a general
reconfiguration of the social contract.6
The lack of commitment to the Beveridge report on the part of the Conservative party is particularly
evident with respect to its vision of universal health care under a government run National Health Service
(NHS). Hennessey notes “Those who argue that the NHS as it was eventually constructed was very largely
the creation of Coalition thinking tend to forget the weakling of a scheme ... left in place when the
Government changed in July 1945” (2006, p. 135). In his view it was the Labour victory that delivered
the NHS. Edgerton concurs stating “The NHS as it emerged was clearly not something the Conservatives
would have enacted” (2018, p. 220) and Jefferys similarly points out “the important differences between
the coalition plan of 1944 and Labour’s subsequent legislation” (1987, p. 133) and he quotes Lord Woolton,
Minister of Reconstruction as saying that “the working out of the new health service would be very different
under a Conservative Government than it would be under a Socialist Government” (1987, p. 136).
Differences were evident to voters not just with respect to the form of healthcare. Jefferys argues “For
the Conservative leadership, unemployment in the post-war years was to be avoided - if not by a return to
pre-1939 conditions - by a heavy reliance on traditional remedies: the stability of sterling, the revival and
expansion of export trade, and above all the encouragement of private enterprise” (1987, p. 138). Todman
observes on the part of the Conservatives “a mismatch between the talk of fiscal orthodoxy and removal of
controls and promises of improved social services” (2020, p. 752).
Our research is related to several other literatures. Most notably Scheve and Stasavage (2016) developed
a social contractarian argument for the correlation between the world wars and higher rates of taxation on
the rich. In their argument, the poor agreed to fight and the rich agreed to pay taxes in compensation.
Though our analysis is in the spirit of their research it should be clear from the above discussion that our
regression discontinuity results are not consistent with their mechanism for which they provide no direct
5 King notes “The fit between what the Labour Party said it would do in 1945 and what the Labour Government actually
achieved between 1945 and 1951 is astonishingly close” (1975, p.163).
6 See McCallum and Readman (1964) and Crowcroft and Theakston (2013) on the 1951 General Election.
6evidence. Relatedly, Goodin and Dryzek (1995) propose an alternative mechanism whereby wartime sacri-
fices lead to subsequent redistribution, though they do not explore this empirically (for a more normative
account see Dryzek and Goodin 1986). A series of papers, particularly Davis and Weinstein (2002), Miguel
and Roland (2011), and Dell and Querubín (2018) have studied - in different contexts - the long-run impact
of bombing during wartime. The main finding of all three papers is that there are no persistent effects
of bombing on the size distribution of cities, development or rebel activity respectively. Our focus is very
different and none of these papers examine the effects on inequality or investigate whether bombing might
have had implications for the social contract. Finally, there is a large and multi-faceted literature on the
social, economic and political consequences of warfare. The connection has been made to democratization
(Therborn, 1977; Acemoglu and Robinson, 2000; Aidt and Jensen, 2014), state building (Tilly, 1990; Besley
and Persson, 2011) and specific policy initiatives like income taxation (Aidt and Jensen, 2009). None of
this literature has empirically investigated the impact of war destruction as a source of variation, nor to
our knowledge examined voting behavior as a specific outcome.
2 Data and measurement
In this section, we introduce the unit of observation and the data that form the basis of the empirical part
of our paper. Our focal outcomes are wealth inequality and voting behavior, in particular the vote share
of the Labour Party.
2.1 Unit of Observation
Our unit of observation depends on which of our two main outcomes we study.
Wealth and inequality. For economic outcomes, such as per capita wealth and the Gini coefficient, the
unit of observation is a registration district, which is an administrative region used for the civil registration
of births and deaths. We choose this unit of observation so that we are able to combine individual data
on recorded wealth with data on population, which allows us to record individuals that are too poor to
have any recorded wealth. Population figures are recorded at the registration district, and we therefore use
these as our unit of observation. There are around 600 registration districts in England and Wales which
are used in our study. We measure registration districts as recorded in the 1911 census and use these as
consistent units throughout our study.
Voting. We measure voting at the level of the parliamentary constituency. In each constituency,
voting determined which Members were sent to Parliament (MPs). There are around 600 constituencies
throughout England, Wales and Scotland within our sample period, but they are not consistent over time.
7We take constituencies as they existed between 1918-1945 as our unit of observation and conform border
changes that take place after 1945 to the 1918-1945 constituencies. For example, if in 1955 a constituency
is split into 2 constituencies, we take the average of a variable across these two split constituencies and
assign this average to the 1918-1945 original constituency.
2.2 Treatment: War time bombing
To measure the local impact of the War, we collect novel bombing data from the Ministry of Home Security’s
Daily Intelligence Reports, which were recently digitized. The Intelligence reports record the locations of
over 30,000 bombing raids in England, Wales and Scotland over the course of WWII. Each raid is defined
as any aerial attack with intent to destroy, geocoded to the location the bombs hit. We assign the location
of each raid to a registration district or a constituency.
Naturally, the sizes of constituencies and registration districts as well as the intensity of bombing vary.
We therefore transform the number of bombs within a unit of observation in two ways. First, normalize by
number of bombing raids
unit of observation area: square km . Second, to account for the large tail of bombing intensity
we transform our normalized bombing intensity in two further ways.7 First, in our preferred specification
we split bombing intensity by median intensity, creating an indicator which is equal to one if a unit
of observation was bombed intensively. Second, in the Appendix we show all our results are robust to
exploiting the full range of bombing intensity. We also omit London from our baseline analysis.
We visualize our binary bombing intensity measure for parliamentary constituencies in Figure 1. There
are two important things to note. First, bombing in the north and south appear qualitatively different. In
the south, and in the south-east in particular, constituencies are uniformly bombed more intensively, but
in the north intensive bombing appears concentrated on industrial centers, such as Liverpool or Newcastle.
Because of this heterogeneity in bombing intensity between north and south, we study heterogeneous effects
by these areas throughout the empirical part of this paper. We define the north as the area of Great Britain
with a latitude greater than the median latitude in our sample of constituencies. Appendix Figure 11 plots
north-south border.
2.3 Wealth
To measure wealth and wealth inequality, we use the United Kingdom’s Principal Probate Registry Cal-
endars which record individual names, addresses and the value of assets for people who are liable to pay
inheritance tax. See Figure 2 for an example of what the original data looks like. We digitize all records
7 While the median bombing intensity is around .17 and almost all units of observation see less than one bombing raid per
square kilometer, there are parts of London with a bombing intensity over 100.
8available between 1930 and 1954 using OCR technology. Because each person has a location of their home
included in their probate, we are able to geolocate each probated individual and assign them to a regis-
tration district. We can use the resulting dataset to compute our measures of interest, such as average
per capita wealth or the Gini coefficient of wealth. Probates needed to be filed based on a wealth cut-
off. Cummins (2021) documents the proportion probated each year and the probate threshold each year.
Somewhere between 30 − 70% of individuals who pass away in a given year are probated, depending on
the year. As a robustness check on the potential impact of the varying probated individuals, we augment
the probate data with records on the total number of deaths in each registration district. Using this data,
we can infer how many individuals are missing from the probate data. Following Cummins (2021), we can
impute the wealth of those not in the probated sample by assigning them half of the probate threshold.
This procedure allows us to recover a measure of wealth for the full population, rather than only for those
people wealthy enough to be probated. However, even this process is imperfect because it is still impossible
to know if an individual that does not show up in the probate data was too poor to be probated or was lost
due to OCR errors in digitizing the original material. We therefore estimate our main results for probated
individuals only. In the Appendix, we re-estimate all results using our best reconstruction of the entire
population.8
2.4 Voting
To measure support for the Labour Party we record the vote share of each party in each election between
1918 and 1970 from Watson et al. (2020). Our primary outcome variable in voting is Labour’s vote share
in a constituency.
2.5 Other Variables
We use several covariates. These include electorate size, population size, and the type of constituency,
either county or borough (corresponding roughly to towns and countryside). We introduce these as they
become relevant in the paper.
3 Results: Difference-in-Differences
In this section, we present our first set of results in a difference-in-differences framework. After introducing
the estimating equation, and discussing inference, we first estimate the relationship between the impact of
8 Sometimes, the literature using wealth-at-death data attempts to impute wealth-while-alive using a mortality multiplier.
We do not do this because there is no age data in the probated records.
9the War, as captured by bombing, on inequality. We find a small and insignificant average effect. In the
north, however, we find a negative and statistically significant effect whereas for the south we estimate a
precise zero effect. We then estimate the effect of the War on votes for Labour. We find that, on average,
the War leads to a shift in voting patterns in favor of Labour. In the south this effect is only present for
the first immediate post-war election, whereas the effect persists in the north.
3.1 Estimation Equation and details
Our estimating equation takes a standard panel difference-in-difference form. We estimate this equation
using ordinary least squares (OLS)
X
Yct = γt + ρc + βr Dc 1{t = r} + ζXt + ct (1)
r∈R
The variable Yct is the outcome of interest, either the wealth Gini or Labour’s vote share for unit c in year
t, where c is either a registration district or a parliamentary constituency, respectively. Dc is an indicator
for being above median bombing intensity over the War, defined above. Xt are covariates mentioned above.
The model includes time γt and unit ρc fixed effects. We omit the last pre-period before the start of the
War, unless otherwise noted. For our Gini data this corresponds to 1938, while for our Voting data this
corresponds to 1935. Therefore, we express all estimated effects relative to this omitted year. R is the set
of years in our sample that are not omitted.
The first coefficients of interest are βt >= 1939, which estimate the effect of bombing intensity in year
t. The key identification assumption is the parallel trends assumption: Absent treatment, treated units
would have evolved on parallel trends with non-treated units. This assumption is untestable, but we study
pre-trends to study whether this assumption is plausibly met. Specifically, we study coefficients on the
pre-period bombing-indicators, βt for tnon-intensively bombed registration districts, the Gini coefficient falls by about 0.05 around the start of
the War. In terms of magnitude, it is similar to earlier jumps or drops in the time-series (not all shown).
This is consistent with the conclusions from Alvaredo et al. (2018), who observed a fall in wealth inequality
around WWII, but it is not large nor obvious that the fall is directly attributable to WWII. Moreover, in
all years before 1939, bombed and non-bombed districts appear to be evolving similarly. After 1939, there
appears to be no or at most a small change in the Gini coefficient for highly bombed places compared to
non-highly bombed places.
We probe these preliminary conclusions by estimating equation 1. We present our results graphically in
Figure 4 where we plot estimated coefficients and confidence intervals, year by year. Pre-treatment coeffi-
cients measure the presence of pre-trends, while the post-period coefficients capture the average treatment
effect of being bombed intensively over the course of the War, in year t. The first result in Figure 4 is
that pre-1939 coefficients are not significantly different from zero, pointing to parallel pre-trends which,
in turn, lends credence to our claim that the parallel trends assumption is met. We fail to reject a joint
F-test for the null hypothesis that all the pre-period coefficients are 0. Our second result pertains to the
post-treatment coefficients. By and large, the post-treatment coefficients are indistinguishable from zero
and are all economically rather small, around 0.01. A joint F-test of all post-1938 coefficients indicates a
small overall negative effect.9
We anticipate that this result may be qualitatively different over space, as our map in Figure 1 suggests
that whereas the south, especially around London, was uniformly bombed, bombing in the north appears
concentrated in and around industrial cities. In the next section, we therefore break our results up by this
division.
3.2.1 Heterogeneous Effects
To investigate heterogeneous effects, we break up our sample into north and south England. We then
re-estimate equation 1 in each sample. Figure 5 presents results from both regressions in one coefficient
plot. We find substantial heterogeneity between north and south. In the south, we observe no effect of
bombing whereas in the north, there is plausibly a negative effect. Almost every year after treatment, the
coefficients are about −.025. Because of the lower sample sizes, estimates are more noisy, but 1945, 1949,
9 The most important robustness concern pertaining to these results is the nature of our wealth data. A natural concern
is that capital is held by people all over the country, while the owners of capital live in London. Since all our regressions
compare local bombing to local outcomes, we might be mismeasuring local wealth outside London. In the Appendix, we
perform the following check: We see whether there is a change in wealth of those living in London when areas outside London
are bombed. If we see a correlation, this could be consistent with our concern. We find no correlation, and we interpret
this finding as indicating that this measurement concern is not quantitatively important. We implement several additional
robustness checks. We first check robustness to varying the way we measure bombing. Instead of binarizing bombing, we use
the inverse hyperbolic sine transformation of the number of bombing raids, and find similar results.
111952 and 1954 are significant at the 5% level, while 1947 and 1953 are significant at the 10% level. These
results show the advantage of looking at the micro-data, as these heterogeneous effects run in contrast to
Alvaredo et al. (2018)’s conclusion that WWII has a small direct effect on wealth inequality (which was
based on the aggregate time-series). Our new data allows us to bypass the aggregate to view these more
granular heterogeneous effects. These results show that the small negative aggregate effect is driven by the
north. In our introduction, we interpreted this effect as being driven by differential targeting of industrial
centers vs more broadly targeted bombing in the south. We return to this point below.
In sum, we find that bombing has a significant negative effect on wealth inequality in the north, and
no effect in the south. On average, and in line with the previous literature on this topic, there is an
economically insignificant effect of bombing.
3.3 Voting
In this section, we study voting patterns for Labour. In the introduction, we reviewed the historical
literature on the post-war success of the Labour Party, and the potential role of the War in generating
support for redistribution. In this section, we use the share of the vote going to Labour in a parliamentary
constituency as a measure of this change, and we relate it to bombing intensity.
As with the Gini coefficient, we present our results in a few different ways. First, Figure 6 presents
sample means of Labour’s vote share split by bombing intensity. Note both the large increase in the vote
share for Labour in 1945 (about 15 percentage points) and the differential increase for intensively bombed
and non-intensively bombed places. Note also the parallel movement of the vote shares between intensively
and less intensively bombed parts of England. The overall increase in Labour vote share in 1945 has
been extensively studied, as we document in the introduction. However, the differential rise in bombed
versus non-bombed places is a new stylized fact that we add to the literature. This more ‘micro’ fact is
fully consistent with the argument of Titmuss (1950, 2001) that bombing caused an increased demand for
redistribution in the form of a new social contract (which manifested itself as votes for the Labour Party
which was committed to this policy).
Figure 7 presents formal regression estimates of equation 1 with voting as the outcome variable. The
coefficients on the pre-period bombing indicators are all not significantly different from 0 before 1945,
indicating the parallel trends assumption holds. A formal F-test that all the pre-period coefficients are
jointly 0 fails to reject this hypothesis. After the War, the estimated coefficients for bombing increase
to around 4 percentage points starting in 1945, indicating a large treatment effect and a shift in voting
patterns towards Labour. Interestingly, the effect persists until the last period for which we have data,
121970. Labour appear to be getting a 4-5 percentage point advantage in every election after 1970.
To get an intuitive sense of the magnitude of this effect, we estimate how many seats Labour could
attribute to bombing and if its parliamentary majority hinged on these seats. While this is generally not
possible to estimate, it is feasible if we assume constant treatment effects. With constant treatment effects,
each constituency’s counterfactual Labour vote share can be calculated as
Current Labour Vote Share − 1{Above Median Bombing} ∗ Average Treatment Effect
where we take the average treatment effect from our estimate of equation 1. Table 2 shows this advantage
consistently delivered at least 20 seats and without this advantage Labour would have lost the 1950 election.
While the treatment effect is large in the first few elections after the end of WWII, 1945 was a landslide
for Labour, so this effect only becomes decisive when the election was close in 1950.
3.3.1 Heterogeneous Effects
As before, we split our sample by the north and south of England and re-estimate equation 1 in each
sub-sample. Figure 8 plots both coefficients. Once again we see interesting heterogeneity. The effect of
bombing on voting in the south is transitory and wanes after the immediate postwar election, whereas
the persistent average effect we find is driven by the north, where Labour retains its advantage. We
interpreted these results in the introduction as being consistent with the reconfiguration of the social
contract. Throughout the country in 1945 voters shifted to Labour the more they suffered from bombing
and this reflected sentiment in favor of the social changes proposed by Beveridge. But these different voting
patterns were only transitory in the south. When the Labour government delivered, southern voters went
back to supporting the Conservatives. In the north the shift persisted, despite the fall in wealth inequality.
Why this might be do is revealed by Figure 9 which instead of looking at wealth inequality uses the probate
records to construct a measure of per capita wealth at death. Here we see a sustained negative impact of
bombing on average wealth in the north but not in the south. This seems plausibly related to the relatively
more focused bombing in the north on industrial and port complexes. Plausibly this destroyed capital and
businesses that never recovered and this hysteresis created economic problems, such as unemployment and
poverty which show up in the average wealth data and are reflected in the vote share of the Labour Party.
These mechanisms did not operate in the south.
From an identification perspective, the main problem with difference-in-differences estimates are cor-
related shocks. The War clearly not only involved bombing, but also factors like military recruitment,
the creation of war industries, and population movements. These factors may well be correlated with
13bombing patterns and thus may invalidate our interpretation of our estimates. To address this concern,
we re-estimate the effect of WWII bombing in a regression discontinuity framework.
4 Results: Regression Discontinuity
In this section, we implement a regression discontinuity design within our panel dataset. As we will see,
this provides evidence which is very consistent with our earlier results.
4.1 Historical Background
During the Battle of Britain, Germany engaged in a massive air assault on Britain. To bomb Britain,
Germany needed both bombers and fighters. If bombers were sent without fighters, especially during the
daytime, the causality rate of the bombers could not “hold the loss rate down to acceptable levels” (Murray,
2015, p. 46). While some bombers were nonetheless sent without fighters, especially to the northern and
eastern ports of Britain, how many bombers could be sent to any place in Britain was influenced by the
presence of fighter escort planes. These planes had more limited ranges than bombers, creating a range
within England below which escort planes could easily accompany bombers and above which escort planes
had to turn back. We posit that this limited range of escort planes creates a natural discontinuity in the
probability of a place being bombed intensively.
The main escort plane the Germans used at the start of the War was the Messerschmitt BF 109E.
These fighters had a ‘combat radius’ of around 125 miles, meaning a fighter could reasonably expect to
have enough fuel to take off, fly 125 miles, fly back 125 and land (McNab, 2012; Mawdsley, 2020). This
limited combat radius was because the BF 109E’s were designed primarily for defensive flight rather than
offensive fight (Murray, 2015). The range limitation lasted throughout the Battle of Britain, and it did
not loosen until drop tanks were added to the BF 109F in 1941. The large effect of the range limitations
of the BF 109E’s on the Battle of Britain has been noted extensively before. The Luftwaffe themselves
considered range a major factor in where they planned to bomb. For example, pilot Oberstleutnant Adolf
Galland even noting in his autobiography that “Germany fighter squadrons ... (were) barely able to cover
the south-eastern part of England” (McNab, 2012).
We collect the full population of airfields used by the Luftwaffe throughout WWII in France, Netherlands
and Belgium. Then we subset this collection to the airfields used for BF 109Es in the Battle of Britain as
per Mawdsley (2020) and Murray (2015). Using this data, we can see the limited range of the escort planes
visually in Figure 10. We hypothesize that the BF 109E’s range limitation generates a fuzzy regression
discontinuity where the cutoff is 125 miles from the bases where BF 109Es were stationed.
14To operationalize this idea we compute, for each observation in our dataset, the distance in miles to
the nearest base and based on this distance we compute an indicator for whether a place is within reach
of the BF 109Es.10
4.2 Estimation
To implement the fuzzy regression discontinuity design, we estimate the following set of equations
X
Yct = γt + f (locationc ) + βr Dc 1{t = r} + ct (2)
r∈R
X
Dc 1{t = r} = γt + f (locationc ) + αr Zc 1{t = r} + uct (3)
r∈R
In the first equation, Yct is the outcome of interest. f (locationc ) is some function of the location of each
unit. We use either straight-line distance to the discontinuity, latitude and longitude, or simply unit fixed
effects. Because unit fixed effects capture the most information about location, we use these as our baseline
specification but vary this in the appendix. Dc 1{t = r} is an indicator of whether the unit is above or below
median bombing intensity times an indicator for the time period. The βr are our coefficients of interest as
they capture the measured effect of being just above the discontinuity in space at a given point in time.
R is the set of all years, omitting only the last pre-period before the start of the War, so that we obtain
point estimates for every other year in our panel. γt are time fixed effects, and ct is a heteroskedasticity
robust standard error, clustered at the unit level.
Because we estimate a fuzzy RD, we instrument Dc 1{t = r} in equation 2. The instrumental variables
P
are αr Zc 1{t = r} where Zc is an indicator for being in range of the BF 109Es. Zc is interacted with
r∈R
period indicators so that we estimate each period effect separately. We again fully saturate R, omitting
only the last pre-period before the start of the War. γt and f (locationc ) are the same as in the second
stage equation. uct is clustered like in the second stage.
While our estimation procedure closely resembles a typical cross-sectional RD design, the fact that
we use a panel dataset weakens some identification assumptions. Most importantly, in a standard cross-
sectional RD design, the key identification assumption is that nothing else changes discontinuously at the
cutoff. In our panel design, any time-invariant unobservables are captured by unit indicators. In our
10 A natural challenge to this approach is the fact that our geographical units of observation, constituencies or districts
allow several ways to compute distances between them and the geocoded points of the airfields. In our main analysis we use
an indicator that is 1 if any part of the unit of observation is in range. In the Appendix, we implement two other methods.
First, we use the closest point in the geographic unit to the airfield. Second, we compute the percent of the geographic unit
within range and use this as the variable of interest, rather than a binary indicator.
15setting, our identification assumption is therefore that there is no time-varying discontinuities that either
appear or change in magnitude over time. Validating the absence of ‘pre-trends’ naturally extends to this
setting. The presence of a pre-trend would suggest that there were time-varying discontinuities at the cutoff
in the years before treatment began. We are not aware of any data-driven way to choose a bandwidth
for a regression discontinuity in a panel setting. We will show that our results hold for a wide range of
bandwidths.
4.3 First Stage
The informativeness assumption of our research design requires that being outside the BF 109E’s combat
range correlates sufficiently strongly with the probability of being bombed intensively. To build intuition
for our assertion that this is in fact the case, we present a map of the combat radius of BF 109Es as well
as which constituencies were in range in Figure 10. The constituencies in the south with above median
bombing almost all within range of the BF 109Es, while the constituencies outside of range are rarely
bombed heavily. We formally extend this exercise to our results by noting that the first stage F-statistics
for each of our endogenous variables is well over the conventional threshold of 10.
4.4 Wealth Gini
We first turn to our results for the wealth Gini coefficient. We estimate the system of equations 2 and 3 in
Figure 11. We plot the coefficients by period. For any bandwidth between 25 and 50 miles, we do not find
any change in Gini around the boundary after 1939, nor any evidence for pre-1939 discontinuities. This
result is consistent with our diff-in-diff estimates for the south.
4.5 Voting
Figure 12 implements the regression implementation of equations 2 and 3 with Labour Vote Share as Yct ,
and plots the coefficients of interest. Consistent with our previous results, we find a positive effect on
the vote share for Labour, but only in 1945, with a positive effect around 8% of the vote share. This
qualitatively replicates the result of the difference-in-difference in the south. Moreover, no pre-period
coefficients are significantly different from 0.
An important advantage of these regression discontinuity results is that other consequence of the out-
break of the War that vary locally, such as military recruitment, are less likely to vary discontinuously
(over time) over our study boundary. As we discussed in the introduction, prominent explanations for
the impact of war on the social contract suggest that this works via the burdens that people had to bear
16serving in the army or in wartime occupations, or perhaps via evacuation. While these channels may be
important, they cannot be an interpretation for our regression discontinuity findings.
5 Conclusion
In this paper, we estimate the direct and indirect effects of bombing on wealth inequality in England during
World War II. The indirect effect works through the impact of bombing on the social contract and thus
policies (Titmuss, 1950) and has long been hypothesized to be important: the War created a coalition
among voters for social reform which was then implemented by the Labour Party, leading to a reduction
in (wealth) inequality in England. The direct effect is simply the impact of the destruction of assets and
the capital stock on inequality.
We combined data on all bombing raids in England during WWII and a comprehensive dataset on
wealth-at-death and votes for Labour to test these effects. In difference-in-differences and regression dis-
continuity frameworks we find several key pieces of evidence. First, and contrary to the conventional
wisdom, we present novel evidence that bombing significantly reduced wealth inequality in the north of
England, but not the south. We argued that this was due to the different focus of the bombing. Thus
the direct channel operated at least in part of England. Second, we found support for the indirect effect.
Places that were bombed more heavily changed their votes in favor of Labour in 1945 and Labour delivered,
implementing sweeping social change. After 1945, voters in the south went back to voting Conservative,
but voters in the north kept voting for Labour. This is likely due to the fact that the reforms implemented
by Labour, particularly the creation of the NHS, were deemed permanent, and the heterogeneous impact
of bombing in the north and south. In the north, bombing was aimed at targeting productive capacity
and resulted in a permanent fall in the average level of wealth giving persistent reasons to move towards
the Labour party. This fall did not occur in the south so that once the NHS was institutionalized, voters
permanently got the part of the social contract they most valued and were able to cast their votes according
to other issues.
We did not provide evidence that these policy changes reduced inequality because most were national
in scope and do not vary at the local level we exploit in the analysis. However, it seems highly plausible
that the new redistributive policies did indeed contribute to falling inequality.
We interpret these effects as consistent with Titmuss (1950)’s emphasis on the changes in the social
contract that occurred as a consequence of WWII.
17Figure 1: Map of bombing intensity in World War II
Notes: Bombing Intensity (Binary) is the median split of bombing intensity, which is defined as the
number of raids
square km between 1940 and 1945, with 1 being above median and 0 being below median. The unit of
observation in the Parliamentary constituency.
18Figure 2: Example of probate records
Notes: This is an image of part of the probate records for 1941. Each record notes the name of the deceased
individual, their address at time of death, as well as their wealth.
19Figure 3: Time series of wealth inequality by bombing intensity
Notes: This figure plots the average wealth Gini coefficient across registration districts by year. We compute
two time series, split by Bombing Intensity. Vertical lines indicate the the start and end of WWII.
20Figure 4: Wealth inequality coefficient plot
Notes: All regressions are estimated using OLS. The unit of observation is a registration district by year.
Gini index is the wealth Gini coefficient for individuals in a registration district who passed away in
a particular year and who were probated. Bombing Intensity (Binary) is the median split of bombing
intensity, which is defined as the number of raids
square km between 1940 and 1945, with 1 being above median and
0 being below median. Each regression includes a full set of time and unit fixed effects. We express all
estimated effects relative to 1938. Standard errors are clustered at the unit level. Vertical lines indicate
the the start and end of WWII. The p-value for a joint F-test that the treatment effect coefficients for
years 1930 − 1938 are jointly 0 is 0.12. The p-value for a joint F-test that the treatment effect coefficients
for years 1939 − 1954 are jointly 0 is 0.006401.
21Figure 5: Wealth inequality heterogeneous effects
Notes: All regressions are estimated using OLS. The unit of observation is a registration district by year.
Gini index is the wealth Gini coefficient for individuals in a registration district who passed away in
a particular year and who were probated. Bombing Intensity (Binary) is the median split of bombing
intensity, which is defined as the number of raids
square km between 1940 and 1945, with 1 being above median and 0
being below median. Each regression includes a full set of time and unit fixed effects. North is defined as
units of observation that are above the median latitude of all units. South is defined analogously. Omitted
year is 1937 instead of the standard 1938 because 1938 in the North is an outlier. Standard errors are
clustered at the unit level. Vertical lines indicate the the start and end of WWII.
22Figure 6: Time series of votes for Labour by bombing intensity
Notes: This figure plots the average vote share for the Labour party across constituencies by year. We
compute two time series, split by Bombing Intensity. A vertical line indicates the start of WWII.
23Figure 7: Votes for Labour coefficient plot
Notes: The unit of observation is a constituency by year. Labour Vote Share is the share of votes for
the Labour party in a constituency. Bombing Intensity (Binary) is the median split of bombing intensity,
which is defined as the number of raids
square km between 1940 and 1945, with 1 being above median and 0 being
below median. Each regression includes a full set of time and unit fixed effects. We express all estimated
effects relative to 1935. Standard errors are clustered at the unit level. A vertical line indicates the start
of WWII. The p-value for a joint F-test that the treatment effect coefficients for years 1918 − 1935 are zero
is 0.45. The P-value for a joint F-test that the treatment effect coefficients for years 1945 − 1970 are zero
is 2.792e−7 .
24Figure 8: Votes for Labour heterogeneous effects
Notes: The unit of observation is a constituency by year. Labour Vote Share is the share of votes for
the Labour party in a constituency. Bombing Intensity (Binary) is the median split of bombing intensity,
which is defined as the number of raids
square km between 1940 and 1945, with 1 being above median and 0 being below
median. Each regression includes a full set of time and unit fixed effects. North is defined as units of
observation that are above the median latitude of all units. South is defined analogously. We express all
estimated effects relative to 1935. Standard errors are clustered at the unit level. A vertical line indicates
the start of WWII.
25You can also read