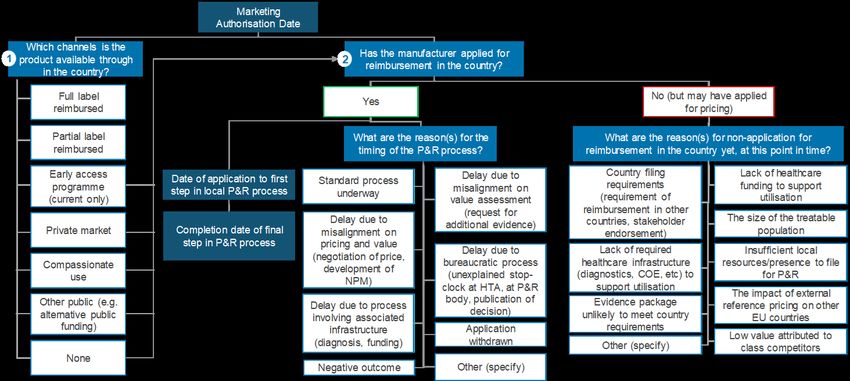
The root cause of unavailability and delay to innovative medicines: Reducing the time before patients have access to innovative medicines
←
→
Page content transcription
If your browser does not render page correctly, please read the page content below
The root cause of unavailability and delay to innovative medicines

April 2022

        The root cause of unavailability and delay to innovative
          medicines: Reducing the time before patients have
                   access to innovative medicines
        Executive Summary1

        The unprecedented speed of innovation exhibited over the last five years and the promise
        of the industry pipeline2 provides an important opportunity to improve outcomes for
        patients. There is common agreement that the value of innovation is only realised when
        patients benefit from advances in treatment. However, a significant number of medicines
        are not available across all European Union (EU) markets.3
        EFPIA for many years has looked at the length of time it takes for medicines to be made
        available. As illustrated by the most recent data in the Patient W.A.I.T. Indicator Survey in
        2021, the average time to reimbursement for innovative treatments across EU and
        European Economic Area (EEA) countries continues to be as long as 511 days, ranging
        from 133 days in Germany to over 899 days in Romania. There are patient access
        inequities within Europe, with significant differences across countries in the number of
        products that are available at a point in time and that the time taken prior to national
        reimbursement also varies significantly from one country to another. The industry shares
        concerns about these delays and recognises that delays and the unavailability of medicines
        harm patients. Moreover, there is need to address delays as European economies and
        healthcare systems recover from COVID-19.
        Over the past two years, EFPIA has documented the root cause of access inequality and
        found there are 10 interrelated factors that explain unavailability and delay (defined as
        length of time from European marketing authorisation to availability at Member State level)
        to innovative medicines, building on the WAIT analysis.4 These are rooted in the medicines
        access systems and processes in the EU member states and the corresponding impact on
        commercial decision-making. They range from a slow regulatory process to late initiation
        of market access assessment, to duplicative evidence requirements, to reimbursement
        delays, and local formulary decisions. As the root causes are multifactorial, they can only
        be solved by different stakeholders working together.

1       Terminology: This paper has adopted the terminology used in the updated W.A.I.T. analysis. Definitions are in the
        glossary.
2       See EFPIA Pipeline Review 2021 Update, IQVIA project report, February 2021. Accessible at:
        https://www.efpia.eu/media/602564/iqvia_efpia_pipeline-review_final.pdf
3       This paper focuses primarily on root cause of delay for centrally approved products by the EMA. It should be noted
        that there are non-centrally approved medicines for which many of these root causes would also apply.
4       https://www.efpia.eu/publications/downloads/efpia/the-root-causes-of-unavailability-and-delay-to-innovative-
        medicines/

                                                                                                                 Page 1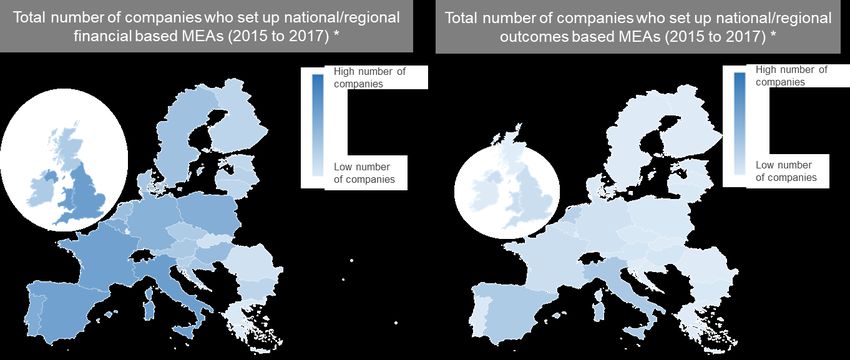
The root cause of unavailability and delay to innovative medicines

April 2022

        Figure 1: The root causes of delays and unavailability

        The industry considers that the root causes of unavailability and delay could be addressed
        through collaborative work with Member States, European Commission and other
        stakeholders on proposals to improve availability and reduce delays. These must start from
        the beginning of the process, including proposals to speed up the regulatory process,
        delivering safe and high-quality diagnostics, vaccines and treatments to patients as fast as
        possible. The industry welcomes the commitment to address regulatory barriers. However,
        these will not improve patient access to innovative medicines by themself. EFPIA and its
        members have worked on a series of concrete access proposals to improve patient access
        to innovative medicines and reduce inequalities across Europe. These include inter alia:

             •   A commitment from the industry to file pricing and reimbursement
                 applications in all EU countries no later than 2 years after EU market
                 authorisation. This commitment reflects the joint ambition of industry and society
                 to make innovation for unmet health needs available for patients and health
                 systems across Europe as soon as possible.

             •   The creation of a portal where marketing authorisation holders (MAH) can
                 provide timely information regarding the timing and processing of pricing
                 and reimbursement (P&R) applications in the various EU-27 countries,
                 including the reasons why there is a delay in the P&R decision or why the MAH
                 has not filed in a particular market.

             •   A conceptual framework for Equity-Based Tiered Pricing (EBTP), to ensure
                 that ability to pay across countries is considered in the prices of innovative
                 medicines, anchored in a principle of solidarity between countries, to reduce
                 unavailability of new medicines and access delays.

             •   Novel payment and pricing models, when used appropriately and tailored to the
                 situation, can accelerate patient access, allowing payers to manage clinical

                                                                                             Page 2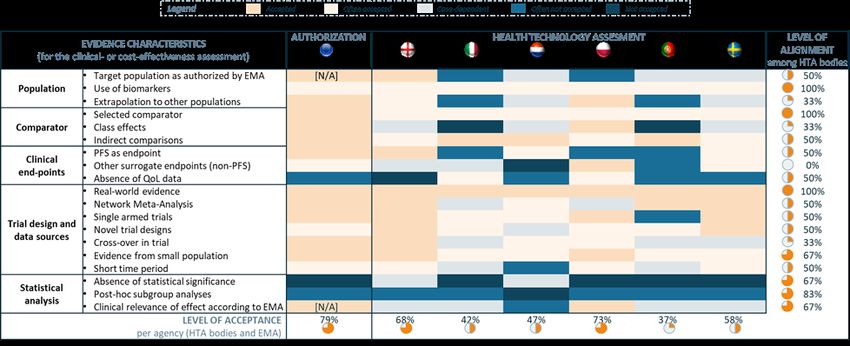
The root cause of unavailability and delay to innovative medicines

April 2022

                  uncertainty, budget impact and sustainability of the healthcare system, whilst
                  providing sufficient incentives for innovation.5,6

             •    Contributing to achieving an efficient system of European assessments of
                  relative efficacy at time of launch in the context of the implementation of the HTA
                  Regulation.
        The present report is the third edition of the root cause analysys first released in June 2020,
        which was used a basis for discussion with several EU and national policy-makers and
        stakeholders. The present report takes stock of these discussions, updates the data and
        evidence and further articulates how policy proposals can address some identified hurdles
        in a collaborative and sustainable way.

        1.1.      Background and approach
        The unprecedented speed of innovation exhibited over the last five years and the promise
        of the industry pipeline provides an important opportunity to improve outcomes for patients.
        Innovative medicines have already significantly increased survival, delivering treatments to
        patients with chronic diseases and those with previously untreatable cancers, treating
        genetic conditions for which there were no existing medicines and eliminating some
        infectious diseases.
        There is common agreement that the value of innovation is only realised when patients
        benefit from advances in treatment. Everyone involved in healthcare – from patients to
        service providers, researchers to clinicians, pharmaceutical companies to payers – wants
        to see patients across Europe get access to new treatment options.7
        The importance of the addressing unavailability and delays was highlighted in EU
        Pharmaceutical Strategy (see Box 1).

5       https://efpia.eu/media/554543/novel-pricing-and-payment-models-new-solutions-to-improve-patient-access-
        300630.pdf
6       https://www.efpia.eu/media/602581/principles-on-the-transparency-of-evidencefrom-novel-pricing-and-payment-
        models.pdf
7       https://www.efpia.eu/news-events/the-efpia-view/blog-articles/how-long-should-you-wait-for-a-new-medicine-
        europe-s-post-code-lottery/

                                                                                                             Page 3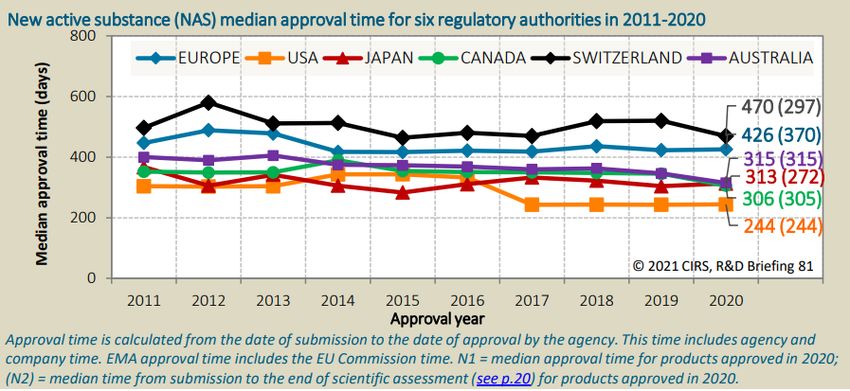
The root cause of unavailability and delay to innovative medicines

April 2022

        Box 1: Discussion of root causes in the EU Pharmaceutical Strategy

         “Innovative and promising therapies do not always reach the patient, so patients in the
         EU still have different levels of access to medicines. Companies are not obliged to market
         a medicine in all EU countries; they may decide not to market their medicines in, or
         withdraw them from, one or more countries. This can be due to various factors, such as
         national pricing and reimbursement policies, size of the population, the organisation of
         health systems and national administrative procedures resulting in smaller and less
         wealthy markets in particular facing these problems.”

        Source: European Commission, EU Pharmaceutical Strategy8
        The European Commission is currently preparing a revision of the EU Pharmaceutical
        Legislation and has put forward a range of proposals to address patient access inequalities
        across EU member states. This includes stepping up co-operation with and among Member
        States on the affordability of medicines. We understand that some of the proposals being
        discussed could introduce obligations for Marketing Authorisation Holders (MAHs) to
        market or supply all EU Member States. The industry has concerns regarding the use of
        regulatory tools designed for medicines authorisation being applied to address availability
        issues that are within the remit of Member States. In most countries, the inclusion of the
        product on the reimbursement list will determine availability and access. Any requirement
        for MAHs to place a centrally authorised medicine on the market in the majority of Member
        States (including small markets) within a certain period from authorisation, or any provision
        allowing early entry of generics in the EU market if a centrally authorised medicine is not
        launched in all Member States within a given number of years of granting the marketing
        authorisation, could have the opposite effect on developing and commercialising innovation
        on several Member States’ publicly funded markets, significantly reducing patient access
        to innovation.
        The industry shares the concern about these delays, recognises that delays and the
        unavailability of medicines harm patients, and agrees that there is a need to act urgently to
        address these longstanding issues. The purpose of this paper is to explain the different
        factors that could explain unavailability and delay for patients across the EU and the degree
        to which these are supported by the available data. On the basis of a common
        understanding, and focusing on the needs of patients, collaborative solutions can be found
        that address the issues raised in the report.

        1.2.     What do we mean by availability and delay?
        In the European Union, once a new treatment has gone through a process of ten years of
        research and development on average, three further milestones have to be reached before
        patients have access to it (see Figure 1):

             •   A European marketing authorisation needs to be granted, confirming the quality,
                 safety and efficacy of the therapy.

8       Communication from the Commission to the European Parliament, the Council, the European Economic and
        Social Committee and The Committee of the Regions, Pharmaceutical Strategy for Europe COM/2020/761 final

                                                                                                         Page 4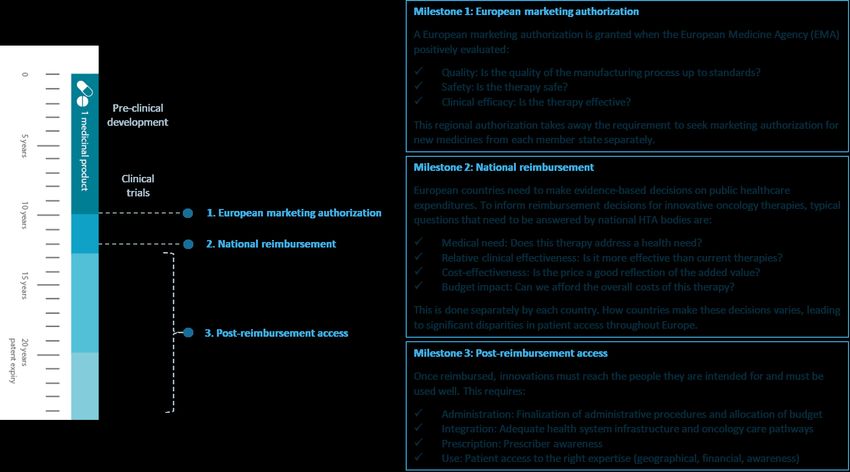
The root cause of unavailability and delay to innovative medicines

April 2022

                      •       Authorities within countries have to secure national (and regional) reimbursement
                              of the therapy under an insurance or reimbursement scheme, in order to secure
                              the adequate provision of medicines to all patients. In some cases, products may
                              be available without reimbursement on the private market, but this does not ensure
                              wide access to the patient population.

                      •       Once reimbursed, innovations need to reach the people they are intended for and
                              should be used in accordance with their labels, the latest scientific insights and
                              relevant treatment guidelines (post-reimbursement access).
        This paper focuses on availability and delays – so we focus on the first two milestones.

        Figure 1: After ten years of research and development, three milestones must be
        reached to bring innovative therapies to patients (EFPIA, 2020)

        Source: EFPIA 2020

        It is important to distinguish between a number of different time points:

                      •       The length of time between application for and the granting of marketing
                              authorisation

                      •       The length of time from market authorisation to application for pricing and
                              reimbursement

                      •       The length of time from application for P&R to decision on value assessment

                      •       The length of time from decision on value assessment to reimbursement decision
        Figure 2: Different types of delay
                                                                                                                                        First Reimbursed Use after
                          Patent filing    Phase III results Marketing authorization   HTA submission       HTA recommendation          national/regional decision

                                   Development          Regulatory           HTA process             P&R evaluation                Negotiation      Access
        Measures of

                                                                                                                                                      Diffusion and
          interest

                                                                                                                                                        additional
                                                                                                                                                       indications

                                    Out of scope      Regulatory issues                    Commonly defined market access delays                    Secondary issue

        Source: EFPIA 2020

                                                                                                                                                          Page 5
The root cause of unavailability and delay to innovative medicines

April 2022

        1.3.      What is the evidence on unavailability and delays?
        EFPIA for many years has looked at the length of time it takes for medicines to be
        reimbursed. As illustrated by the most recent data in the Patient W.A.I.T. indicator survey
        in 2020 (in Figure 3 below), the average time to reimbursement for innovative treatments
        across EU and European Economic Area (EEA) countries continues to be as long as 511
        days, ranging from 133 days in Germany to over 899 days in Romania.

        Figure 3: Median time to availability in days (2017–2020) 9

        Source: The Patients W.A.I.T. Indicator 2021

        Patients in different countries can wait more than seven times longer than patients in other
        countries to get access to the same medicine.10 There are some common patterns:
        typically, patients in Northern and Western Europe get access to new treatments between
        100 and 200 days after market authorisation has been granted, whereas patients mainly in
        Southern and Eastern Europe wait between 600 and 1000 days. This means that at any
        point in time, availability of medicines varies dramatically across Europe.

9       European Union average: 511 days (mean %) In most countries availability equates to granting of access to the
        reimbursement list, except in DK, FI, NO, SE some hospital products are not covered by the general
        reimbursement scheme. *Countries with asterisks did not complete a full dataset and therefore availability may
        be unrepresentative **In France, some innovative products without competitors can be made available prior to
        market authorisation under the system of Temporary Authorisations. As these are not taken into account in the
        analysis, the average for France would be lower. ***In the UK, MHRA’s Early Access to Medicines Scheme
        provides access prior to marketing authorisation but is not included within this analysis, and would reduce the
        overall days for a small subset of medicines.
10      https://www.efpia.eu/news-events/the-efpia-view/blog-articles/how-long-should-you-wait-for-a-new-medicine-
        europe-s-post-code-lottery/

                                                                                                              Page 6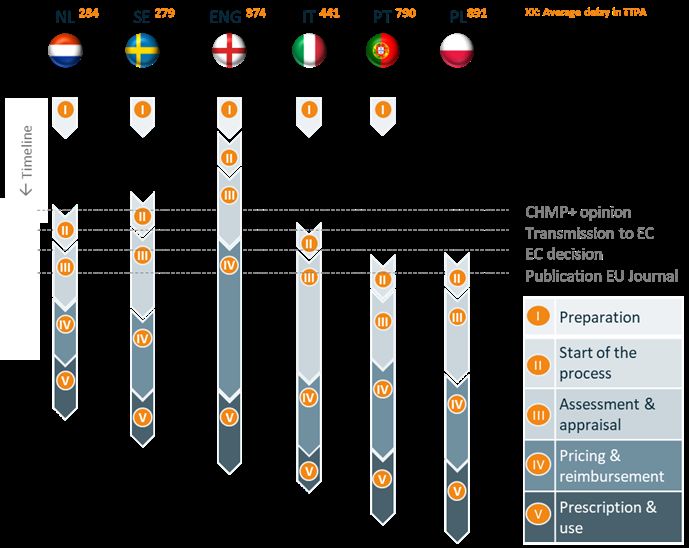
The root cause of unavailability and delay to innovative medicines

April 2022

        Figure 4: Comparing access across European countries

        Source: The Patients W.A.I.T. Indicator 2021

        There is also evidence that shows systematic differences between different types of
        medicines that has been examined in the updated W.A.I.T. analysis. Although access to
        oncology medicines appears to be improving, access to orphan medicines continues to
        vary considerably across EU member states, with long delays and low availability in Central
        and Eastern Europe.
        Figure 5: Difference in the median time to availability for all medicines vs orphan
        medicines (2017 – 2020) – positive means orphan are slower than all medicines by
        number of days

                                                                                            Page 7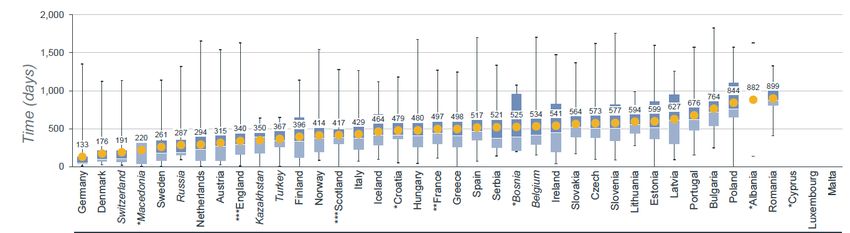
The root cause of unavailability and delay to innovative medicines

April 2022

         600

         500

         400

         300

         200

         100

             0
                      Estonia

                       France
                        Spain

                       Poland

                 Netherlands

                         Italy

                      Greece
                      Iceland
                   Lithuania
                      Ireland

                     Sweden
                      Croatia

                     Belgium

                   Denmark

                     Bulgaria

                    Romania
                     Norway

                     Slovakia
                    Scotland

                      Austria
                    Hungary
                        Latvia

                 Switzerland

                    Slovenia

                    Portugal
                        Czech

                   Germany

                      Finland
                     England
         -100

        Source: The Patients W.A.I.T. Indicator 2021

        Even within one country, patients can get access to some medicines almost immediately
        and wait years for others. For example, in Finland the shortest delay was 0 days and the
        longest 1676 days, in France the variance was 112 days to 1772 days, and in Spain 41
        days to 1676 days.
        It is important to consider whether delays are getting longer or shorter over time. If we look
        across all innovative medicines, there is little evidence that delays are reducing – in fact
        the contrary.11 This is likely to become an even bigger concern as we consider the
        consequences of COVID-19.

11      This will vary by therapeutic area. According to academic analysis, median times from marketing authorisation to
        first use of cancer medicines were shorter for medicines launched between 2010 and 2014 versus sample-wide
        (2000–2014). Time to Entry for New Cancer Medicines: From European Union–Wide Marketing Authorization to
        Patient Access in Belgium, Estonia, Scotland, and Sweden. Ferrario, A. Health Policy Analysis. Value in Health
        21(7): 809–821, 01 July 2018

                                                                                                               Page 8
The root cause of unavailability and delay to innovative medicines

April 2022

        Figure 6: Comparison of delay over time (median delays in days)
         900

         800

         700

         600

         500

         400

         300

         200

         100

             0
                     Germany        Austria       Finland         Spain             Italy          Hungary       Ireland        France        Poland

                     2017 study (2014-2016)   2018 study (2015-2017)      2019 study (2016-2018)     2020 study (2016-2019)   2021 study (2017-2020)

        Source: The Patients W.A.I.T. Indicator 2021

        The analysis set out is broadly consistent with the recent Organisation for Economic Co-
        operation and Development (OECD) analysis of the availability of oncology medicines. This
        found significant differences in availability, with the largest percentage of
        product/indications approved in Denmark and Germany (91% and 88% respectively). Malta
        had the lowest percentage of pairs approved and covered 46%.

        1.4.           What are the factors that could explain unavailability and
                       delay?
        The cause of delays and unavailability has been the subject of debate for many years.
        Policymakers and non-governmental organisations (NGOs) have often pointed out that
        industry uses approaches such as launch sequencing to determine the speed at which
        products get to market and it appears to be a commercial decision. The industry has often
        argued that the long, complex practice of applying for reimbursement often delays access
        to medicines. In reality, there are many interconnected factors that could explain
        unavailability and it is not possible to untangle their impacts with perfect precision. For
        example:

                 •     In some markets, even if a product is reimbursed and available it is not in practice
                       used on the market (see Section 1.6). Given this, it is unsurprising that other
                       manufacturers might choose to avoid the cost of applying for reimbursement.

                                                                                                                                                 Page 9
The root cause of unavailability and delay to innovative medicines
April 2022
• In other markets, it is a requirement that a product is already reimbursed in a series
of other comparable countries.12 Again, it should be no surprise that application for
reimbursement is delayed until access on these markets is achieved.
In other words, the environment affects commercial decisions. This paper seeks to untease
these factors. EFPIA has identified 10 factors from 5 different perspectives: the time prior
to market authorisation; the pricing and reimbursement process; value assessment criteria;
health system readiness; and delay from national to regional approval.
Figure 7: The root causes of unavailability and delay
Category Potential root causes
The time prior to 1. The speed of the regulatory process
market authorisation 2. Accessibility of medicines prior to marketing authorisation
The price and 3. Initiation of the process
reimbursement 4. The speed of the national timelines and adherence
process
The value 5. Misalignment on evidence requirement
assessment process 6. Misalignment on value and price
7. The value assigned to product differentiation and choice
Health system 8. Insufficient budget to implement decisions
readiness 9. Diagnosis, supporting infrastructure and relevance to patients
Delay from national 10. Multiple layers of decision-making processes
to regional approval
Source: EFPIA
We now turn to the evidence on what causes unavailability but agree with the caution set
out in the OECD analysis, that we should jointly work to improve availability but should not
expect availability to be 100%: “Broad access to all […] medicines is often assumed to be
ideal, but is not essential. For example, if several medicines are potentially available for a
given indication, procurement methods may result in only some of them being available,
without disadvantaging patients.”13
1.5. Root causes of unavailability and delay
1.5.1. The time prior to marketing authorisation
The first set of root causes to investigate relate to delay prior to marketing authorisation.
The granting of a centralised marketing authorisation by the European Medicines Agency
(EMA) covering all EU countries takes away the requirement to seek marketing
authorisation for new therapies from each member state separately; however, the
centralised process that is used for most innovative medicines still takes time.
The speed of regulatory process
12 Greece: article 22 of Law 4633/2019: medicines with patent protection are subject to health technology
assessment (HTA) in Greece only if they are reimbursed in 5 other countries with HTA process from the following
list: Austria, Belgium, France, Germany, Denmark, Spain, Netherlands, Italy, Portugal, Sweden and Finland.
13 Addressing Challenges in Access to Oncology Medicines, Analytical Report. OECD, April 2020.
Page 10The root cause of unavailability and delay to innovative medicines
April 2022
Although this is not captured in EFPIA’s W.A.I.T. indicator, the time from application to
granting of marketing authorisation has been examined in many different papers. Looking
at recent evidence on new active substances it is clear that the European regulatory
process is slower than some international processes, particularly that of the US (Figure 3
below).14
Figure 8: Comparison of length of time of market authorisation process
Source: https://cirsci.org/wp-content/uploads/dlm_uploads/2021/06/CIRS-RD-Briefing-81-6-agencies-v5.pdf
Many recent studies have focused on cancer medicines:
• For 29 cancer drugs approved by the EMA between 2006 and 2011, one study
looked at approval times in three major jurisdictions. Median approval time was
shorter in the United States (US) (6.0 months) than in Japan and Europe (15.0 and
13.3 months, respectively).15
• Another study, focusing on 16 tyrosine kinase inhibitors (TKIs) approved by the US
Food and Drug Administration (FDA) as of 30 September 2012, found the average
time spent on review and approval between the US (205.3 days) and the EU (409.6
days).16 The active review time was similar in both jurisdictions, 205.3 days in the
US and 225.4 days in the EU, with the differences attributed to longer clock stops
during the review process to collect additional information from sponsors, and the
14 This does vary by pathways. As reported in Rodier et al. (2019), The overall median approval time taken by the
EMA for all the approved new active substances was about 423 days in 2019 compared to the official timelines of
210 days, with an average of 270 days for accelerated assessments, 481 days for conditional approvals and 281
days for high priority medicines. Rodier, Céline, Magdalena Bujar, Neil McAuslane, and Lawrence Liberti. 2019.
New Drug Approvals in Six Major Authorities 2009-2018: Focus on Facilitated Regulatory Pathways and Orphan
Status. London, UK.
15 Hartmann, M., Mayer-Nicolai, C. and Pfaff, O. Approval probabilities and regulatory review patterns for anticancer
drugs in the European Union. Critical Reviews in Oncology/Hematology 87(2): 112–121
16 A fresh perspective on comparing the FDA and the CHMP/EMA: approval of antineoplastic tyrosine kinase
inhibitors. Shah et al. British Journal of Clinical Pharmacology 76(3): 396–411
Page 11The root cause of unavailability and delay to innovative medicines
April 2022
time from recommendation by the advisory opinion, and the decision of the
European Commission.
• For 37 cancer medicines approved between 2005 and 2013 by Health Canada, the
time from date of submission to approval was much longer for the EMA and Health
Canada than for the FDA, by an average of 6.7 months and 6.4 months,
respectively.17 Submissions to the FDA were also made on average 12.9 and 28.4
months earlier than submissions to Health Canada and to the EMA, respectively.
• A recent study reported median approval times for oncology drugs and
immunomodulators between 2015 to 2019 were the longest for Swissmedic (450
days) followed by the EMA (419 days), the Australian Therapeutic Goods
Administration (TGA) (352 days), Health Canada (345 days), the Japanese
Pharmaceuticals and Medical Devices Agency (JPMDA) (284 days) and the FDA
(239 days).18
• The study results show that in the time period between 2011 and 2015 the FDA
approved 170 new drugs while the EMA approved only 144. Furthermore, the FDA
had a median review time of 306 days, while at the EMA there was a median review
time of 383 days. Encouragingly for rare disease patients in the US, there were
considerably more orphan drug approvals at the FDA than there were at the EMA.
43.5% of the approved agents in the US were orphan drugs, while in Europe only
25% were orphan drugs.19
• The OECD recently repeated this analysis for oncology reports, finding that the
average delay was 13 months for the EEA, 7 months for the US.20
For other categories of medicine, the difference may be smaller but the FDA is still faster
than the EMA.21
For Europe this includes a period between the CHMP opinion and the EC decision.
Figure 9: Overview of timelines between CHMP opinion and EC decision, for all
oncology therapies evaluated by the CHMP between 2016 and 2020 (new molecular
entities only).
17 Cross-comparison of cancer drug approvals at three international regulatory agencies. Samuel, N. and Verma, S.
Current Oncology 23(5): 454–460
18 The Centre for Innovation in Regulatory Science (CIRS), 2020
19 Regulatory Review of New Therapeutic Agents — FDA versus EMA, 2011–2015
https://www.nejm.org/doi/full/10.1056/NEJMc1700103#t=article
20 Addressing Challenges in Access to Oncology Medicines, Analytical Report. OECD, April 2020.
21 For example, “EMA and FDA comparison shows faster, and higher, approval rates in the US”
https://www.shakespearepharma.com/ema-and-fda-comparison-shows-faster-and-higher-approval-rates-in-the-
us/ and Minette-Joëlle Zeukeng, Enrique Seoane-Vazquez and Pascal Bonnabry. A comparison of new drugs
approved by the FDA, the EMA, and Swissmedic: an assessment of the international harmonization of drugs.
European Journal of Clinical Pharmacology, 10.1007/s00228-018-2431-7, 74, 6, (811-818), (2018).
Page 12The root cause of unavailability and delay to innovative medicines
April 2022
Source: Every Day Counts, Improving regulatory timelines to optimise patient access to innovative oncology
therapies in Europe, Vintura, November 2021
Some argue that this reflects that Europe is losing ground in terms of priority of regulatory
approval and this will only get worse in the future.22 However, even today there is often a
significant delay caused by the marketing authorisation process.
Accessibility of medicines prior to marketing authorisation
In reality, it is possible for patients to access medicines prior to marketing authorisation in
23 24
some countries. , Funded early access schemes represent temporary reimbursement
pathways that ensure direct patient access to new promising treatments prior to regulatory
approval, where there is a clear unmet need.25
Some countries have introduced early access schemes specifically aimed at providing
immediate patient access for products prior to a full marketing authorisation (MA) being
granted. Some countries, such as France and England, have introduced a more systematic
approach. For example in France, products with high unmet need can be granted an
“authorisation temporaire d’utilisation” (ATU)26 prior to receiving a conditional MA approval.
More recently, somewhat comparable schemes have developed in other markets. For
example, England’s “early access to medicines scheme” (EAMS). Unlike the French ATU
scheme, the company that applies for EAMS must provide the medicine free of charge to
22 For example, global regulatory timelines are changing over time – over the last 10 years. EMA’s have stayed
relatively flat (increased a little during the last year) while Japan PMDA, US FDA and China NMPA have
dramatically reduced their review timelines over the decade.
23 It is also possible that where a new indication for an existing product is not (yet) approved or covered, access this
may be possible through off-label prescribing.
24 Formally, Hungary, Latvia, Austria, Germany, Denmark, Finland, the Netherlands and Sweden do not require price
obtainment from the competent authority before “market launch”, according to EFPIA’s Market Launch and
Withdrawal Survey (May 2020). This is not the case in other countries. Indeed, there is a requirement to apply for
reimbursement status before market launch is in effect in Italy, Czechia, Spain, Slovenia, and Portugal.
25 In addition, most countries have named patient compassionate use programs which might be offered to patients
with life-threatening or seriously debilitating conditions or an area of unmet clinical need. These have recently
been documented in Access to medicines in Europe: Delays and challenges for timely patient access, Bregtje
Kamphuis, Anna-Maria Fontrier, Olina Efthymiadou, Jennifer Gill, Hana Salyga and Panos Kanavos | November
2021
26 The “cohort ATU” is requested directly by the manufacturer for the use of a single indication in a group of patients,
and is currently the preferred option.
Page 13The root cause of unavailability and delay to innovative medicines
April 2022
the National Health Service (NHS) until the full marketing authorisation is granted. Those
patients who receive a free medicine during this EAMS period will continue to do so up to
the point of a positive funding policy (e.g. Health Technology Assessment (HTA) guidance,
national funding policy, local funding arrangements).27
Early access schemes are not taken into account in the time to availability in W.A.I.T., but
the impact of taking into account early access schemes is clear. The time to availability in
France is 497 days when one includes products under the ATU system, for which the price
negotiation process is usually longer. If one considers that products under the ATU system
are directly available (time to availability = 0), the average time to availability is 240 days.
1.5.2. Delay between marketing authorisation and application for
reimbursement
Once a medicine has a marketing authorisation, there can still be a delay before the start
of the reimbursement process. This can be because some countries want to wait for the
formal EMA decision and/or reimbursement decisions in other countries before they start
their own reimbursement processes. Even after this, the length of the P&R process varies
from country to country. Although the EU Transparency Directive (Directive 89/105/EEC)
has set 180 days as the maximum timeline for member states to make P&R decisions, in
practice this may be much longer due to clock stops or a lack of adherence.
Initiation of the process
In some markets, there is immediate access after marketing authorisation, at least for some
products. For example, in Germany the standard process provides manufacturers with a
temporary period of free pricing that enables access to a medicine that has been authorised
by the EMA, almost from day one, avoiding the delay resulting from an ongoing HTA
assessment and pricing negotiations.
However, in many markets the P&R process does not start automatically; this requires a
submission by the company or decision by those in the assessment process. This depends
on the rules: the process in some countries is possible prior to marketing authorisation, but
in others this requires a positive opinion from the EMA Committee for Medicinal Products
for Human Use (CHMP), or even a formal decision from the EC or a publication in the
Official Journal of the EU before a dossier can be submitted or is assessed. In some cases,
countries even await decisions from other countries, whilst in others the national processes
can only start when a cohort of other countries have finalised their decisions at national
level.28 This is illustrated in the Figure below – here we look at availability of product
approved over two time windows - a four and six year window. As expected this shows that
higher level of availability over a longer window with the biggest difference observed for
countries that require the product to be launched in a basket of countries.
27 Office for Life Sciences. Gov.uk (2016). Guidance on Early access to medicines scheme (EAMS): task group and
principles. 10 May 2016. https://www.gov.uk/government/publications/early-access-to-medicines-scheme-eams-
how-the-scheme-works/early-access-to-medicines-scheme-eams-task-group-and-principles.
28 For example, in Czechia, as maximal pricing and reimbursement levels are based on referencing to other EU
countries, the availability on at least three EU member states’ markets is necessary for P&R application. EFPIA
Market Launch and Withdrawal Survey. In Bulgaria, manufacturers can submit their dossier to undergo HTA only
when a positive recommendation has been issued by the UK, France, Germany or Sweden (Malinowski et al.
2020).
Page 14The root cause of unavailability and delay to innovative medicines
April 2022
Figure 10: A comparison of availability over a four and six year window
100
0%
-1%
90 -5%
-8%
-2%
Availability of products (%) 80 -3%
-11%
-8%
70 -3% -9%
-10%
-10% -13% -14%
-9% -11%
60 -6% -10%
-27%
50 -17%
-13% -35%
-10%
40 -24% -26%
-15%
-28%
30 -29% -29% -29%
-28%
20 -9%
-48%
-45%
10
0
Hungary
Denmark
Slovenia
Portugal
Slovakia
Lithuania
Austria
Italy
Czech
Turkey
France
Spain
Macedonia
Norway
Ireland
Romania
Bulgaria
England
Poland
*Croatia
Germany
Switzerland
Estonia
Latvia
Russia
Bosnia
Sweden
Greece
Scotland
*Serbia
Finland
Iceland
Belgium
Netherlands
Extended 6-year cohort (2014 - 2019) Standard 4-year cohort (2016-2019)
Source: IQVIA - †In most countries availability equates to granting of access to the reimbursement list, except in
DK, FI, NO, SE some hospital products are not covered by the general reimbursement scheme. *Countries with
asterisks did not complete a full dataset and therefore availability may be unrepresentative.
In other cases the process is dependent on other stakeholders. For example, in Estonia,
applications to the inpatient service list are made by clinicians; therefore, manufacturers
are in principle not able to influence this process.29 The different times to submission are
illustrated in the figure below.
Figure 11: Time until initiation of the reimbursement process
Submission preparation
Submission
Relative Effectiveness &
Economic Appraisal
Relative Effectiveness
process
EC decision
EMA
appraisal
CHMP opinion EPAR publication Final HTA evaluation and/or
decision
Represents ideal timeline but some products
Sub prep S RE & EA F have a different, compatible timeline
In some cases, HTA could be
Sub prep S RE & EA F completed before the EPAR
Sub prep S RE & EA F publication, the but most products have
a different, compatible timeline
Sub prep S RE & EA F
National HTA processes
Sub prep S RE & EA F Submission for orphan medicines and
medicines of exceptional therapeutic
relevance can happen at CHMP opinion
Sub prep S RE & EA F
Sub prep S RE & EA F
Sub prep S RE F
Sub prep S RE & EA F
Sub prep S RE F
Sub prep S RE & EA F
Source: EFPIA; EPAR refers to European public assessment report
29 Time to Entry for New Cancer Medicines: From European Union–Wide Marketing Authorization to Patient Access
in Belgium, Estonia, Scotland, and Sweden. Ferrario, A. Health Policy Analysis. Value in Health 21(7): 809–821,
01 July 2018
Page 15The root cause of unavailability and delay to innovative medicines
April 2022
This shows that in some countries the process can start significantly before the marketing
authorisation (England), whilst in others there is a delay even after publication in the EU
Journal. Leaving to one side the impact of national rules, two other factors need to be taken
into account.
A significant amount of research has been undertaken to understand the degree to which
delayed application is caused by external reference pricing. The intuition for this is clear: if
a country references the price of medicines in much lower income countries, able to pay a
much lower price, companies will be encouraged to launch medicines in the high price
country first. This will avoid lower prices cascading from one country to another. A series
of reports for the Commission have documented this effect.30
Equally, the application for P&R is a time-consuming process. Every country requires the
development of a tailor-made dossier in local language and compliance with local rules.
Although companies often have specialised groups to manage this process, it is still
necessary to prioritise internal activities. This issue is exacerbated for smaller companies
that have not gone through the process before and companies that have not launched a
new medicine for some time (as shown in the Figure below where larger companies have
higher levels of availability). As with any commercial decision, and applicable to many
sectors of industrial production, we would expect companies to take into account the
commercial size of the opportunity to determine where to put their resources. This is not
just about industry resources; HTA bodies do not have limitless capacity.31 For that reason,
companies are often inclined to not start an application until authorisation to enter the
European market has been confirmed.
Figure 12: Percentage of products available in EU countries, segmented by company
size
30 Kanavos, P., Fontrier, A., Gill, J., & Efthymiadou, O. (2020) Does external reference pricing deliver what it
promises? Evidence on its impact at national level. Eur J Health Econ (21): 129–151. Retrieved January 29, 2020,
from https://link.springer.com/article/10.1007/s10198-019-01116-4
31 O'Rourke, B. et al. (2019) The 'Top 10' Challenges for Health Technology Assessment: INAHTA Viewpoint. Int J
Technol Assess Health Care 2020 36(1): 1–4. doi: 10.1017/S0266462319000825. Epub 2019 Nov 28
Page 16The root cause of unavailability and delay to innovative medicines
April 2022
Top-20 global Other biotech and Large company
Country pharma SME companies delta
% abov e or below the country
N=76 N=85
av erage reported in W.A.I.T.
Germany 97% 85% 7%
Denmark 92% 67% 13%
Austria 89% 67% 12%
Italy 88% 68% 11%
Switzerland 88% 59% 15%
Netherlands 91% 48% 22%
England 76% 58% 10%
France 71% 59% 6%
Sweden 83% 40% 23%
Finland 79% 35% 23%
Sorted by total availability % according to
Scotland 67% 44% 12%
EFPIA W.A.I.T. (2017 – 2020 cohort)
Czech 79% 32% 25%
Belgium 79% 29% 26%
Spain 68% 38% 16%
Norway 72% 31% 22%
Portugal 67% 35% 17%
Greece 67% 31% 19%
Slovenia 70% 27% 23%
Luxembourg 66% 29% 19%
Ireland 61% 25% 19%
Hungary 64% 18% 25%
Bulgaria 47% 14% 18%
Cyprus 54% 5% 26%
Iceland 42% 11% 17%
Poland 39% 13% 14%
Estonia 41% 11% 16%
Romania 34% 14% 11%
Croatia 41% 5% 19%
Slovakia 29% 15% 7%
Russia 37% 7% 16%
Latvia 30% 6% 13%
Lithuania 30% 5% 13%
Turkey 21% 8% 7%
Serbia 20% 2% 9%
Bosnia and Herz. 18% 1% 9%
Macedonia 14% 0% 8%
Malta 7% 7% 0%
Kazakhstan 9% 4% 3%
Albania 5% 1% 2%
Source: EFPIA Patients W.A.I.T. Indicator 2021, IQVIA analysis of company size, top-20 pharma defined by 2022
Q1 MAT total sales (Rx only) globally
The speed of the national timelines and adherence
Most European countries have a set of rules around the timelines for decision-making on
national pricing and reimbursement, but even when countries have such rules in place,
compliance can be challenging. This results in delays and unpredictability of timelines.
The length of time taken should reflect the EU Transparency Directive (European
Commission, 1988). The purpose of this directive is to ensure the transparency of
measures that regulate P&R of medicinal products. It sets a strict maximum time of 180
days for reaching a national P&R. This timeline starts from the moment a dossier is
submitted and excludes time needed by companies to provide additional information (“clock
stops”). The Transparency Directive puts the responsibility in the hands of national
governments, whereas it is a responsibility of all stakeholders to allow for reasonable
interactions in order to ensure evidence-based decision-making within this time frame.
The length of time taken from application for reimbursement to approval for reimbursement
clearly varies significantly across EU countries (after taking into account the delay initiation
of the process). This is consistent with the OECD analysis, which was able to separate
these time periods for a selection of European countries.
There is relatively little data on the time taken from the start of the national P&R process to
its conclusion. The data from the TPA study for the six case study countries is below. This
Page 17The root cause of unavailability and delay to innovative medicines
April 2022
shows that even after taking into account delayed initiation, there are significant differences
across countries.
Figure 13: Start of the national process in the six case study countries
Source: Time to Patient Access
It has also been pointed out by a number of different authors that tailored approaches for
different types of medicines can improve access.
• In some markets there is immediate access of medicines that are dispensed in the
hospital, but the national reimbursement process applies to medicines dispensed
in community pharmacies. However, as specialist medicines have become an ever
larger part of the healthcare budget, more restrictions have been applied, as
illustrated by the case of the Netherlands.32
• In other cases there are different channels for different types of medicine. For
example, Deticek found that the most successful countries in terms of rapid
availability of orphan medicines were Germany, Norway, Finland, Sweden, and
France. These countries also have specific mechanisms to improve patient access
to these medicines and to grant full or substantial reimbursement from public
resources.33
1.5.3. Delays due to the value assessment process
A part of the P&R process is the value assessment process. Misalignment on evidence is
reported as one of the most prominent and complex delaying factors. Misalignment takes
place not only between industry, regulators, and HTA bodies, but also occurs between
regulators and HTA bodies, as well as among different HTA bodies. Misalignment can be
found in all assessment criteria including patient population, comparators, trial design, end
points, and statistical analysis. Even once there is agreement on evidence, there can be a
32 How is patient access to high-cost orphan drugs changing? https://www.remapconsulting.com/patient-access-to-
high-cost-orphan-drugs-remap-consulting/
33 Patient Access to Medicines for Rare Diseases in European Countries. Andreja Detiček, Igor Locatelli, Mitja Kos
Page 18The root cause of unavailability and delay to innovative medicines
April 2022
significant debate on whether this justifies the price of the medicine. Finally, different
countries have adopted different approaches to class competition and the value of choice.
Misalignment on evidence requirement
Once the P&R process is initiated, one of the reasons that the national timeline gets
extended are clock stops, requests for information or rejections during the HTA process.
Different countries have different requirements for the evidence, during the assessment
process, and this represents a challenge, as (1) evidence is developed at a global level and
hence developing additional country specific evidence can be time-consuming, and (2) the
evidence requirements are not always predictable (even with early dialogue processes that
have developed in Europe over the last five years).
To illustrate the differences in evidence requirements we can compare the evidence
requirements of EMA and the HTA bodies in the six case study countries from the TPA
project (see Figure 12). Based on desk research and interviews with agency
representatives, for each agency the research assessed whether 19 different
characteristics would be accepted as convincing evidence.
The level of alignment is highest for the use of biomarkers and real-world evidence (RWE),
for example. These elements are “often accepted” by all HTA bodies. The level of alignment
is lowest when HTA bodies are asked for acceptance of surrogate endpoints other than
progression-free survival (PFS). Every agency looks at the use of surrogate endpoints in a
different way: these are accepted in Poland and often accepted in Sweden; not accepted
in the Netherlands and often not accepted in Portugal. England and Italy determine
acceptance on a case-by-case basis.
Figure 14: Evidence requirements vary between agencies, prolonging national
discussions and decision-making.
Source: Time to Patient Access
This is illustrated in the figure above. The grey colour code reflects acceptance on a case-
by-case basis. The blue colour code (“often not accepted”) and lighter orange colour (“often
accepted”) also reflect a certain level of unpredictability.
Misalignment of value and price
Next, even if there is agreement on the evidence regarding the value of a medicine, different
countries have different levels of income and hence ability to pay. Decision makers are
faced with the enormous challenge of striking a balance between fast patient access,
uncertainty about real-world value, and a reasonable price reflecting the (potential) value.
Page 19The root cause of unavailability and delay to innovative medicines
April 2022
There is clearly also a debate around delays and price. Looking at a simple correlation we
find that there is a positive relationship between price indices and availability. This is,
however, too simplistic, as high price countries may have quicker diffusion and greater
usage. So there are many confounding factors. The limited number of studies that have
tried to unpick the relationship between delay and price have not found a meaningful result.
Ferrario (2018) found expected prices do not affect the speed of launch although pointed
out this may be due to limited variation in prices across the four study countries.34
However, there is broad consensus that prices need to reflect the ability to pay. Where
prices are higher than the perceived value or affordability, there is an inevitable delay as
the price is negotiated. This is clearly complicated by external reference pricing (discussed
above); this means that the agreed price needs to take into account how this price will be
used outside of the country, in addition to whether it aligns with the assessment of value by
the national HTA body. Where it is possible to use flexible contracts to align price and value,
this should reduce delays. However, the ability to agree novel payment mechanisms varies
considerably around Europe. This is particularly the case in Central and Eastern Europe,
where we observe the largest delays.
Figure 15: The use of managed entry agreements (MEAs) across Europe
Source: EFPIA “MEAs and innovative pricing models: Real world experience” Final Report 2018
The value assigned to product differentiation and choice
The value that countries place on a particular medicine also varies. Countries may have
different numbers of patients with a particular condition (some countries may have very
few); and approaches to treatment may vary, with some countries favouring surgical
approaches rather than therapeutic interventions. So clinical and epidemiological factors
affect the degree to which countries have an unmet need and therefore the degree to which
these are prioritised in P&R process and value assessments.
34 Time to Entry for New Cancer Medicines: From European Union–Wide Marketing Authorization to Patient Access
in Belgium, Estonia, Scotland, and Sweden. Ferrario, A. Health Policy Analysis. Value in Health 21(7): 809–821,
01 July 2018
Page 20The root cause of unavailability and delay to innovative medicines
April 2022
There is another dimension to this and it is about physician choice and the value of
competing medicines. Different countries take different approaches as to value of class
competitors. Some countries believe that physicians should have access to all the products
on the market, in order to provide patients with the best products for them and to allow
physicians clinical freedom. Equally, competition between innovative medicines is
encouraged in some markets, with the follow-on products in a class being encouraged as
this can lead to competition and better value for the payer. Other countries have favoured
an approach of choosing a preferred product – sometimes through a rigid procurement
process that allows them to select a single manufacturer at least for a period of time. If this
is the case, is it unsurprising that we see access to only a subset of the products. To
examine this, IQVIA has examined a series of ATC4 therapeutic classes. It is not surprising
that as the number of ATC4 options decreases, more countries approve all authorised
options.
Given that the number of options vary in different ATC4 classes, we would therefore expect
to see differences in availability of products. This is validated by the evidence. If we look at
HIV antivirals (J5C9). Although availability varies significantly across the European
countries, all countries have access to at least one product in the class.
Figure 16: Number of products available in a therapeutic class (the example of HIV
antivirals (J5C9))
Source: EFPIA Patients W.A.I.T. Indicator 2021 IQVIA ATC4 class (J5C9, HIV antiretrovirals, n=8) size,
A similar result is seen in other therapeutic areas: Hep-C, PD-L1, and Her-2 inhibitors.
The number of products available in a therapeutic class is therefore likely to reflect the
value that different countries put on competing products – and the degree to which payers
perceive a loss due to lack of choice.
1.5.4. Health system readiness
The fourth category of root causes relates to the health system, its funding and
infrastructure. To understand availability and delay we need to take into account health
system readiness, particularly insufficient budget to implement decisions, and the
infrastructure for diagnosis.
Insufficient budget to implement decisions
Within Europe, we clearly have countries with very different levels of income, with GDP per
capita varying from €16,000 to €80,000 per annum. They also have made different
decisions regarding the amount that they invest in healthcare. The data from the OECD
clearly shows the European differences in economic context:
• Relative healthcare spending as a % of overall GDP is more than twice as high in
France or Switzerland (11.3% and 12.4% respectively) as in Romania (5.2%).
Page 21The root cause of unavailability and delay to innovative medicines
April 2022
• Relative pharmaceutical expenditures as a % of overall GDP is 3.5 as high in
Greece and over 5 times as high in Bulgaria (2.2% and 3.3%, respectively)
compared to Luxembourg (0.62%).
• Absolute healthcare spending ranges from €6,600 per capita in Switzerland
respectively to €1,300 per capita in Romania (OECD, 2020).
Given the difference in income and spending on healthcare and medicines, it is unsurprising
that the prioritisation of health technologies varies across European countries. Given
healthcare priorities funding, it would be surprising if we saw the same access to different
forms of healthcare.
Figure 17: Relationship between time to availability (delays) and GDP per capita
1000
900
800
Delays prior to availaibility
700
600
500
400
300
200
100
0
- 10,000 20,000 30,000 40,000 50,000 60,000 70,000 80,000 90,000
GDP per capita
Source: IQVIA
As shown in the figure above, we do find a negative relationship between income and
delays (although there are clearly many other factors as well). This result is consistent with
the broader economic literature. Indeed, there are many papers showing that the impact of
the size of the market remains, even after taking into account many other factors. For
example, Costa-Font (2015) observed a significant and robust market size effect that
decreases the launch time of new pharmaceutical products as market size increases.35
Diagnosis, supporting infrastructure and relevance to patients
The existing health infrastructure is a barrier to access in many European countries. For
that reason, even after reimbursement, healthcare systems may face difficulties absorbing
35 Costa-Font, Joan, McGuire, Alistair and Varol, Nebibe (2015) Regulation effects on the adoption of new
medicines. Empirical Economics 49(3): 1101–1121. ISSN 0377-7332
Page 22The root cause of unavailability and delay to innovative medicines
April 2022
and using a new therapy in the most optimal way due to the need for high quality health
facilities, diagnostic centres and health personnel.
In reality, there are many barriers in the infrastructure that mean applying for
reimbursement for a medicine in some markets is not realistic. This is particularly true for
highly specialised or orphan medicines:
• Accurate and timely diagnosis is dependent on the availability of accessible
screening and diagnosis programs and services, which itself depends on the
infrastructure and expertise (e.g. number of geneticists) available.36 The degree to
which countries have adopted widespread screening or targeted diagnosis of at-
risk patients varies significantly.
• Even where diagnosis programs exists in a country, access to diagnostic testing
can be limited. There is a need for appropriate reimbursement for (newly approved)
diagnostics.
• Diagnosis requires investment in reimbursement of diagnostics and appropriate
investment in testing facilities, but also requires investment in physician education
(and a focus on paediatricians) and an effective referral process.
• Given the small number of patients needing highly specialised or orphan medicine,
it is best to concentrate expertise in Centres of Excellence (CoEs), but these are
not evenly developed across European markets.
For many countries the availability of scientifically robust epidemiological data for individual
rare diseases varies greatly, if it is available at all.37 This can create a vicious cycle where
the lack of epidemiological country specific data contributes to a lack of appropriate health
resource prioritisation decisions, and little attention being given to the need to develop rare
disease diagnosis programs. The lack of a developed coding nomenclature for rare
diseases also creates challenges, particularly for healthcare systems to map out their
specialised healthcare services and budget impact.38
As a result – given that the number of patients for rare diseases may be very low, and
finding these patients may be difficult – ensuring appropriate use and pharmacovigilance
is challenging and the commercial viability of applying for reimbursement does not currently
exist.
Figure 18: Investment in in vitro diagnostics (per capita expenditure on in vitro
diagnostics (€) (2016))
36 Dharssi, S., Wong-Rieger, D., Harold, M. and Terry, S. (2017). Review of 11 national policies for rare diseases in the context of
key patient needs. Orphanet journal of rare diseases 12(1): 63
37 Manuel Posada De La Paz, Domenica Taruscio, Stephen C. Groft (2017). Rare Diseases Epidemiology: Update and Overview.
Springer International Publishing (Verlag)
38 Rath, A., Bellet, B., Olry, A., Gonthier, C. and Aymé, S. (2014) How to code rare diseases with international terminologies?
Orphanet journal of rare diseases 9(1): O11
Page 23The root cause of unavailability and delay to innovative medicines
April 2022
Source: EBE Personalised Medicine Report
Given this, it is unsurprising that for some orphan medicines the availability across Europe
is unfortunately low. Even where products are not available on the national reimbursement
list, the industry works with other stakeholders to ensure access for patients. There is
evidence on the use of compassionate use programmes across Europe.39
1.5.5. Delay from national to regional approval
Most of the studies on availability and delays focus on time to national reimbursement. In
reality, there are multiple layers of decision-making processes. In some countries,
reimbursement decisions need to be made at all levels from national level to regional level
and to then local hospital level, thus prolonging the time before patients can access
treatments.
Multiple layers of decision-making processes
European countries have different ways of organising their decision-making processes.
Some countries such as Iceland and Croatia organise price negotiations, assessment,
appraisal and budget allocation on a national level. Other countries organise these
decisions partly at a national level and partly at a regional level. In most European
countries, price negotiations, assessment and appraisal take place on a national level but
budgets are allocated by healthcare insurers (a single payer institution or different health
insurers) or on a hospital level (WHO, 2018).
To illustrate this, many papers examine the situation in Italy. For example, a recent paper
found that for the regional access, both the timing and the number of drugs available for
patients were widely different from region to region. The mean best regional time (defined
as the average number of days after AIFA market authorisation as published in the GU and
the first purchase date in the first Italian region) was 29 days. The longest regional time
(the number of days between GU and the first purchase in the last region for which data
39 Balasubramanian, G. An overview of Compassionate Use Programs in the European Union member states, Intractable Rare Dis
Res. 2016 Nov; 5(4): 244–254. doi: 10.5582/irdr.2016.01054
Page 24You can also read