The North Atlantic Glacial Eastern Boundary Current as a Key Driver for Ice-Sheet-AMOC Interactions and Climate Instability
←
→
Page content transcription
If your browser does not render page correctly, please read the page content below
The North Atlantic Glacial Eastern Boundary Current
    as a Key Driver for Ice-Sheet-AMOC Interactions and
                     Climate Instability
        Samuel Toucanne, Guillaume Soulet, Natalia Vázquez Riveiros, Steven
      Boswell, Bernard Dennielou, Claire Waelbroeck, Germain Bayon, Meryem
                     Mojtahid, Mathieu Bosq, Marjolaine Sabine, et al.

     To cite this version:
    Samuel Toucanne, Guillaume Soulet, Natalia Vázquez Riveiros, Steven Boswell, Bernard Dennielou,
    et al.. The North Atlantic Glacial Eastern Boundary Current as a Key Driver for Ice-Sheet-
    AMOC Interactions and Climate Instability. Paleoceanography and Paleoclimatology, 2021, 36 (3),
    �10.1029/2020PA004068�. �hal-03434827�

                                 HAL Id: hal-03434827
                         https://hal.science/hal-03434827
                                    Submitted on 19 Nov 2021

    HAL is a multi-disciplinary open access            L’archive ouverte pluridisciplinaire HAL, est
archive for the deposit and dissemination of sci- destinée au dépôt et à la diffusion de documents
entific research documents, whether they are pub- scientifiques de niveau recherche, publiés ou non,
lished or not. The documents may come from émanant des établissements d’enseignement et de
teaching and research institutions in France or recherche français ou étrangers, des laboratoires
abroad, or from public or private research centers. publics ou privés.
                                              Copyright
RESEARCH ARTICLE                           The North Atlantic Glacial Eastern Boundary Current
10.1029/2020PA004068
                                           as a Key Driver for Ice-Sheet—AMOC Interactions and
Key Points:
• T he strength of the upper branch
                                           Climate Instability
   of Atlantic meridional overturning      Samuel Toucanne1 , Guillaume Soulet1 , Natalia Vázquez Riveiros1 ,
   circulation (AMOC) is reflected in
                                           Steven M. Boswell2 , Bernard Dennielou1 , Claire Waelbroeck3 ,
   variations of the Glacial Eastern
   Boundary Current along the              Germain Bayon1 , Meryem Mojtahid4 , Mathieu Bosq5 , Marjolaine Sabine6,
   European margin                         Sébastien Zaragosi6 , Jean-François Bourillet1 , and Herlé Mercier7
• Sedimentological data show a
                                           1
   Dansgaard-Oeschger interstadial/         IFREMER, Unité de Recherche Géosciences Marines, Laboratoire Géophysique et enregistrement Sédimentaire,
   faster-stadial/slower flow pattern      Plouzané, France, 2Lamont-Doherty Earth Observatory, Columbia University, Palisades, NY, USA, 3Laboratoire
• Faster upper AMOC in the east basin     d'Océanographie et du Climat: Expérimentation et Approches Numériques, LOCEAN/IPSL, Sorbonne Université-
   corresponds with increased deep
   return flow in the west
                                           CNRS-IRD-MNHN, UMR7159, Paris, France, 4LPG-BIAF UMR-CNRS 6112, Université d'Angers, UFR Sciences, Angers
                                           Cedex, France, 5PACEA, UMR 5199 CNRS - Université Bordeaux, Pessac, France, 6UMR-CNRS 5805 EPOC - OASU,
                                           Université de Bordeaux, Pessac, France, 7CNRS, IFREMER, Université de Brest, IRD, Laboratoire d'Océanographie
Supporting Information:                    Physique et Spatiale (LOPS), Centre IFREMER de Bretagne, Plouzané, France
•   Supporting Information S1
•   Table S1
•
•
    Table S2
    Table S3
                                           Abstract The upper branch of the Atlantic meridional overturning circulation (AMOC) plays a
                                           critical role in ocean circulation and climate change, yet its variability during the last glacial period is
                                           poorly documented. Here, we investigate the northward-flowing Glacial Eastern Boundary Current
Correspondence to:
                                           (GEBC) in the North Atlantic, known today as the European Slope Current, and representing the
S. Toucanne,
stoucann@ifremer.fr                        easternmost portion of the upper branch of the AMOC. Based on flow speed and isotopic records, we

                                           the ∼50–15 ka period. This, by analogy to present-day conditions, suggests enhanced (reduced) strength
                                           show that Dansgaard-Oeschger (D-O) interstadials (stadials) correspond to a faster (weaker) GEBC during
Citation:
Toucanne, S., Soulet, G., Riveiros,        of the subpolar gyre and, by extension, of northern-sourced water production and AMOC during D-O

                                           ∼30 and 17 ka suggest an active role of the upper branch of AMOC in the poleward transport of heat
N. V., Boswell, S. M., Dennielou, B.,      interstadials (stadials). Concomitant fluctuations of both the GEBC and the European Ice Sheet between
Waelbroeck, C., et al. (2021). The North
Atlantic Glacial Eastern Boundary
Current as a key driver for ice-sheet—     and freshwater to the northern North Atlantic, with direct impacts on deep water formation and AMOC
AMOC interactions and climate              strength. We explore these ice-sheet—AMOC interactions and the associated abrupt climate changes over
instability. Paleoceanography and
                                           the last glacial period and the last deglaciation.
Paleoclimatology, 36, e2020PA004068.
https://doi.org/10.1029/2020PA004068

Received 24 JUL 2020                       1. Introduction
Accepted 25 FEB 2021
                                           The Atlantic meridional overturning circulation (AMOC), consisting of a warm, northward flow in the
                                           upper layer of the Atlantic, the formation of North Atlantic Deep Water (NADW) at high latitudes, and
                                           southward return flow at depth, moves immense amounts of heat northwards (Hall & Bryden, 1982; Tren-
                                           berth et al., 2019). Ocean circulation is thus an active player in the global climate system. A causal link
                                           has been proposed between changes in the AMOC and the climate swings of the last glacial cycle (Broe-
                                           cker, 1991; Broecker & Denton, 1990; Lynch-Stieglitz, 2017; Rahmstorf, 2002). While this was first shown
                                           for the late-glacial period (Boyle & Keigwin, 1987; Lehman & Keigwin, 1992; Marchitto et al., 1998; Mc-
                                           Manus et al., 2004), the association between millennial-scale climate changes punctuating the last glacial
                                           cycle, that is, Dansgaard-Oeschger (D-O) oscillations (Dansgaard et al., 1993), and AMOC perturbations
                                           (Elliot et al., 2002; Keigwin & Jones, 1994) was studied at high resolution only recently (Böhm et al., 2015;
                                           Gottschalk et al., 2015; Henry et al., 2016; Hoogakker et al., 2007; Kissel et al., 2008; Waelbroeck et al., 2018).
                                           In brief, the AMOC in the deep North Atlantic was significantly weakened during the coldest intervals
                                           (stadials), whereas rapid accelerations were concurrent with Greenland and North Atlantic warm events
                                           (interstadials). This oceanic process is thought to have played a crucial role in the interhemispheric redistri-
                                           bution of heat and the asynchronous relationship observed between millennial-scale temperature changes
© 2021. American Geophysical Union.        over Greenland and Antarctica (Buizert, Keisling, et al., 2018; Buizert, Sigl, et al., 2018; EPICA Community
All Rights Reserved.                       Members, 2006; WAIS Divide Project Members, 2015).

TOUCANNE ET AL.                                                                                                                                       1 of 23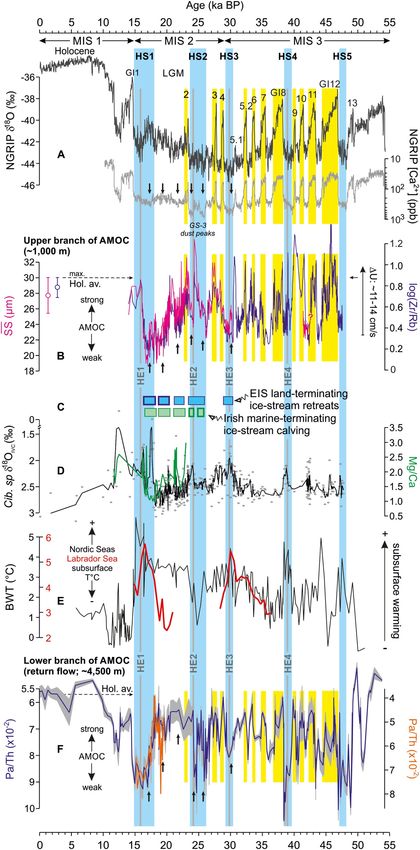
Paleoceanography and Paleoclimatology                                                     10.1029/2020PA004068

                       Table 1
                       Core Locations
                       Core label        Lat. N      Long. W      Depth (m)                 Cruise (year)                 IGSN
                       MD99-2328        48°04.62      9°30.35         942          IMAGES V LEG 4-MD114 (1999)    BFBGX-93178
                       CBT-CS10         47°31.83     7°29.455        1,015         CABTEX (2010)                  BFBGX-86847
                       MD95-2002        47°27.12      8°32.03        2174          IMAGE1-MD101 (1995)            IEFRA05KC
                       BOB-CS03         47°23.665    6°45.041        1,011         BOBGEO (2009)                  BFBGX-88574
                       GIT-CS02         47°21.83      6°44.92        1,051         GITAN (2015)                   BFBGX-127464
                       BOB-CS05         46°18.85      4°38.12        1,015         BOBGEO (2009)                  BFBGX-88576
                       MD04-2842        46°04.02      4°42.81        2,450         MD142-ALIENOR 2 (2004)         IEFRA04P1
                       Note. See Figure S1 for high-resolution bathymetric maps.

                      While there is currently little doubt that AMOC changes play a major role in the dynamics of the D-O
                      oscillations, the causes and mechanisms behind these climatic events as well as their link to the episodic
                      iceberg-discharge events (or Heinrich events, HE) from the Hudson Strait Ice Stream of the Laurentide Ice
                      Sheet (LIS; Hemming, 2004) remain a subject of active discussion (see Menviel et al., 2020 for a review).
                      Among the various processes invoked for D-O oscillations are the interactions between convection sites and
                      the cryosphere in the North Atlantic, either through wind-stress forcing (Arzel et al., 2010; Wunsch, 2006;
                      Zhang et al., 2014), sea-ice variability (Dokken et al., 2013; Gildor & Tziperman, 2003; Li et al, 2005, 2010;
                      Sévellec & Fedorov, 2015), ice shelf collapse (Boers et al., 2018; Petersen et al., 2013), or meltwater fluxes
                      (Broecker et al., 1990; Ganopolski & Rahmstorf, 2001; Manabe & Stouffer, 1995; Menviel et al., 2014), to-
                      gether with the reorganization of the ocean-atmosphere system in the Southern Hemisphere via changes
                      in the ocean surface temperature, the position of the mid-latitude westerly winds and changes in ocean
                      stratification and air-sea CO2 fluxes (Buizert, Sigl, et al., 2018; Zhang et al., 2017). Numerical approaches
                      underscore the fundamental role of heat and salt in the millennial scale AMOC changes, revealing that
                      their northward transport by the Gulf Stream—North Atlantic Current (NAC) system sustains internal
                      feedbacks and oscillations (Arzel et al., 2010; Boers et al., 2018; Peltier & Vettoretti, 2014; Saha, 2015; Shaffer
                      et al., 2004; Webb et al., 1997). This highlights the role of the upper branch of the AMOC in glacial mil-
                      lennial-scale climate fluctuations (Chapman & Shackleton, 1998; Lehman & Keigwin, 1992; Rasmussen &
                      Thomsen, 2004).

                      The glacial variability of the upper branch of the AMOC remains poorly documented. Although some re-
                      cords have been successfully obtained from the western (sub)tropical Atlantic where the Gulf Stream orig-
                      inates (Hoogakker et al., 2013; Lynch-Stieglitz et al., 1999, 2014; Vautravers et al., 2004) to the northern
                      end of the NAC in the Nordic Seas (Lehman & Keigwin, 1992; Rasmussen & Thomsen, 2004, 2008; Weinelt
                      et al., 2003), direct evidence for millennial-scale changes in the vigor of the upper branch of the AMOC has
                      yet to emerge. Here we provide inferred flow speed records from the upper slope (∼1,000 m) of the French
                      Atlantic margin that display clear D-O variability. This result, together with oxygen, carbon and radiogenic
                      neodymium isotopic data, reflects the variability of the northward-flowing eastern boundary current along
                      the western European margin, known today as the European Slope Current and constituting the eastern-
                      most portion of the upper branch of the AMOC (Huthnance et al., 2020). We explore the role of this current
                      in ice-sheet—AMOC interactions and glacial abrupt climate shifts.

                      2. Core Location and Hydrographic Setting
                      This study is based on six long-piston cores from the French Atlantic margin, located along a 450 km-tran-

                      BOB-CS03, GIT-CS02, and BOB-CS05) were retrieved at ∼1,000 m water depth in the upper slope to pro-
                      sect between 46°N and 48°N (Table 1, Figure 1 and Figure S1). Five of these cores (MD99-2328, CBT-CS10,

                      duce a continuous composite stratigraphic record (see Section 4). Core MD04-2842 was retrieved at 2,450 m.
                      Lithofacies at these intermediate depth sites consist of muddy to fine-sandy contourites (see Text S1; Stow
                      & Holbrook, 1984), that is, sediments deposited or substantially reworked by the persistent action (e.g.,
                      selective deposition, winnowing, erosion) of bottom currents.

TOUCANNE ET AL.                                                                                                                  2 of 23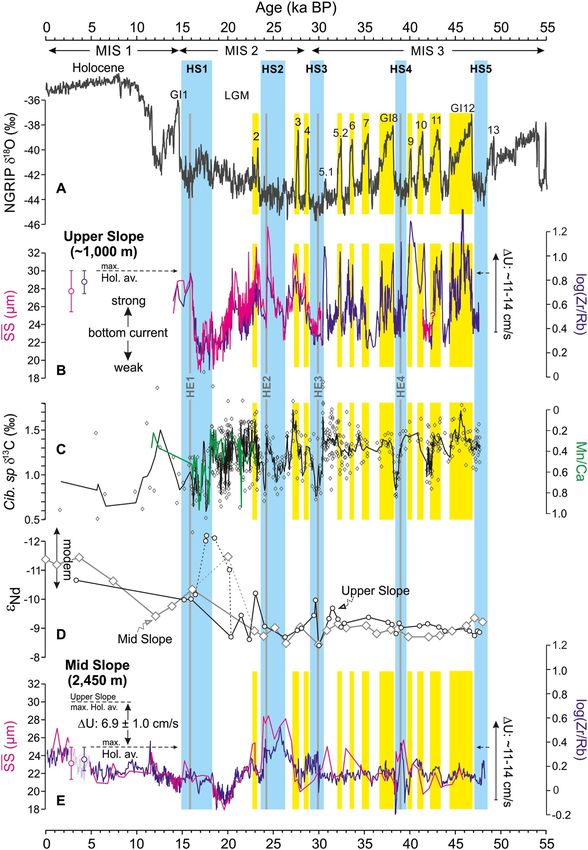
Paleoceanography and Paleoclimatology                                                              10.1029/2020PA004068

Figure 1. The modern North Atlantic Ocean circulation. (a) Detailed schematic of the upper cell of the AMOC with a warm, northward flow in the upper
Atlantic (Gulf-Stream—North Atlantic Current (NAC) system, upper branch of the AMOC; red arrows), the formation of North Atlantic Deep Water (NADW)
at high latitudes (i.e., DSOW, ISOW, and LSW; see below), and southward return flow (lower branch of the AMOC; blue arrows) at depth (including the Deep
Western Boundary Current, DWBC). The main water masses are indicated: Denmark Strait Overflow Water (DSOW), Iceland-Scotland Overflow Water (ISOW),
Labrador Sea Water (LSW) and Mediterranean Outflow Water (MOW). Dashed blue arrows highlight eastward recirculation of NADW by interior pathways.
The European Slope Current (∼500–2,000 m along the European margin, black arrow), the Greenland currents (in green) and the polar (PF) and subpolar (SPF)
fronts (dashed black lines) are shown. SPG: subpolar gyre. STG: subtropical gyre. The main topographical features controlling the flow pathways are labeled:
Bight Fracture Zone (BFZ), Charlie–Gibbs Fracture Zone (CGFZ), Faraday Fracture Zone (FFZ), Maxwell Fracture Zone (MFZ), Mid-Atlantic Ridge (MAR),
and Rockall Trough (RT). Color changes in the bathymetry at 100 m, at 1,000 m, and every 1,000 m below 1,000 m. Colored circles show the location of the core
sites/records discussed in this study, including those from the French Atlantic margin (yellow star; Figure S1) (adapted from Daniault et al., 2016). (b) Averaged
velocity (cm/s) profiles for the NAC branches (Daniault et al., 2016).

                                         The modern hydrography of the mid-latitude NE Atlantic at intermediate depth is dominated by the pres-
                                         ence of the Mediterranean Outflow Water (MOW) and the Labrador Sea Water (LSW) (Van Aken, 2000).

                                         and overlies the LSW centered at ∼2,000 m (Van Aken, 2000). The distribution of these water masses, and in
                                         The MOW is the main intermediate (∼600–1,500 m) water mass up to about 50°N (Iorga & Lozier, 1999),

                                         particular the MOW north of 48–50°N (Iorga & Lozier, 1999; Lozier & Stewart, 2008), is strongly impacted by
                                         an eastern boundary current, namely the European Slope Current (Booth & Ellett, 1983; Huthnance, 1986;

                                         flows along the bathymetric contours) is recognized down to ∼2,000 m from the Iberian margin (∼40°N) to
                                         Pingree & Le Cann, 1989) (Figure 1). This poleward along-slope current (or “contour” current because it

                                         the Faroe-Shetland Channel (∼60°N) where it forms, together with the NAC, the Norwegian Atlantic Slope
                                         Current (Orvik & Niiler, 2002). Mean velocities of the European Slope Current reach a maximum on the
                                         upper slope (∼500–1,000 m) and significantly increase poleward (Huthnance, 1986), from 5–10 cm.s−1 in
                                         the Bay of Biscay to 10–20 cm.s−1 along and north of the Hebridean slope (Pingree & Le Cann, 1989, 1990;
                                         Xu et al., 2015). Peak poleward flows (with velocities of up to 20–30 cm.s−1) are observed in winter (Pingree

TOUCANNE ET AL.                                                                                                                                           3 of 23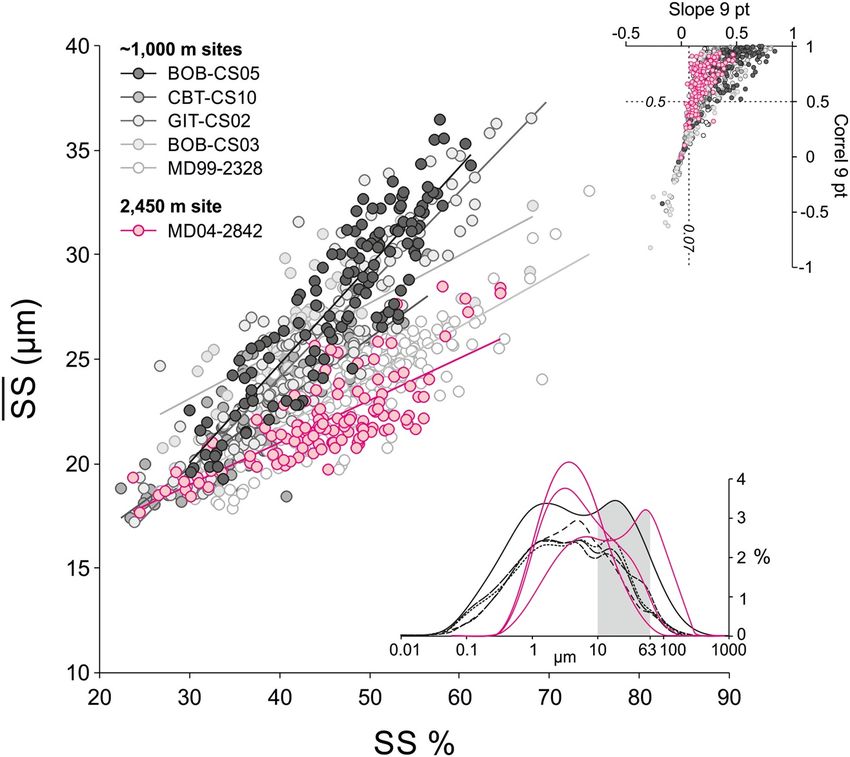
Paleoceanography and Paleoclimatology                                              10.1029/2020PA004068

                      et al., 1999). Seasonal difference in current speed amount to ∼8–10 cm.s−1 on the Hebridean slope but only
                      ∼5 cm.s−1 on the Bay of Biscay slopes (Xu et al., 2015). The European Slope Current controls the entrain-
                      ment and dispersion of the suspended particulate matter and governs the slope sedimentation (de Madron
                      et al., 1999; McCave et al., 2001; Thomsen & Van Weering, 1998). This is supported at geological timescale
                      by the occurrence of thick continental slope contourite deposits all along the western European margin
                      (Hernández-Molina et al., 2011; Laberg et al., 2005).

                      The European Slope Current is driven both by the steep topography of the European margin and large-scale
                      meridional density gradients (Friocourt et al., 2007, 2008; Huthnance, 1984; Pingree & Le Cann, 1990).
                      Recent observations from the Hebridean region reveal that decadal scale variability in the strength of the
                      European Slope Current is, to first order, directly connected to that of the cyclonic subpolar gyre (SPG; and
                      associated meridional density gradients) with a strong (weak) SPG associated with a strong (weak) slope

                      recruited from the eastern North Atlantic and is connected, north of ∼55°N (i.e., Rockall Trough), to the up-
                      current (Marsh et al., 2017). These observations support the idea that the European Slope Current is largely

                      per part of the NAC (the NAC being the eastern limb of the SPG) (Houpert et al., 2020; Lozier et al., 2019).
                      Further south, in the central North Atlantic (∼46–53°N), the NAC flows eastward in three main branches
                      with circulation pathways strongly constrained by the Mid-Atlantic Ridge (MAR) (Daniault et al., 2016).

                      at 41.8 ± 3.7 Sv, and ∼8–10 Sv are directly carried to the Nordic Seas by the southern NAC branch (Daniault
                      The top-to-bottom transport of the NAC (down to 3,000–4,000 m water depth) east of the MAR is estimated

                      et al., 2016; Lozier et al., 2019; Sarafanov et al., 2012). Along that route, the NAC impinges on the western
                      European margin (as deep as 1,200 m; Lozier et al., 2019) and the Rockall Plateau subdivides the NAC in
                      two quasi-permanent jets (Houpert et al., 2018). Then, the NAC branch in the Rockall Trough moves north-
                      ward joining the European Slope Current that contributes about 2.7 ± 0.5 Sv (∼25%) to the Atlantic inflow
                      entering the Nordic Seas (Berx et al., 2013). This warm, salty water forms the bulk of the upper branch of

                      Seas that significantly contribute, together with LSW, to NADW (down to ∼4,500 m at ∼50°N) (Dickson &
                      the AMOC (Huthnance et al., 2020; Lozier et al., 2019), compensating the dense overflows from the Nordic

                      Brown, 1994; Lozier et al., 2019). The NADW is a major component of the global thermohaline circulation
                      since it is the deep return flow (lower branch) of the “upper cell” of the AMOC (the deeper “lower cell”
                      originates from Antarctica); the Deep Western Boundary Current (DWBC) along the eastern continental
                      margin of North America is the primary export pathway of NADW at present (Buckley & Marshall, 2016).
                      Recirculation of NADW by interior pathways (including LSW spreading toward the NE Atlantic; Bower
                      et al., 2009) are signatures of interaction with the Gulf Stream—NAC system (Buckley & Marshall, 2016;
                      Zou et al., 2017) (Figure 1).

                      Although the upper cell of AMOC was also present during the last glacial period (Pöppelmeier et al., 2020;
                      Weber et al., 2007), the AMOC was possibly weaker (Du et al., 2020; Vettoretti & Peltier, 2013; Weber
                      et al., 2007) and its geometry in the North Atlantic was likely shifted southward due to the presence of
                      thick continental ice-sheets that altered wind patterns (Keffer et al., 1988; Löfverström et al., 2014). NADW
                      was likely replaced by shallower (≤2,000 m), Northern-sourced intermediate-deep Waters (NSW; Boyle &
                      Keigwin, 1987; Curry & Oppo, 2005; Duplessy et al., 1988; Lippold et al., 2012; Lynch-Stieglitz et al., 2007;
                      Marchitto & Broecker, 2006; Oppo & Lehman, 1993; Sarnthein et al., 1994). The location of NSW convec-
                      tion sites (including that of the Glacial North Atlantic Intermediate Waters at the Last Glacial Maximum
                      [LGM], ca. 26–19 ka; Boyle & Keigwin, 1987) remains uncertain. Nevertheless, it has been suggested that a
                      shift from convection in the Nordic Seas (warm periods) to the subpolar open North Atlantic Ocean south of
                      Iceland (cold periods) accompanied past climate changes at both glacial-interglacial (Duplessy et al., 1988;
                      Ganopolski et al., 1998; Sarnthein et al., 1994) and D-O timescales (Ganopolski & Rahmstorf, 2001;
                      Rahmstorf, 2002).

                      3. Methods
                      3.1. Near-Bottom Flow Speed: Sortable Silt and XRF Zr/Rb Ratio

                      Grain-size analyses (n = 1,055) were performed using a Mastersizer 3,000 laser diffraction particle size
                      analyzer coupled to a Hydro LV wet dispersant unit after removal of sediment carbonate fraction with 1 N
                      acetic acid. The “sortable silt” mean size (SS), that is the mean grain size of the carbonate-free 10–63 µm

TOUCANNE ET AL.                                                                                                             4 of 23
Paleoceanography and Paleoclimatology                                                        10.1029/2020PA004068

                      Figure 2. Sortable silt proxy validation. Dispersion plots of sortable silt (carbonate free, 10–63 µm silt fraction) mean
                      size (SS) versus percentage of sortable silt (SS%, in the total 0.5 and a slope >0.07 (upper right
                      panel), which demonstrates that the sorting process is controlled by current flow dynamics (McCave & Andrews, 2019).

                      ∼1,000 m (black lines) and 2,450 m (magenta lines), with the 10–63 µm fraction highlighted in light gray.
                      Also shown are the grain size distributions for representative samples of contourite sediments (lower right panel) at

                      terrigenous silt fraction, and the percentage of sortable silt (SS%) in the total 50% (McCave & Andrews, 2019). Our approach was complemented (for Marine Iso-

                      (Dypvik & Harris, 2001; Rothwell & Croudace, 2015) used in marine (Wu et al., 2020), lacustrine (Kylander
                      et al., 2011), and terrestrial environments (Chen et al., 2006). In contourite deposits, XRF Zr/Rb provides a
                      qualitative record of past changes in near-bottom current flow speed, since coarser grain size and stronger
                      bottom currents are identified by a higher proportion of Zr-rich silt and sand (i.e., reflecting the presence of
                      zircon grains) over Rb-rich clay (e.g., Toyos et al., 2020). Relative abundances of Zr and Rb, as well as those
                      of major elements including Ca and Ti (see Section 4), were analyzed using an Avaatech X-ray Fluorescence
                      (XRF) core scanner. XRF data were collected every 1 cm along the entire length of the cores with a counting
                      time of 10 s, setting the voltage to 10 kV (no filter) and 30 kV (Pd thick filter) and the intensity to 600 and
                      1,000 µA, respectively. In addition, the lower part of core BOB-CS03 was analyzed every 1 mm (count time
                      of 30 s, voltage of 10–30 kV, and intensity of 1,000 µA). Results are presented in log ratios of element inten-
                      sities (Weltje & Tjallingii, 2008).

TOUCANNE ET AL.                                                                                                                         5 of 23
Paleoceanography and Paleoclimatology                                                       10.1029/2020PA004068

                                                                            3.2. Bottom-Water Chemistry: Carbon, Oxygen, and Radiogenic
                                                                            Neodymium Isotopes

                                                                            Benthic foraminiferal (n = 684) 18O/16O and 13C/12C ratios (δ18O and δ13C
                                                                            respectively, expressed in ‰ with respect to the Vienna Pee-Dee Belem-
                                                                            nite standard, VPDB) were measured to reconstruct changes in bottom
                                                                            water properties. Benthic δ18O records combine bottom water δ18O and
                                                                            temperature changes, whereas epibenthic foraminiferal δ13C records
                                                                            changes in bottom water ventilation, defined as the transmission of oxy-
                                                                            gen-rich, atmosphere-equilibrated water to the ocean interior (Duplessy
                                                                            et al., 1988; Eide et al., 2017). Measurements were performed at the Lab-
                                                                            oratoire des Sciences de l'Environnement et du Climat (LSCE) and at the
                                                                            University of Bordeaux (UMR CNRS 5805 EPOC) on Elementar Isoprime
                                                                            and Optima Micromass mass spectrometers. VPDB is defined with re-
                                                                            spect to NBS-19 calcite standard (δ18O = −2.20‰ and δ13C = +1.95‰).
                                                                            The mean external reproducibility (1σ) of carbonate standards is ±0.05‰
                                                                            for δ18O and ±0.03‰ for δ13C. Measured NBS-18 δ18O and δ13C are
                                                                            −23.27 ± 0.10‰ VPDB and −5.01 ± 0.03‰ VPDB, respectively. Measure-
                                                                            ments were performed on Cibicidoides kullenbergi (n = 481), Cibicidoides
                                                                            pachyderma (n = 118), and Cibicides wuellerstorfi (n = 53) found in the
Figure 3. Grain-size proxies and related flow speed. Dispersion plots       250–400 µm size fraction. The samples were cleaned in a methanol ultra-
of SS versus log (Zr/Rb) (n = 794) for the upper (∼1,000 m; gray and        sonic bath for a few seconds in order to remove impurities. A correction
black circles) and middepth (2,450 m; magenta circles) French Atlantic      factor of +0.34 ± 0.03‰ for δ13C (calculated based on 21 paired analyses
contourites. Positive correlations (0.65 < r < 0.85) confirm the Zr/        of C. kullenbergi and C. wuellerstorfi) was applied to the δ13C values of
Rb ratio as a grain-size indicator (Dypvik & Harris, 2001; Rothwell &       C. kullenbergi and C. pachyderma to account for the relatively constant
Croudace, 2015). The magnitude of absolute changes in flow speed (U) is
given using a sensitivity of 1.36 ± 0.19 cm s−1/μm (McCave et al., 2017).
                                                                            offset (linked to vital effect and/or habitat preferences) with regard to C.
                                                                            wuellerstorfi (Figure S2) that is believed to calcify in equilibrium with the
                                                                            isotopic composition of bottom-waters. No offset is apparent for δ18O val-
                                                                            ues (0.07 ± 0.26‰). Only 32 isotopic analyses (C. wuellerstorfi) were car-
                                                                            ried out on core MD04-2842 due to the scarcity of benthic foraminifera.

                                        Radiogenic neodymium isotopic signatures (εNd) of planktonic foraminifera coatings (n = 70) were used
                                        to investigate past changes in the provenance of bottom-water masses. Prior to Nd isotopic measure-

                                        et al. (2014). Briefly, between ∼6 and 21 mg of foraminifera were gently crushed between glass plates,
                                        ments, foraminiferal samples were prepared and dissolved following the method described in Tachikawa

                                        then cleaned several times in ultrapure (18.2 MΩ) water in order to remove any detrital particles. The test
                                        fragments were transferred into acid-cleaned centrifuge tubes, covered with 500 µL ultrapure water, and
                                        dissolved progressively by stepwise addition (100 µL) of diluted (1 M) ultrapure glacial acetic acid solution.
                                        Nd was isolated using conventional ion chromatography and isotopic measurements were performed at
                                        the Pôle Spectrométrie Océan (Brest) using a Thermo Scientific Neptune multi-collector ICPMS. Nd iso-
                                        topic compositions were determined using sample-standard bracketing by analyzing an in-house (SPEX-
                                        Nd) standard solution every two samples. Analyses of JNdi-1 standard solutions during the course of this

                                        (0.512115) reported in Tanaka et al. (2000), and corresponding to an external reproducibility of ∼±0.17ε (2
                                        study gave 143Nd/144Nd of 0.512117 ± 0.000009 (2 SD, n = 10), in agreement with the recommended value

                                        SD). Epsilon Nd values (εNd) were calculated using the chondritic (CHUR) 143Nd/144Nd value of 0.512630
                                        (Bouvier et al., 2008).

                                        4. Chronology
                                        The chronology of all studied cores is based on the synchronization of XRF data with that of the refer-

                                        distance of ∼450 km from the studied cores. The chronostratigraphy of core MD95-2002 is based on 26
                                        ence core MD95-2002 (Grousset et al., 2000; Toucanne et al., 2015; Figure S3), located at a maximum

                                        14
                                           C ages (performed on monospecific Globigerina bulloides or Neogloboquadrina pachyderma samples)
                                        and additional control-points obtained through aligning both N. pachyderma abundances and XRF log
                                        (Ca/Ti) ratios to the NGRIP δ18O record (GICC05 timescale; Table S1). The final age model of core MD95-

TOUCANNE ET AL.                                                                                                                                  6 of 23
Paleoceanography and Paleoclimatology 10.1029/2020PA004068
2002, extended here to ∼50 ka (∼38 ka in Toucanne et al., 2015), was established using the age modeling
software Clam (Blaauw, 2010) and is reported with 95% confidence intervals (see Toucanne et al., 2015
for details).
Site-to-site stratigraphic correlations rely on the recognition of millennial-scale features (e.g. LGM-n,
HS1-n, etc.) in the highly resolved XRF log (Ca/Ti) records (Figure S4 and Table S2). This approach revealed
sediment hiatuses on the upper slope, especially for the late glacial-Holocene (Mojtahid et al., 2017) and
the production of a stratigraphic “composite” sequence at ∼1,000 m covering the last 48 kyr with the excep-
MIS 3 (only recorded at site BOB-CS03) intervals (Figure S3). Nevertheless, the available time series allowed
tion of the Bølling-Allerød interval that corresponds to a hiatus of sedimentation at all sites. In contrast, the
high mean sedimentation rates ranging from ∼30 cm.kyr−1 (cores BOB-CS03, MD04-2842) to ∼70 cm.kyr−1
deeper (mid-slope) core MD04-2842 shows a continuous stratigraphic sequence. Our chronologies reveal
(cores BOB-CS05, CBT-CS10) over the last glacial period and a high variability through time (e.g. ∼20 and
60 cm.kyr−1 in core BOB-CS03 for MIS 3 and MIS 2, respectively). Maximum sedimentation rates (∼100 cm.
kyr−1) are found at site MD99-2328 (Figure S5).
5. Results
5.1. Near-Bottom Flow Speed
The suitability of sediments of the upper (∼1,000 m water depth) and lower (2,450 m) French Atlantic slope
to provide a reliable flow history was examined by testing the degree of correlation between the sortable silt
mean size (SS) and percentage (SS%) (McCave & Andrews, 2019; McCave, Manighetti, & Robinson, 1995).
A positive relationship between SS and SS% is found for all the studied cores, with SS—SS% correlation co-
efficients ranging from 0.69 (core BOB-CS03) to 0.91 (GIT-CS02), SS—SS% slopes of 0.20 (MD04-2842)-0.47
(BOB-CS05) and intercepts at 5.8 (BOB-CS05)-16.2 µm (BOB-CS03) (Figure 2 and Table S3). These results,
together with the comparison of Holocene SS (Table S4) with modern current meter data from the NE Atlan-
tic (McCave et al., 2001; Pingree & Le Cann, 1989) and sedimentary evidence from downcore records (Stow
& Holbrook, 1984), demonstrate that sorting processes at the studied sites are controlled by current flow
dynamics (see Texts S1 and S2). Considering the requirements (“tests”) of McCave and Andrews (2019), 75%
of the SS—SS% data set (794 of 1,055 samples) have a running downcore correlation (Rrun; nine-point) >0.5
and a slope relationship >0.07 (Figure 2 and Figure S6). According to McCave & Andrews' (2019) recom-
mendation, only these data were used for the paleocurrent reconstructions (Figures 4b and 4e).
SS and log (Zr/Rb) ratios show good correlations (0.65 < r < 0.85, n = 794) and are thus used together to
sandy (median grain size up to 150–200 µm), mixed clastic-biogenic MIS 3 contourites at ∼1,000 m depth,
investigate flow speed variability on the French Atlantic slope (Figure 3). However, we did not plot SS for the
both because of the low proportions of the terrigenous sortable silt fraction (13.8 ± 9.3%, n = 150) and be-
cause the current-sorted biogenic component (∼30 wt.% minimum) is not captured by the (carbonate-free)
SS proxy. In such a case, the use of the bulk log (Zr/Rb) ratio (including the detrital sand fraction), circum-
vents the problem of flow speed reconstructions from sandy, shell-rich contourites.
The mean SS and log (Zr/Rb) variabilities at ∼1,000 m are very consistent (in timing and magnitude) from
one site to another (Figure S7). This indicates that each site from the upper slope records a common history
(Zr/Rb) at ∼1,000 m (Figure 4b). The continuous, long-term log (Zr/Rb) records show significant differenc-
of bottom current flow speed changes. Based on this evidence, we produce a composite record for SS and log
es between the upper and mid-slope over the last ∼50 kyr, with values ranging from ∼0.2 to 1.4 at ∼1,000 m
water depth and reaching a maximum of only ∼0.6 at site MD04-2842, at 2,450 m (Figure 4e). This differ-
at both sites for the Holocene (MIS 1; 27.8 ± 2.3 µm [n = 13] and 23.2 ± 1.8 µm [n = 16] at ∼1,000 m and
ence, revealing contourites of coarser texture on the upper slope, is corroborated by the SS data available
2,450 m, respectively; Table S4) and MIS 2 (25.1 ± 3.9 µm [n = 473] and 21.7 ± 2.3 µm [n = 65]]. In addition,
at ∼1,000 m (26.7 ± 3.5 µm [n = 298] for the 30–20 ka interval, with log (Zr/Rb) = 0.60 ± 0.30 [n = 3,146]
at long time scales, the average SS grain size (as well as the log (Zr/Rb) ratio) of glacial (>20 ka) conditions
for the 48–20 ka interval) is statistically indistinguishable from that of the Holocene (27.8 ± 2.3 µm [n = 13],
TOUCANNE ET AL. 7 of 23Paleoceanography and Paleoclimatology 10.1029/2020PA004068
Figure 4. Reconstructions of ocean circulation changes on the French Atlantic margin over the last 50,000 years. (a)
NGRIP δ18O (GICC05 chronology; Rasmussen et al., 2006, 2014; Svensson et al., 2008). (b) Near-bottom flow speed (U)
on the upper slope (∼1,000 m) reconstructed from SS (magenta line, three-point running average) and XRF log (Zr/Rb)
(blue lines; three- and ten-point running average for the 30–0 and 48–30 ka intervals, respectively) composite records.
Note that only the SS(and associated XRF Zr/Rb) data “validated” by McCave & Andrews' (2019) recommendation
are shown (see Section 5.1). The few “validated” data for the Holocene are shown through averages (see Table S4 for
details). MIS 3 data are from core BOB-CS03. (c) Benthic δ13C composite record from the upper slope (black line; three-
point running average) and (benthic) foraminiferal Mn/Ca from core MD99-2328 (green line; Mojtahid et al., 2017).
These data reflect the variability of bottom water ventilation (Figure S8). (d) Uncleaned foraminifera εNd records
from the upper (“stacked” data from BOB-CS03 and BOB-CS05; black line) and middepth cores (MD04-2842; gray
line) (Table S6). The modern range of εNd in the Bay of Biscay (0–3,000 m; Figure S9) is indicated (Copard et al., 2011;
unradiogenic εNd values at ∼20–17 ka (see Section 6.3 for details). (e) Near-bottom flow speed (U) on the middepth slope
Dubois-Dauphin et al., 2017). Local inputs of European Ice Sheet sediment-laden meltwater likely explains the
(2,450 m) reconstructed from SS (magenta line) and XRF Zr/Rb (blue line; three-point running average) data from core
MD04-2842. Yellow bands: Greenland Interstadials (GI). Gray bands: Heinrich Events (HE). Light blue bands: Heinrich
Stadials (HS). See Figures S3 and S4 for their definition in the local stratigraphic records. MIS: Marine Isotope Stage.
TOUCANNE ET AL. 8 of 23Paleoceanography and Paleoclimatology 10.1029/2020PA004068
with log (Zr/Rb) = 0.76 ± 0.07 [n = 13]). On the other hand, SS at site MD04-2842 suggests slightly (though
not statistically significant) higher values during the Holocene (23.2 ± 1.8 µm, n = 16) than during the last
glacial period (21.8 ± 2.1 µm, n = 104). These data indicate more vigorous flow speed on the upper slope
conditions, over the last ∼50 kyr.
(∼1,000 m) while hinting at reduced bottom current strength on the mid-slope (2,450 m) during glacial
At the millennial time scale, bottom current flow speeds at ∼1,000 m are coupled to changes in Greenland
climate as seen in the δ18O ice record (Figures 4a and 4b). This is particularly evident for MIS 3 during which
faster (slower) flow speeds are coeval with D-O interstadials (stadials) (Figure 4b and Figure S8). This re-
lationship is also observed for MIS 2 (including HS2 and the LGM), but we note that during this period the
variability tends to decrease (especially in amplitude). Finally, the flow speed minima at ∼1,000 m occurred
flow speed variability remains as high as for MIS 3 (in amplitude and frequency) while the Greenland δ18O
at ∼19–16.5 ka [log (Zr/Rb) down to ∼0.1], a period encompassing the end of the LGM and the first part of
higher (Zr/Rb ∼0.3–0.4). The IRD-rich layers corresponding to HE4 (∼39 ka) and HE1 (∼16 ka) show high
HS1. The inferred flow speeds reconstructed for the preceding D-O and Heinrich stadials are systematically
log (Zr/Rb) values on the upper slope (while low values characterized HE3 and HE2 at ∼30 ka and ∼24.2
ka, respectively). In the absence of SS data (sensitive to IRD if their concentration is >50%; McCave &
Andrews, 2019), we cannot exclude the possibility that the Zr/Rb peak during HE4 reflects IRD inputs. On
the other hand, the high SS[together with high log (Zr/Rb)] values observed during HE1 likely reflect high
before HE1 (as early as ∼16.5 ka) and persisted until ∼14.7 ka (Figure 4b), and second, by benthic foraminif-
flow speed causing reduced fine deposition. This is supported first by the fact that high flow speed started
era-based proxies showing concomitant well-oxygenated upper slope bottom waters (Mojtahid et al., 2017).
5.2. Bottom-Water Chemistry
Our benthic δ13C data show a large variability of up to ∼0.8–1.0‰ on millennial timescales, with the low-
est δ13C values during HSs (∼0.6–0.8‰ at ∼1,000 m, and ∼0‰ at 2,450 m; Figure S2 and Table S5). The
ice-volume corrected benthic δ18O values (δ18OIVC; see Text S3) at ∼1,000 m show abrupt ∼0.5–1‰ decreases
during the same intervals.
∼1,000 m and −11.3 ± 0.2 (n = 3) at 2,450 m (Figure 4d and Table S6). These εNd values are consistent
Our foraminiferal εNd records reveal core-top (i.e., upper Holocene) signatures of −10.6 ± 0.1 (n = 1) at
with those of modern regional seawater and recent coral data from the French Atlantic margin (Copard
et al., 2011; Dubois-Dauphin et al., 2017) as well as with foraminiferal data from the northern NE Atlantic
(Crocker et al., 2016; Roberts & Piotrowski, 2015). Our results thus capture the modern regional water mass
ues are more radiogenic at both depths (−9.1 ± 0.4 [n = 35] at ∼1,000 m, and −8.9 ± 0.2 [n = 20] at 2,450 m)
structure of the NE Atlantic with MOW overlying well-mixed NADW (Figure S9). Glacial (>20 ka) εNd val-
(Figure 4d), revealing a different paleohydrographic structure for the glacial NE Atlantic.
6. Discussion
6.1. The French Atlantic Margin in the North Atlantic
Our data from the French Atlantic margin suggest little or no changes in average flow speed on the upper
slope (∼1,000 m) at the glacial-interglacial timescale, consistent with NE Atlantic records atPaleoceanography and Paleoclimatology 10.1029/2020PA004068
These sedimentological results agree with an active upper AMOC cell, although vertically contracted, per-
sisting during the last glacial period as previously shown by various, independent geochemical proxies (i.e.,
benthic δ13C, εNd, Cd/Ca, 231Pa/230Th; Boyle & Keigwin, 1987; Curry & Oppo, 2005; Duplessy et al., 1988;
Gherardi et al., 2009; Lippold et al., 2012; Marchitto & Broecker, 2006; Oppo & Lehman, 1993). This is also
cene above ∼2,000 m whereas the opposite is observed below this depth (Figure S2), in agreement with
supported by our benthic δ13C data that show better ventilated waters during the glacial than the Holo-
studies from both the European margin (Crocker et al., 2016; Peck et al., 2006; Willamowski & Zahn, 2000;
Zahn et al., 1997) and the western North Atlantic (Curry & Oppo, 2005; Keigwin, 2004; Lynch-Stieglitz
et al., 2014; Zahn & Stüber, 2002).
The near-stability in the Holocene flow speed at ∼1,000 m (standard deviation of 2.3 for SS and 0.07 for Zr/
Rb) contrasts strikingly with the strong millennial-scale variability of glacial flow speeds (3.5 and 0.3, re-
spectively). This glacial variability shows a remarkable stadial/slower-interstadial/faster pattern correlated
to D-O variability, with flow speed changes >11–14 cm.s−1 according to the calibration relationships for SS
are associated with ∼0.4 to ∼0.8‰ shifts (negative during D-O and Heinrich stadials) in the benthic δ13C
of McCave et al. (2017) (Figure 4b). Most of these rapid changes, and in particular those related to the HSs,
values (Figure 4c). This glacial pattern for the benthic δ13C strongly differs from that recorded at interme-
diate depths (Paleoceanography and Paleoclimatology 10.1029/2020PA004068
Earth's rotation) requires southward-flowing currents in the Northern Hemisphere (including the NSW) to
be channeled toward the west (as is the DWBC today). Therefore, the NSW at the study sites has necessarily
to be recirculated NSW transported eastward by the glacial NAC (GNAC) and ultimately entrained into the
eastern boundary current (as today; Figure 1). Here we argue that the increases in near-bottom flow speeds
recorded on the upper French Atlantic slope reflect the reinforcement of a northward-flowing Glacial East-
ern Boundary Current (GEBC; Figure 5), that is a glacial version of the modern European Slope Current
(Section 2; Figure 1).
6.2.2. Past Vigor of the GEBC: New Constraints on past AMOC Variability
The Northern Hemisphere ice-sheets strongly impacted North Atlantic atmospheric circulation during the
last glacial period (Kageyama & Valdes, 2000; Pausata et al., 2011). At the LGM, the high and extensive
the GNAC to flow zonally and further south than at present (as far south as ∼40°N; Chapman & Shackle-
LIS, located upwind of the ocean basin, forced the mid-latitude jet stream (Löfverström et al., 2014) and
ton, 1998; Keffer et al., 1988; Otto-Bliesner et al., 2006; Pflaumann et al., 2003). During MIS 3, the LIS was
reduced in size relative to the LGM and numerical simulations suggest that the jet stream as well as the
GNAC likely had a southwest-northeast oriented tilt (Löfverström et al., 2014). This pattern is supported
by proxy and modeling evidence that suggest that the polar front in the glacial NE Atlantic, located di-
rectly north of the NAC (Krauss & Käse, 1984), was north of the British Isles during D-O interstadials (Li
et al., 2010; Sadatzki et al., 2019; Scourse et al., 2009) (Figure 5a). However, southward shifts of the polar
front toward mid-latitude Europe (as far south as the northern Iberian Peninsula) occurred during D-O
stadials (Barker et al., 2015; Eynaud et al., 2009; Scourse et al., 2009), pointing out a LGM-like zonal flow
the Azores Plateau showing strong winnowing of fine particles above ∼1,500 m water depth during cold
of the GNAC during those time intervals (Figure 5b). This is supported by sedimentological evidence from
intervals (Dennielou, 1997). These results taken together suggest strong latitudinal shifts in the position of
the GNAC during MIS 3 (Chapman & Shackleton, 1998). Significant changes in the strength of the AMOC
(Böhm et al., 2015; Henry et al., 2016; Waelbroeck et al., 2018), and hence of the North Atlantic SPG, accom-
panied these shifts (e.g., deeper, more vigorous overturning and stronger SPG during the D-O interstadials).
Recent observations suggest that the strength of the SPG (and, by extension, the NAC, which is the eastern
limb of the SPG) controls the vigor of the European Slope Current (Marsh et al., 2017). By analogy with
the modern period, we infer that the changes observed in the SS and Zr/Rb records on the French Atlantic
margin may be related to basin-scale changes in the subpolar North Atlantic, including SPG variability and
associated changes in meridional density gradients (see Section 2). We suggest that the weak flow speed on
the upper slope during the D-O stadials originates from a weak GEBC (Figure 5b). An inflow of the (weak)
GNAC into the Bay of Biscay cannot be excluded. Indeed, the zonal flow of the GNAC in the mid-Atlantic
during stadials (according to reconstructions of the polar front) enables the GNAC to impinge south of
the French Atlantic margin (Brady & Otto-Bliesner, 2011; Keffer et al., 1988). In either cases, the weak
flow speed is indicative of a weak SPG (with corresponding shallow, weak overturning; Henry et al., 2016;
Waelbroeck et al., 2018). On the other hand, during D-O interstadials, the GNAC had a southwest-northeast
oriented tilt and impinged on the European margin north of the French Atlantic margin. Hence, the vigor-
ous flow at the study site probably corresponded to a vigorous GEBC forced by a strong SPG during inter-
stadials (Figure 5a). In simple terms, the interstadial/faster (stadial/slower) pattern of GEBC corresponds
to enhanced (reduced) strength of the GNAC and, by extension, of enhanced (reduced) NSW production
and AMOC during D-O interstadials (stadials). Our SS and Zr/Rb data provide the first record of millen-
nial-scale changes in the strength of the northward AMOC flow, coherent with the changes in convection
rates (Dokken & Jansen, 1999) and NSW export by the AMOC return flow in the western North Atlantic
(Böhm et al., 2015; Henry et al., 2016) over the D-O events (Figures 6b and 6f).
6.3. Ice-Sheet—Ocean Interactions in the NE Atlantic and the AMOC Variability
Our results provide strong physical evidence that the strength of the AMOC varied during the studied sta-
dial-interstadial oscillations (including the subdued GI-5.1), supporting the idea that glacial abrupt climate
changes are associated with AMOC variability (Böhm et al., 2015; Gottschalk et al., 2015; Henry et al., 2016;
TOUCANNE ET AL. 11 of 23Paleoceanography and Paleoclimatology 10.1029/2020PA004068
Figure 5. Schematic of the North Atlantic circulation during D-O interstadials (upper panel) and stadials (lower
panel) of MIS 3. The red and blue continuous arrows indicate the NAC (as the main portion of the upper branch of
the AMOC) and the southward return flow (lower branch) of AMOC, respectively. The Glacial Eastern Boundary
Current (GEBC), that is a glacial version of the modern European Slope Current, is shown (black arrows). The black
dashed lines show plausible scenarios for winter sea ice extent (15% ice concentration), equivalent to the polar front
(Li et al., 2010). The strength of the GEBC is maximal during D-O interstadials. Our hypothesis is that this is due
to enhanced production and export of intermediate-deep waters (NSW) in the northern North Atlantic open-ocean
convection (C) sites (i.e., stronger strength of the subpolar gyre during D-O interstadials compared to D-O stadials).
During D-O stadials, the GNAC would follow the polar front, precluding direct entrance of its main branch into the Bay
of Biscay. During D-O interstadials and stadials, the GEBC is largely recruited from the eastern North Atlantic water
masses (including recirculated NSW; dashed blue arrows). SPG: subpolar gyre. STG: subtropical gyre. BIIS: British-
Irish Ice Sheet (that is the western part of the European Ice Sheet). IIS, Icelandic Ice Sheet; GIS, Greenland Ice Sheet;
LIS, Laurentide Ice Sheet. The labels of the main topographical features are detailed in Figure 1. AMOC, Atlantic
meridional overturning circulation; NAC, North Atlantic Current.
TOUCANNE ET AL. 12 of 23Paleoceanography and Paleoclimatology 10.1029/2020PA004068 TOUCANNE ET AL. 13 of 23
Paleoceanography and Paleoclimatology 10.1029/2020PA004068
McManus et al., 2004; Waelbroeck et al., 2018). Our results also confirm that AMOC weakening (weak
flow speeds) began well before the HEs (Henry et al., 2016; Zahn et al., 1997). This is robustly support-
ed by our core stratigraphy (Figures 4b and 6b). Hence, if HEs may enhance and/or prolong cold stadial
conditions through a positive feedback on the AMOC in response to the addition of freshwater, they were
a consequence of these conditions rather than the cause (Barker et al., 2015; Bond & Lotti, 1995; Boswell
et al., 2019; Clark et al., 2007). This agrees with data and modeling studies showing that HEs likely result
from intermediate depth warming (Alvarez-Solas et al, 2010, 2013; Marcott et al., 2011; Shaffer et al., 2004),
itself resulting from the AMOC weakening that no longer cools the interior of the low-latitude North Atlan-
tic ocean sufficiently (Brady & Otto-Bliesner, 2011; Mignot et al., 2007; Shaffer et al., 2004). A detailed look
at the European side of the North Atlantic may help to decipher the process determining the initial AMOC
weakening.
Data and modeling studies suggest that ice-ocean interactions in the Nordic Seas could explain the D-O var-
iability of MIS 3 (Alvarez-Solas et al., 2019; Dokken et al., 2013; Li et al., 2005, 2010; Rasmussen et al., 1996;
Sadatzki et al., 2019; Wary et al., 2017). The European Ice Sheet (EIS), although restricted to Scandinavia
during MIS 3 (Hughes et al., 2016), participated in these interactions through meltwater and calving (Brend-
ryen et al., 2015; Lekens et al., 2006, 2009) with subsequent changes in buoyancy forcing and Nordic Seas
convection strength (Dokken & Jansen, 1999). The significant changes in the strength of the GEBC, which
ice-ocean interactions. The EIS grew rapidly after ∼35 ka (Hughes et al., 2016) and ice-ocean interactions
was most likely fueling the Nordic Seas convection region as it does today, could reflect this variability in the
extended southward (Peck, Hall, Zahn, Grousset, et al., 2007; Scourse et al., 2009) as far south as ∼50°N
when the marine-terminating Irish Sea Ice Stream (ISIS) advanced into the Celtic Sea at ∼26 ka (Smedley,
Scourse, et al., 2017). Although the southernmost limit of the Baltic Ice Stream in the northern European
EIS meltwater from the continental interior of Europe (through a catchment of ∼2.5 × 10⁶ km2; Patton
lowlands was reached up to 4,000 years later (∼22 ka), the presence of ice in the emerged North Sea allowed
et al., 2017) to reach the NE Atlantic by ∼48°N from ∼30 ka to ∼17–16 ka (Toucanne et al., 2010, 2015). This
ice sheet configuration, together with the pathway of both the GNAC and the GEBC (Figure 5), makes the
western European margin an ideal location to explore the ice-sheet - ocean interactions during the second
part of the last glacial period.
A striking example of ice-sheet—ocean interaction occurred during HS2, from ∼26 ka to 23.2 ka. This
period is characterized in the North Atlantic region by two massive reorganizations of the atmospheric
circulation at 26.0–25.1 ka and 24.2–23.4 ka (known as the “GS-3 dust peaks” in the Greenland ice; Ras-
mussen et al., 2014) separated by a warm SST event described along the western European margin (Austin
et al., 2012; Waelbroeck et al., 2019). This short-lived event, recognized in our cores by a significant decrease
in the N. pachyderma abundance (Figure S4), is coeval with a strong increase in the strength of the GEBC
(Figure 6b). In the British Isles, the HS2 interval corresponds to a regional retreat of the marine ice streams
offshore Ireland (Callard et al., 2018; O'Cofaigh et al., 2019), including the ISIS (Small et al., 2018; Smedley,
Chiverrell, et al., 2017). This retreat occurred in two steps as shown by two discrete pulses in Irish-sourced
IRD recorded on the western European margin (Knutz et al., 2007; Peck, Hall, Zahn, Grousset, et al., 2007;
Scourse et al., 2000, 2009). Their identification on the French Atlantic slope (double IRD and N. pachy-
synchronous with the two GEBC flow speed minima centered at ∼26–25 ka and ∼24–23.5 ka (Figures 6b
derma peaks at site MD95-2002; Grousset et al., 2000) reveals that these two episodes of ice retreat were
and 6c). These decreases in GEBC intensity are coeval (within age uncertainties) with periods of severe
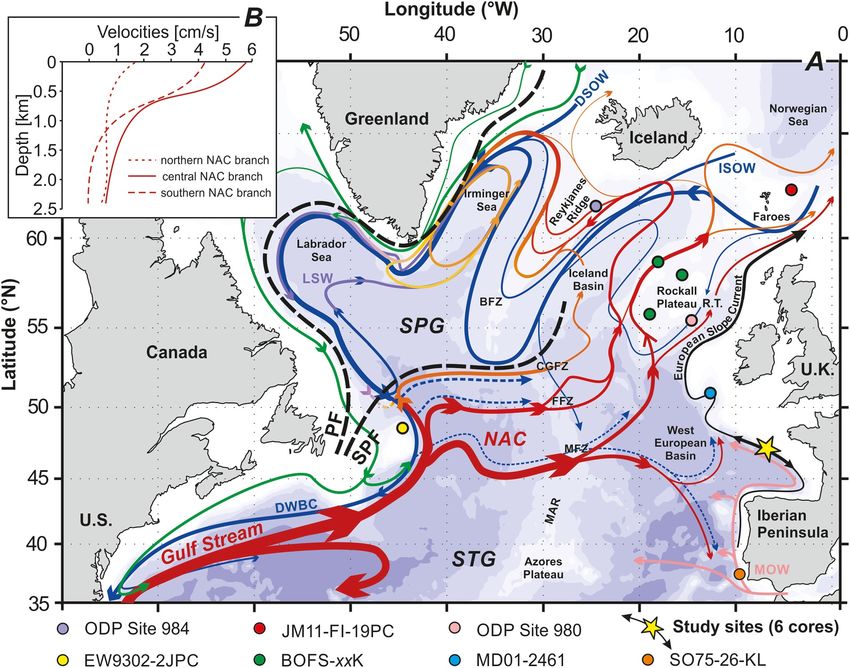
Figure 6. Ice-sheet—ocean interactions and the AMOC variability. (a) NGRIP δ18O and [Ca2+] (GICC05 chronology; Rasmussen et al., 2006, 2014; Svensson
et al., 2008). (b) Near-bottom (∼1,000 m) GEBC flow speed changes reconstructed from the SSand Zr/Rb composite records. (c) Large-scale EIS fluctuations
in the Baltic region (blue rectangles, core MD95-2002; Toucanne et al., 2015) and over the British Isles (green rectangles, core MD01-2461; Peck et al., 2006)
associated to substantial freshwater inputs into the NE Atlantic. Rectangles with a thick border highlight the major events (see the main text for details). (d)
cores MD99-2328, CBT-CS10, BOB-CS03, GIT-CS02, and BOB-CS05, ∼1,000 m depth; see Text S3). Also shown is benthic Mg/Ca data from core MD99-2328
“Stacked” ice-volume corrected benthic (Cibicides sp.) δ18O (δ18OIVC) record (black line; three-point running average) for the upper French Atlantic margin (i.e.,
(green line; Mojtahid et al., 2017). (e) Mg/Ca-based bottom-water temperature (BWT) at ∼1,200 m from the Nordic Seas (JM11-FI-19PC; Ezat et al., 2014) and
the Labrador Sea (EW9302-2JPC; Marcott et al., 2011). (f) Bermuda Rise 231Pa/230Th (blue line, with uncertainties in gray; Böhm et al., 2015; Henry et al., 2016)
and Rockall Trough 231Pa/230Th (orange line; Hall et al., 2006) as a proxy for AMOC export. The vertical black arrows in (a), (b) and (f) refer to the large-scale
EIS fluctuations summarized in (c). Yellow bands: Greenland Interstadials (GI). Light blue bands: Heinrich Stadials (HS). Gray bands: Heinrich Events (HE).
See Figures S3 and S4 for their definition in the local stratigraphic records. MIS: Marine Isotope Stage. AMOC, Atlantic meridional overturning circulation;
GEBC, Glacial Eastern Boundary Current.
TOUCANNE ET AL. 14 of 23Paleoceanography and Paleoclimatology 10.1029/2020PA004068
weakening of NSW export in the deep western North Atlantic (Böhm et al., 2015; Gutjahr & Lippold, 2011)
(Figure 6f). This correlation lends support to the idea that the calving episodes of the ISIS could have weak-
ened the AMOC (Peck et al., 2006; Peck, Hall, Zahn, & Scourse, 2007). However, one could also argue that
the destabilization of the ISIS during HS2 could result from intermediate depth warming, itself resulting
from the AMOC weakening (e.g., Marcott et al., 2011). This subsurface warming is recorded along the Eu-
ropean margin (southern Nordic Seas; Ezat et al., 2014) and suggested in our record as 0.3–0.5‰ decreases
in δ18OIVC (Figures 6d and 6e). Notwithstanding this marine process, the ISIS retreat during HS2 is coeval
with large meltwater inputs into the NE Atlantic (∼26–23 ka) in response to enhanced surface melting of
land-terminating ice-streams of the EIS (western Baltic region; Boswell et al., 2019; Hughes et al., 2016; Tou-
canne et al., 2015). This continental process does not involve an oceanic-warming trigger, but importantly,
the ISIS retreat at ∼26–25 ka. If correct, freshwater inputs from both the western (ISIS) and southern (Bal-
requires summertime warming (Boswell et al., 2019). This atmospheric forcing could explain the onset of
tic) margins of the EIS may explain the initial weakening of AMOC inferred from the reduced strength of
the upper (GEBC, this study) and lower (Böhm et al., 2015) branches of the AMOC (Figures 6b and 6f). In
turn, subsequent subsurface warming could have enhanced the ISIS retreat, while also triggering the HE2
signature recorded in our data at 24.2 ka (i.e., in the youngest flow speed minima; Alvarez-Solas et al., 2010;
Marcott et al., 2011; Shaffer et al., 2004).
the deep western North Atlantic records of Böhm et al., 2015) at ∼30–29 ka (HS3), ∼22–21 ka, ∼20–19
Like for HS2, the AMOC weakening episodes (suggested by both the GEBC records presented here and
ka and ∼18–17 ka (early HS1; Figures 6b and 6f) are coeval with periods of increased EIS melting (Fig-
ure 6c). This is shown by iceberg calving events west of the British Isles (Hall et al., 2011; Knutz et al., 2007;
Peck et al., 2006; Scourse et al., 2009) and the concomitant retreat of the land-terminating ice-streams of
the southern EIS that led to significant meltwater inputs to the NE Atlantic (Eynaud et al., 2012; Ménot
et al., 2006; Toucanne et al., 2015; Zaragosi et al., 2001). The last two melting events are characterized by
thick, fine-grained laminated deposits at the study site due to strong detrital inputs on the margin (Tou-
canne et al., 2010; Zaragosi et al., 2001). The preservation of millimetre-scale laminae, impossible under
high-energy conditions, supports our interpretation for weak GEBC flow speed and AMOC. Concomitantly,
it is likely that enhanced continental inputs would have influenced the Nd isotopic composition of the
water column, through reversible scavenging and/or various sediment-seawater interactions (Jeandel &
Oelkers, 2015; Siddall et al., 2008), thereby explaining the observed foraminiferal εNd shifts toward unradio-
genic values at those times (Figure 4d).
between ∼30 and ∼17 ka emphasizes the role of the EIS on the negative buoyancy forcing in the northern
The tight link observed between EIS melting events (Figure 6c) and AMOC weakening (Figures 6b and 6f)
North Atlantic. This is not surprising given that the meltwater releases discussed above occurred upstream
of the main North Atlantic convection sites (Roche et al., 2010). This idea is reinforced by the fact that the
EIS sediment-laden meltwaters, possibly evolving in the ocean as suspended load-dominated hyperpycnal
flows traveling down the slope (Mulder et al., 2003), should have interacted with the poleward slope cur-
rent (e.g. Miramontes et al., 2020). This would have promoted their direct advection to the Nordic Seas and
reinforced their potential negative buoyancy forcing, leading to a subsequent decrease in AMOC strength.
6.4. Continuous Poleward Oceanic Heat Transport as a Driver for Glacial Climate Instability?
The ice-sheet—ocean interactions described along the western European margin during MIS 2, taken to-
gether with those described in the Nordic Seas during MIS 3 (Dokken et al., 2013; Rasmussen et al., 1996),
identify the NE Atlantic as a key region for the generation of glacial abrupt climate changes. This is ex-
plained by the close proximity of the EIS to the convection sites (Roche et al., 2010), with the upper branch
of the AMOC (i.e., GNAC and GEBC) providing the physical link between the two. On one hand, it “warms”
the EIS by surface advection, triggering freshwater-forced perturbations (warm-to-cold transitions; e.g., Ga-
nopolski & Rahmstorf, 2001). On the other, it carries warm intermediate waters (resulting from freshwa-
ter-forced AMOC weakening) to the subpolar North Atlantic, ultimately promoting AMOC reinvigoration
(cold-to-warm transitions; e.g., Mignot et al., 2007). These warm waters are marked at our sites by 0.3–1‰
decreases in δ18OIVC and increased Mg/Ca ratio (Mojtahid et al., 2017, Figure 6d). It is worth noting that
our data as well as those from the deep western North Atlantic suggest that a vigorous, although variable,
TOUCANNE ET AL. 15 of 23You can also read