The influence of laser characteristics on internal flow behaviour in laser melting of metallic substrates
←
→
Page content transcription
If your browser does not render page correctly, please read the page content below
The influence of laser characteristics on internal flow behaviour in
                                                                 laser melting of metallic substrates

                                                        Amin Ebrahimi1,† , Mohammad Sattari2 , Scholte J.L. Bremer2 , Martin Luckabauer2 ,
                                                   Gert-willem R.B.E. Römer2 , Ian M. Richardson1 , Chris R. Kleijn3 , and Marcel J.M. Hermans1
                                                           1
                                                            Department of Materials Science and Engineering, Faculty of Mechanical, Maritime and
arXiv:2201.02614v1 [physics.flu-dyn] 5 Jan 2022

                                                     Materials Engineering, Delft University of Technology, Mekelweg 2, 2628CD Delft, The Netherlands
                                                        2
                                                          Department of Mechanics of Solids, Surfaces and Systems, Faculty of Engineering Technology,
                                                                 University of Twente, Drienerlolaan 5, 7522NB Enschede, The Netherlands
                                                     3
                                                       Department of Chemical Engineering, Faculty of Applied Sciences, Delft University of Technology,
                                                                             van der Maasweg 9, 2629HZ Delft, The Netherlands
                                                                        †
                                                                          Corresponding author: A.Ebrahimi@tudelft.nl (A. Ebrahimi)

                                                                                                     Abstract
                                                            The absorptivity of a material is a major uncertainty in numerical simulations of laser welding
                                                        and additive manufacturing, and its value is often calibrated through trial-and-error exercises.
                                                        This adversely affects the capability of numerical simulations when predicting the process
                                                        behaviour and can eventually hinder the exploitation of fully digitised manufacturing processes,
                                                        which is a goal of “industry 4.0”. In the present work, an enhanced absorption model that
                                                        takes into account the effects of laser characteristics, incident angle, surface temperature, and
                                                        material composition is utilised to predict internal heat and fluid flow in laser melting of stainless
                                                        steel 316L. Employing such an absorption model is physically more realistic than assuming
                                                        a constant absorptivity and can reduce the costs associated with calibrating an appropriate value.
                                                        High-fidelity three-dimensional numerical simulations were performed using both variable and
                                                        constant absorptivity models and the predictions compared with experimental data. The results
                                                        of the present work unravel the crucial effect of absorptivity on the physics of internal flow in
                                                        laser material processing. The difference between melt-pool shapes obtained using fibre and CO2
                                                        laser sources is explained, and factors affecting the local energy absorption are discussed.

                                                  Keywords: Laser melting, laser beam absorption, melt pool behaviour, welding and additive
                                                  manufacturing, numerical simulation

                                                  Preprint submitted to Materials & Design                1                                                      2022
1    Introduction
Laser-beam melting of metallic substrates forms the basis of many advanced fusion-based manufac-
turing processes (such as laser welding, laser cladding, laser metal deposition (LMD), and selective
laser melting (SLM)) and has brought new perspectives on advancement of materials processing and
manufacturing of high-integrity products. Successful adoption of laser-beam melting in real-world
engineering applications requires finding processing windows within which the product quality
should meet the intended standards [1]. However, determining the processing window through
trial-and-error experiments is challenging and involves significant costs due to the large number
of process parameters and the coupling between various physical phenomena. Simulation-based
approaches have been recognised as a promising alternative to costly and time-inefficient experiments
and can be utilised to reduce the costs of design-space exploration [2, 3]. Moreover, numerical
simulations can enhance our understanding of the complex transport phenomena in laser material
processing that are not easily accessible through experiments [4, 5].
    Successful adoption of simulation-based approaches for process development and optimisation
relies predominantly on adequate modelling of various physical phenomena that occur during laser
melting (e.g. laser-matter interaction, heat and fluid flow, and solid-liquid phase transformation) [6].
Assumptions made to develop computational models often affect their reliability, accuracy and
performance in predicting and describing the process behaviour. For instance, studies suggest that
melt-pool surface deformations affect power-density distribution, leading to changes in the thermal
field, Marangoni flow pattern and the melt-pool shape [7–9]. Conversely, previous investigations [10–
13] have shown a considerable influence of laser characteristics and power-density distribution on
molten metal flow behaviour in laser welding and additive manufacturing. Thus, there seems to
be an important bi-directional coupling between laser power-density distribution and melt-pool
behaviour. Neglecting such effects in numerical simulations of laser-beam melting can negatively
affect the quality of numerical predictions of thermal fields, microstructures and properties of
the product [8, 14]. Moreover, assumptions made to develop a computational model may necessitate
the incorporation of unphysical tuning parameters to obtain agreement between numerical and
experimental data [8, 15]. This can reduce the model reliability for design-space explorations
since a change in process parameters or material properties may require recalibrating the tuning
parameters [16, 17]. Understanding the influence of such assumptions on numerical predictions is
therefore essential and can guide the modelling efforts to enhance the current numerical simulations.
    Absorption of laser-energy, energy-density distribution and its variation over time are critical
components influencing the modelling of laser-beam melting [18] and depend on a variety of process
parameters including the characteristics of the laser system (e.g. laser intensity and wavelength),
thermophysical properties of the material, surface roughness and chemistry, and interactions of
the melt-pool surface with the laser beam [19–22]. In the majority of previous studies on laser-beam
melting, the absorption of laser energy is assumed to be constant [13], neglecting the unsteady

                                                   2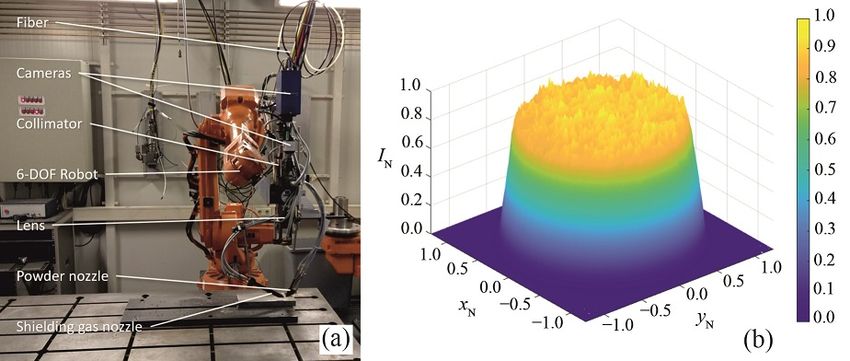
interactions between laser-beam and material surface [23]. Studies have shown that changes in melt-
pool surface morphology and temperature can affect the local absorptivity of the material [10, 24–26].
The Fresnel absorption model [27], which is commonly employed in numerical simulations of laser
melting (particularly when the ray-tracing method is used), accounts for the effects of laser-ray
incident angle and material refractive index, but neglects the temperature dependence of material
absorptivity [20]. In laser melting of metallic substrates, the material often experiences large
changes in temperature that can significantly affect the thermophysical properties of the material,
including the material absorptivity [28, 29]. Moreover, the complex molten metal flow in melt-pools
continuously disturbs temperature distribution over the surface [8], affecting the local absorptivity
of the material. The Fresnel model cannot reflect the variation of local energy absorption that
occurs due to changes in melt-pool surface temperature [12, 30, 31]. Hence, the Fresnel model
cannot describe variations in material absorptivity with sufficient accuracy, particularly in cases
where the melt-pool surface deformations are small compared to the melt-pool depth (for instance,
laser cladding, conduction-mode laser welding and laser metal deposition).
    Realising that in practical applications the laser type is not a control parameter, as commercial
machines come with a fixed laser type, the present work focuses on understanding the influence of laser
characteristics on complex heat and molten metal flow in laser-beam melting. Such an understanding
allows us to explain, for example, the difference between melt-pool shapes obtained using fibre
transmissible and CO2 lasers (i.e. the most widely employed lasers for industrial applications).
High-fidelity three-dimensional numerical simulations are performed using an enhanced laser-beam
absorption model that takes into account the effects of laser characteristics, surface temperature,
incident angle and base-material composition. The results obtained using the enhanced absorption
model for different laser systems and laser powers are compared with those obtained using a constant
absorptivity and factors affecting the local energy absorption are discussed. Additionally, experiments
are carried out for different laser powers to validate the melt-pool shapes predicted using the present
computational model. The results and discussions provided in the present work guide the modelling
efforts to improve simulations of fusion-based welding and additive manufacturing.

2    Problem description
As shown in figure 1, a moving laser beam is employed to locally heat and melt the substrate that
is made of a stainless steel alloy (AISI 316L) and is initially at an ambient temperature of 300 K.
The gas layer above the plate is included in simulations to track the motion of gas-metal interface.
The influence of laser characteristics on melting of a metallic substrate is studied numerically for fibre
and CO2 lasers, whose wavelengths are different. The laser beam is perpendicular to the substrate
surface and has a Gaussian intensity profile.
    Three batches of three-dimensional numerical simulations are executed for different laser types
and powers using both constant and variable absorptivity models to describe the complex thermal and

                                                    3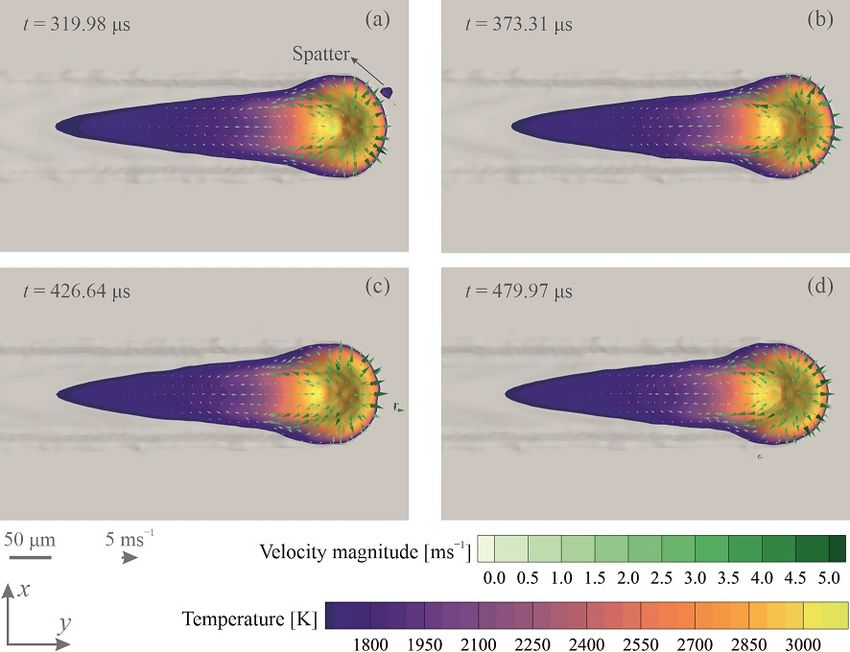
Figure 1: Schematic of laser melting, dimensions of the computational domain and the mathematical expressions
used for the boundary conditions. Parts of the gas layer are clipped for visualisation.

fluid flow fields in the melt pool. For cases where the absorptivity is assumed to be constant, different
values of the absorptivity are examined, as reported in table 1. The dimensions of the computational
domain defined in a Cartesian coordinate system, and the boundary conditions applied to the outer
boundaries, are shown in figure 1. Heat input from the laser, heat losses due to convection, radiation
and vaporisation, as well as forces acting on the melt pool (i.e. Marangoni shear force, capillary
force, and recoil pressure) are implemented in the simulations by adding source and sink terms to
the governing equations, as described in section 3. Although the thermal buoyancy force is often
negligible compared with Marangoni force in driving the molten metal flow in laser melting [8],
a variable density model is employed in the present work to account for thermal buoyancy force
as well as the solidification shrinkage. Temperature-dependent material properties are employed
for both the solid and the molten metal in the present numerical simulations and the values are

                                                     4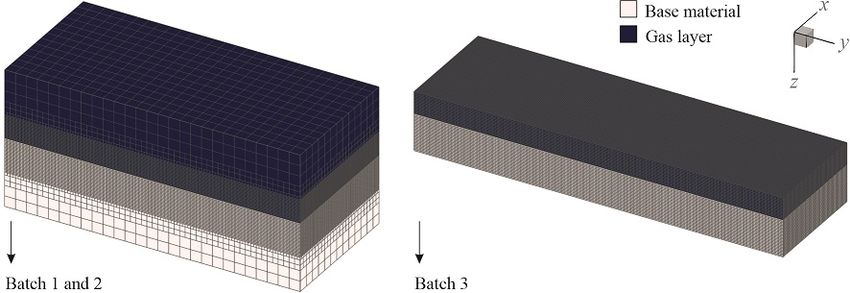
reported in table 2 and figure 2. Although the properties of argon are also temperature-dependent,
they have been assumed to be constant in the present work for the sake of simplicity, see table 2.
This assumption is made based on the fact that the density, viscosity and thermal conductivity of
argon are very small compared to those of the metal, therefore variations of those gas properties
with temperature have negligible influence on the numerical predictions [32].

                     Table 1: Summary of the process parameters studied in the present work.

      Parameter                           Batch 1                        Batch 2          Batch 3
      Laser type                          CO2 laser                      Nd:YAG laser     Fibre laser a
      Laser power P [W]                   900–2100 (interval: 300)       500–900 (100)    200
      Wavelength λ [m]                    1.060 × 10⁻⁵                   1.064 × 10⁻⁶     1.070 × 10⁻⁶
      Constant absorptivity a [–]         0.10–0.14 (0.02) and 0.18      0.3–0.4 (0.05)   0.3–0.4 (0.05)
      Travel speed V [m s−1 ]             10−2                           10−2             1.5
      Spot size (D4σ) db [m]              2 × 10⁻³                       2 × 10⁻³         1.1 × 10⁻⁴
      Interaction time ti = db /V [s]     0.2                            0.2              7.3 × 10⁻⁵

       a
           continuous wave fibre laser (YLR-500-AC, IPG Photonics) [1]

                           Table 2: Material properties employed in the present work.

       Property                                      Stainless steel (AISI 316L)     Gas (argon) [33]
       Density ρ [kg m−3 ]                           see figure 2                    1.623
       Specific heat capacity cp [J kg−1 K−1 ]       see figure 2                    520.64
       Thermal conductivity k [W m−1 K−1 ]           see figure 2                    1.58 × 10⁻²
       Dynamic viscosity µ [kg m−1 s−1 ]             see figure 2                    2.12 × 10⁻⁵
       Molar mass M [kg mol−1 ]                      5.58 × 10⁻² [34]                3.9948 × 10⁻²
       Latent heat of fusion Lf [J kg−1 ]            2.7 × 10⁵ [34]                  –
       Latent heat of vaporisation Lv [J kg−1 ]      7.45 × 10⁶ [35]                 –
       Solidus temperature Ts [K]                    1658 [34]                       –
       Liquidus temperature Tl [K]                   1723 [34]                       –
       Boiling temperature Tb [K]                    3086 [36]                       –

                                                        5
Figure 2: Temperature-dependent properties of stainless steel 316L. (a) density [37], (b) specific heat capacity [34],
(c) thermal conductivity [34], (d) electrical resistivity [38] (e) surface tension [39] and (f) dynamic viscosity [37].

3     Methods
3.1     Model formulation
The present computational model is developed on the basis of the finite-volume approach and utilises
the volume-of-fluid (VOF) method [40] to locate the gas-metal interface. It is assumed that both
the molten metal and argon are Newtonian fluids and that their densities are pressure-independent.
Based on these assumptions, the governing equations for conservation of mass, momentum and
energy as well as for the advection of the scalar function φ, which represents the local volume-fraction
of the steel phase in a computational cell, are defined as follows:

                                                Dρ
                                                   + ρ (∇ · u) = 0,                                                (1)
                                                Dt

                                            Du
                                        ρ      = µ∇2 u − ∇p + Fd + Fs ,                                            (2)
                                            Dt

                                                          6
Dh  k         D (ψLf )
                                ρ      = ∇2 h − ρ          + Sq + Sl ,                                (3)
                                    Dt  cp          Dt

                                                 Dφ
                                                    = 0.                                              (4)
                                                 Dt
Here, ρ is the density, t the time, u the fluid velocity vector, µ the dynamic viscosity, p the pressure,
h the sensible heat, k the thermal conductivity, cp the specific heat capacity, and (ψLf ) the latent heat
with ψ being the local liquid volume-fraction and Lf the latent heat of fusion. It is assumed that
the liquid volume-fraction ψ varies linearly with temperature [41], and its value is calculated as
follows:

                                            T − Ts
                                       ψ=           ;       Ts ≤ T ≤ Tl .                             (5)
                                            Tl − Ts
The effective material properties in computational cells were computed as follows:

                                          ξ = φ ξm + (1 − φ) ξg ,                                     (6)

where, ξ corresponds to density ρ, specific heat capacity cp , thermal conductivity k or viscosity µ,
and subscripts ‘m’ and ‘g’ indicate metal or gas respectively.
   Fd is a sink term incorporated into equation (2) to damp fluid velocities in the mushy region and
to suppress them in solid regions, and is defined based on the enthalpy-porosity technique [42] as

                                                        (1 − ψ)2
                                          Fd = −C                u,                                   (7)
                                                         ψ3 +
where, C is the permeability coefficient (also known as the mushy-zone constant) and  is a constant,
equal to 10−3 , employed to avoid division by zero. The value of the permeability coefficient C was
set to 107 kg m−2 s−2 , based on the criteria proposed by Ebrahimi et al. [43].
   A continuum surface force model [44] is used to model forces acting on the gas-metal interface
(i.e. capillary force, Marangoni shear force and recoil pressure). Accordingly, the source term Fs is
incorporated into equation (2) as follows:

                                                              2ρ
                                          Fs = fs k∇φk              ,                                 (8)
                                                            ρm + ρg
where, fs is the surface force applied to a unit area, and the term 2ρ/(ρm + ρg ) is included to
redistribute the surface-forces towards the heavier phase. The surface force fs is determined as
follows:

                                                        7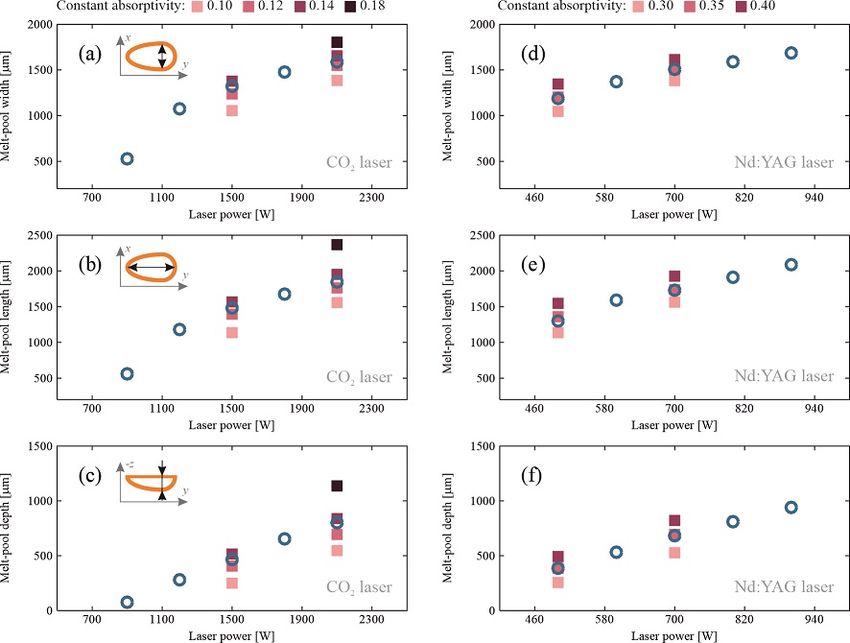
fs = fcapillary + fMarangoni + fPrecoil
                         dγ

                                                                   Lv M (T − Tb )
                                                                                                         (9)
                = γκn̂ +    [∇T − n̂ (n̂ · ∇T )] + 0.54 · p0 exp                     n̂.
                         dT                                            R T Tb

where, γ is the surface tension, n̂ the surface unit normal vector (n̂ = ∇φ/k∇φk), κ the surface
curvature (κ = ∇ · n̂), p0 the ambient pressure, and R the universal gas constant. The third term
on the right-hand side of equation (9), fPrecoil , is included to model the recoil pressure generated
due to vaporisation of the molten metal [45, 46].
   The source Sq and the sink term Sl are incorporated into equation (3) to model the laser heat
input to the material and heat losses from the material due to convection, radiation and vaporisation
respectively, and are defined as follows:

                                                     −2 R 2

                                     2a P                                     2 ρ cp
                       Sq = Fq             exp                    k∇φk                       ,            (10)
                                      πrb2            rb2              (ρ cp )m + (ρ cp )g

                                                                                         2 ρ cp
                Sl = − (Sconvection + Sradiation + Svaporisation ) k∇φk                               .   (11)
                                                                                  (ρ cp )m + (ρ cp )g
Here, a is the absorptivity, P the laser power, rb the radius of the laser beam, R the radial distance
from the laser-beam axis in x-y plane, and

                                         Sconvection = hc (T − T0 ) ,                                     (12)

                                        Sradiation = Kb E T 4 − T0 4 ,

                                                                                                          (13)


                                                 Lv M                        Lv M (T − Tb )
                     Svaporisation   = 0.82 · √         p0 exp                                    ,       (14)
                                                2πM R T                          R T Tb
where, T0 is the ambient temperature, Kb the Stefan-Boltzmann constant, and hc and E are the heat
transfer coefficient and the radiation emissivity equal to 25 W m−2 K−1 [47] and 0.45 [48] respectively.
Compared to the total laser energy absorbed by the material, the heat losses from the material due
to convection and radiation are quite small; thus, the precise values of hc and E are not critical
in the present simulations. The coefficient 0.82 in equation (14) is included based on Anisimov’s
theory [45] to account for the reduced cooling effect due to metal vapour condensation.
   In the VOF method, the energy fluxes applied to the material surface are included as volumetric
source terms in the computational cells that encompass the melt-pool surface (i.e. cells with
0 < φ < 1). Hence, melt-pool surface deformations that occur during the process can result in
an increase in the total heat input to the material [8]. Fq in equation (10) is a dynamic adjustment
factor introduced to abate artificial increase in energy absorption due to surface deformations and is

                                                          8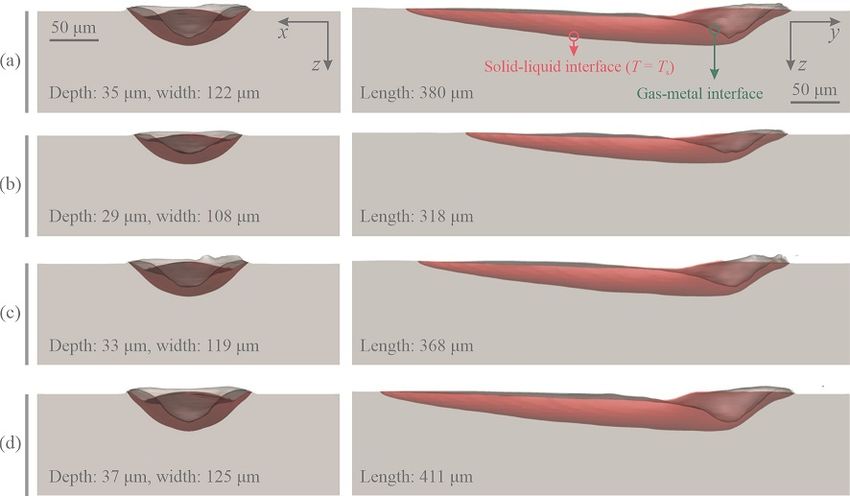
defined as
1
Fq = ˝ 2ρcp
, (15)
k∇φk (ρ cp )m +(ρ cp )g dV
∀
where, “∀” indicates the computational domain. The influence of utilising such an adjustment factor
on numerical predictions of molten metal flow in laser melting is explained by Ebrahimi et al. [8].
3.1.1 Absorptivity model
When a laser beam with total energy of P interacts with material, here stainless steel 316L, part
of its energy is absorbed by the material for a fraction equal to its absorptivity (a). Numerical
simulations developed for laser welding and additive manufacturing commonly assume the ab-
sorptivity to be constant [36], which is physically unrealistic, and its value is often regarded as
a calibration parameter [13]. The absorptivity should be considered as a material property and
not a calibration parameter [13]. In the present work, the amount of laser energy absorbed by
the material was modelled according to the absorptivity model proposed by Yang et al. [13] and
Mahrle and Beyer [11], which takes into account the effects of laser characteristics, laser-ray incident
angle, surface temperature and base-material composition. Accordingly, the absorptivity a for
circularly polarised or un-polarised laser radiation was approximated as follows [49]:
Rs + Rp
a =1− , (16)
2
where, according to the Fresnel’s reflection equations, Rs and Rp are the reflectance for parallel and
perpendicularly polarised light [25] defined as
α2 + β 2 − 2α cos(θ) + cos2 (θ)
Rs = , (17)
α2 + β 2 + 2α cos(θ) + cos2 (θ)
α2 + β 2 − 2α sin(θ) tan(θ) + sin2 (θ) tan2 (θ)
Rp = Rs . (18)
α2 + β 2 + 2α sin(θ) tan(θ) + sin2 (θ) tan2 (θ)
Here, θ is the incident angle of the laser ray, and α and β are functions of the refractive index n and
the extinction coefficient k of the irradiated material. The values of α, β, n and k were determined
as follows [13]:
q 2 1
2
n2 − k2 − sin (θ) + 4n2 k 2 + n2 − k 2 − sin2 (θ)
2
α= , (19)
2
9
q 2 12
2 2
n2 − k2 − sin (θ) + 4n2 k 2 − n2 + k2 + sin (θ)
β= , (20)
2
q 12
2 2
er + ei + er
n= , (21)
2
q 12
er2 + ei2 − er
k= , (22)
2
where, er and ei are the real and imaginary parts of the relative electric permittivity ẽ respectively [50],
defined as
ωp2
er = 1 − , (23)
f2 + δ 2
δ ωp2
ei = . (24)
f f2 + δ 2
Here, ωp , f and δ are the plasma frequency, laser frequency and damping frequency respectively,
defined as follows [11, 13]:
s
Ne q2e
ωp = , (25)
Me v0
2π c
f= , (26)
λ
δ = ωp2 v0 RT , (27)
where, Ne is the mean number density of free electrons (the value of which approximately equals to
5.83 × 1029 m−3 for stainless steel 316L [13]), qe the elementary electric charge, Me the electron rest
mass, v0 the electric constant, c the speed of light in vacuum, λ the emission wavelength of the laser,
and RT the temperature-dependent electrical resistivity. The values approximated using the present
absorptivity model for stainless steel 316L are presented in figure 3, showing the influence of laser
emission wavelength, incident angle and temperature on the absorptivity. The data shown in figure 3
suggest that the incident angle of the laser ray θ negligibly affects the absorptivity up to 40◦ but its
effect becomes significant for larger incident angles (for instance, in cases where a keyhole is formed).
Additionally, changes in the temperature notably affect absorptivity, making the assumption of
constant absorptivity questionable.
10Figure 3: The effects of laser emission wavelength λ, temperature and incident angle of the laser ray θ on
the absorptivity of stainless steel 316L. Values are obtained from the absorptivity model described in section 3.1.1.
(a and b) CO2 laser with λ = 1.060 × 10⁻⁵ m and (c and d) Nd:YAG laser with λ = 1.064 × 10⁻⁶ m. Dashed lines
indicate the constant absorptivities studied in the present work.
3.2 Numerical implementation
The present numerical simulations were constructed on the foundation of a proprietary flow solver,
ANSYS Fluent [51]. User-defined functions (UDFs) programmed in the C programming language
were developed to implement the absorptivity model, source and sink terms in the momentum
and energy equations as well as the surface tension model in the simulations. As shown in our
previous works [3, 8, 9, 52, 53], the numerical grid cell spacing should be chosen to have at least 35
cells in the melt pool region along its width. Accordingly, hexahedral cells were used to discretise
the computational domain with minimum cell spacing of 50 µm for cases in batch 1 and 2 (CO2 and
Nd:YAG welds, melt-pool widths of about 1500 µm), and 3 µm for cases in batch 3 (continuous wave
fibre laser welds, melt-pool widths of about 100 µm), as shown in figure 4. Accordingly, the total
number of computational cells is about 1.2 × 10⁶ for cases in batch 1 and 2, and about 1.0 × 10⁶ for
cases in batch 3.
The central differencing scheme with second-order accuracy and a first-order implicit scheme
were employed for spatial discretisation and time marching respectively. A fixed time-step size ∆t
was used in the simulations and its value was chosen sufficiently small (10−8 s < ∆t < 10−5 s) to
achieve a Courant number (Co = kuk∆t/∆x) less than 0.2. The PRESTO (pressure staggering
option) scheme [54] was used for the pressure interpolation, and the PISO (pressure-implicit with
11Figure 4: The computational meshes employed in the present work.
splitting of operators) scheme [55] was used to couple velocity and pressure fields. An explicit
compressive VOF method [56] was employed to formulate the advection of the scalar field φ. Each
simulation was run in parallel on 16 cores (AMD EPYC 7452) of a high-performance computing
cluster with 256 GB memory.
3.3 Experimental setup and procedure
The experimental setup employed in the present work is shown in figure 5. An Yb:YAG disk laser
(Trumpf TruDisk 10001) that was connected to a fibre with a core diameter of 6 × 10⁻⁴ m was
employed. The fibre transports the laser light towards the focusing optics (Trumpf BEO D70),
consisting of a 200 mm collimator and 400 mm focusing lens. The focusing optics are mounted to
a 6-DOF robot (ABB IRB-2600M2004). Using this setup, a laser spot with a diameter of 1.2 mm and
a top-hat power-density distribution was produced (see figure 5(b)). Melting tracks with a length of
80 mm were made on an AISI 316L plate with dimensions of 250 mm × 100 mm × 10 mm. The travel
speed was set to 20 mm s−1 . The melt pool was protected from oxidation during the process using
argon gas at a flow rate of about 20 L/ min. Each experiment was repeated at least three times to
ensure that the results are reproducible. The samples were cut transversely, polished and etched to
capture macrographs using a digital microscope (Keyence VHX 7000). A solution of 100 mL HCl,
100 mL H2O and 10 mL NHO3 with a temperature of about 310 K was used for etching the samples.
12Figure 5: (a) The experimental setup employed in the present work. (b) Power-density distribution produced using
the present experimental setup. In subfigure (b), the power-density profile is normalised with the respective maximum
peak, and coordinates are non-dimensionalised using the laser-beam radius rb .
4 Results and discussion
4.1 Model validation
The reliability and accuracy of the present computational model are examined by comparing
the numerically predicted melt-pool shapes with those obtained from experiments with different
laser systems, laser powers and power-density distributions. To visualise the melt-pool shapes,
cross-sectional macrographs were prepared ex situ after experiments and iso-surfaces of solidus
temperature were projected on the x-z plane after numerical simulations. It should be noted that
the numerical results were obtained using the variable absorptivity model described in section 3.1.1
without calibration. Figure 6 shows a comparison between the melt-pool shapes obtained from
the present computational model with those obtained from experiments using an Yb:YAG laser
(λ = 1.030 × 10⁻⁶ m) and different laser powers, which indicates a reasonable agreement (generally
less than 5% difference in melt-pool dimensions).
The characteristics of the laser system used in laser melting can affect the absorptivity and hence
can change the resulting melt-pool shape. The results of the present computational model are also
benchmarked against the experimental data reported by Kell et al. [57] for laser melting of a 1 mm-
thick steel plate using a CO2 laser (λ = 1.060 × 10⁻⁵ m) with the energy-density (E = P/(Vdb ))
being set to 120 MJ m−2 , and the results are shown in figure 7. To compare the numerically
predicted melt-pool shape with experimental measurements, the relative difference between melt-
pool dimensions (i.e. the melt-pool width and depth) was calculated as follows:
13Lnumerical − Lexperimental
%Deviation = × 100, (28)
Lexperimental
where, L indicates the melt-pool depth and width. In this case, the deviation between the numerically
predicted and the experimentally measured melt-pool dimensions is less than 2%, demonstrating
the reliability of the present computational model in predicting the melt-pool shape. The deviation
between the numerical and experimental results can be attributed to uncertainties in modelling
temperature-dependent material properties, particularly in the liquid phase, the assumptions made
to develop the present computational model as well as uncertainties associated with the experimental
measurements.
Figure 6: Numerically predicted melt-pool shapes obtained from the present computational model (left column,
regions shaded in pink) compared with the experimental macrographs (right column, circles and dashed lines). The base
material is stainless steel 316L. An Yb:YAG laser (λ = 1.030 × 10⁻⁶ m) was used, the laser beam had a top-hat
power-density distribution, the spot size db was 1.2 mm and travel speed V was set to 20 mm s−1 . The energy-density
(E = P/(Vdb )) ranges between 12.5 MJ m−2 and 29.2 MJ m−2 .
14Figure 7: Comparison of the melt-pool shapes obtained from the present computational model (regions shaded in
pink) with the experimental measurements of Kell et al. [57] (circles and dashed line). (a) Circular laser beam with
a Gaussian power-density distribution and a spot size (D4σ) of db = 1.25 mm, and (b) Square-shaped laser beam with
a top-hat power-density distribution and a spot size of db = 1.25 mm. The base material is stainless steel 316L. A CO2
laser (λ = 1.060 × 10⁻⁵ m) was used and the energy-density (E = P/(Vdb )) was set to 120 MJ m−2 for both cases.
4.2 Melt-pool shape and dimensions
To be able to systematically study the effects of laser characteristics and melt-pool surface deforma-
tions on variation of local absorptivity, three batches of simulations are considered for different laser
types. For cases in batch 1 and 2, the power density is too low to cause significant vaporisation and
surface deformations are small compared to the melt-pool depth. Thus, changes in the absorptivity
for a specific laser and material can be attributed primarily to changes in surface temperature.
The laser spot size for the cases in batch 3 is intentionally chosen smaller than that for the cases
in batch 1 and 2 to achieve high values of power-density, resulting in significant vaporisation of
the material and melt-pool surface deformations compared to its depth. For all three batches,
the results obtained using the enhanced absorption model are compared with those obtained using
a constant absorptivity. Figure 8 shows the numerically predicted melt-pool dimensions obtained
for different laser powers using CO2 and Nd:YAG lasers (i.e. cases in batch 1 and 2). The melt-pool
dimensions obtained using the variable absorptivity model are compared with those obtained using
different constant values of the absorptivity. For cases in batch 1 and 2, the power density is too
low to cause significant vaporisation and surface deformations are small compared to the melt-pool
depth. Thus, changes in the absorptivity for a specific laser and material can be attributed primarily
to changes in surface temperature (see figure 3).
For the cases where the CO2 laser was employed (figure 8(a–c)), melt-pool dimensions predicted
using a constant absorptivity between 0.12 and 0.14 seem to agree with those obtained using
the variable absorptivity model. However, the results suggest that employing a constant absorptivity
does not necessarily render all the melt-pool dimensions with the same level of accuracy, which means
the results are less reliable with respect to those obtained using the variable absorptivity model.
This can be attributed to the fact that changes in local energy absorption due to changes in surface
temperature, and changes in total energy absorption over time are both neglected when a constant
absorptivity is employed. Surface temperature in the spot region after reaching a quasi-steady-state
15Figure 8: Melt-pool dimensions obtained from the present computational model using variable absorptivity (circles)
and constant absorptivity (squares) for different laser powers and laser systems ((a–c) CO2 laser (λ = 1.060 × 10⁻⁵ m)
and (d–f) Nd:YAG laser (λ = 1.064 × 10⁻⁶ m)). Travel speed V was set to 10−2 m s−1 for all the cases.
condition for CO2 laser melting with a laser power of P = 2100 W ranges between 1900 K and 2650 K,
resulting in absorptivities that range between 0.130 and 0.136 according to the variable absorptivity
model and in agreement with the results shown in figure 8(a–c). Although a good agreement between
numerical and experimental melt-pool dimensions might be achievable using a constant absorptivity
model, the use of a constant absorptivity requires a posteriori fitting of the absorptivity value to
the experiments, whereas such a fitting is not required employing the variable absorptivity model
described in section 3.1.1.
The results shown in figure 8 suggest that for a certain set of process parameters, a lower
laser power is required to obtain a melt-pool with similar dimensions using an Nd:YAG laser with
an emission wavelength of λ = 1.064 × 10⁻⁶ m than a CO2 laser with an emission wavelength of
λ = 1.060 × 10⁻⁵ m. This arises because the absorptivity for a CO2 laser is generally lower than
that for an Nd:YAG laser when the incident angle is too small to affect the absorptivity significantly
16(θ < 40◦ , as is suggested by the data shown in figure 3), which is the case in conduction-mode laser
melting. For the cases where the Nd:YAG laser was employed (figure 8(d–f)), using a constant
absorptivity of 0.35 can render the melt-pool dimensions with a reasonable resolution. When
an Nd:YAG laser with a laser power of P = 700 W is employed, numerically predicted surface
temperature in the spot region after reaching a quasi-steady-state condition ranges between 1900 K
and 2600 K. For this temperature range, the absorptivity varies between 0.347 and 0.36 according to
the variable absorptivity model, and its arithmetic average 0.354 is close to 0.35. Since the melt-pool
surface temperature and its distribution are not known a priory and are significantly influenced by
the process parameters as well as the complex internal molten metal flow, running trial-and-error
tests is indispensable to calibrate the value of constant absorptivity. Running such trial-and-error
tests increases the total costs of computational analyses and such ad hoc calibration often lacks
generality.
Figure 9 shows the numerically predicted melt-pool shapes obtained using both variable and
constant absorptivity models for a fibre laser with an emission wavelength of λ = 1.070 × 10⁻⁶ m
(i.e. cases in batch 3). The power density for the cases in batch 3 is relatively high, resulting in
significant vaporisation of the material and melt-pool surface deformations compared to its depth.
In contrast to the cases in batch 1 and 2, the absorptivity for the cases in batch 3 are affected by
both temperature and incident angle of the laser ray (see figure 3).
The results presented in figure 9 show an agreement between the melt-pool dimensions predicted
using a constant absorptivity of 0.35 and those obtained using the variable absorptivity model.
For the cases in batch 3, surface temperature in the laser spot region ranges roughly from 800 K
(because of the relatively high travel speed, the material is in the solid state in front part of the laser
spot region) to the boiling temperature of 3086 K corresponding to absorptivities between 0.30 and
0.37 (with an arithmetic average of 0.335) based on the variable absorptivity model for θ = 0◦ .
Demonstrably, reducing the absorptivity from 0.35 to 0.335 decreases the total amount of energy
absorbed by the material, resulting in smaller melt-pool dimensions than those predicted using
the variable absorptivity model. The increase in local energy absorption due to the increase in
temperature and laser incident angle is neglected when a constant absorptivity model is employed.
For the cases in batch 3, the incident angle of the laser ray θ increases from 0◦ to 50◦ with melt-pool
surface depression, resulting in an increase in the local energy absorption according to the variable
absorptivity model and in turn increases the melt-pool surface temperature, which leads to further
increase in absorptivity. Eventually, the material reaches the boiling temperature and vaporisation
limits further increase of melt-pool surface temperature. Variations of total energy input and
energy-density distribution due to dynamic changes of surface temperature and morphology affect
material vaporisation and thus the recoil pressure that is responsible for melt-pool surface depression.
Consequently, these effects cannot be described adequately when a constant absorptivity model is
employed in numerical simulations of laser welding and additive manufacturing. Modelling such
17Figure 9: Melt-pool shapes obtained from the present computational model for different cases in batch 3 (fibre
laser (λ = 1.070 × 10⁻⁶ m), P = 200 W, spot size db = 1.1 × 10⁻⁴ m and travel speed V = 1.5 m s−1 ). (a) variable
absorptivity, (b) constant absorptivity a = 0.30, (c) a = 0.35 and (d) a = 0.40.
phenomena with sufficient accuracy is crucial in numerical simulations of transition from conduction
to keyhole mode laser melting as well as those developed to predict solidification microstructure
and texture.
4.3 Thermal and fluid flow fields
Soon after exposing the material to laser radiation, a melt pool forms and grows over time and if
the boundary conditions allow, reaches a quasi-steady-state condition. Figure 10 shows the thermal
and fluid flow fields over the melt-pool surface at different time instances after reaching the quasi-
steady-state condition during laser melting using an Nd:YAG laser (λ = 1.064 × 10⁻⁶ m) with
different laser powers. The temperature gradient induced over the surface generates Marangoni
shear forces that drive molten metal flow. The molten metal moves from the cold regions adjacent to
the melt-pool rim towards the central part of the pool while absorbing energy from the laser beam.
This agrees well with experimental observations and discussions reported by Mills et al. [58] for
stainless steel alloys. The absorbed energy advects with the flow and diffuses through the material
into the surrounding solid regions. As the material absorbs energy, surface temperature increases
and if the power-density is high enough, the surface temperature reaches a critical value at which
the sign of the temperature gradient of surface tension (dγ/dT ) changes (see figure 2(e)), resulting
18in a change in flow direction. Interactions between the inward and the outward streams result in
a complex flow pattern in the pool that is inherently unsteady and three-dimensional [8, 59]. Two
vortices are observed over the melt-pool surface close to the hot spot, generating an asymmetric flow
pattern that fluctuates around the centre-line of the pool. This fluid motion forms a rotational flow
pattern in the pool that transfers the absorbed heat from the surface to the bottom of the pool [60].
Because of this rotational fluid motion, an element of molten metal volume may move from one side
of the pool to the other side, resulting in a cross-cellular flow [61] that enhances mixing in the pool.
Maximum fluid velocity in the pool reach values of about 0.6 m s−1 , corresponding to a Péclet number
(Pe = ρcp Dkuk/k) in the order of O(100) that indicates the significant contribution of advection to
the total energy transfer. Molten metal flow in the pool disturbs the thermal field and in turn affects
the absorptivity and Marangoni forces. A similar flow pattern is observed over the surface when
a CO2 laser is employed, and representative results are provided in the supplementary materials.
Figure 11 shows a time series of numerically predicted thermal and fluid flow fields over the melt-
pool surface after reaching the quasi-steady-state condition during laser melting using a fibre
laser (λ = 1.070 × 10⁻⁶ m) with a laser power of P = 200 W and a travel speed of V = 1.5 m s−1 .
In this case, three distinctive regions are identified: a region with significant surface depression
under the effect of recoil pressure, a trailing region characterised by low fluid velocities (less than
0.2 m s−1 ) and temperature (less than 1750 K), and a transition zone in between. A similar choice
of subdivision is reported by Khairallah et al. [36] to describe the anatomy of a melt track in
selective laser melting of a powder bed, where the surface tension temperature gradient (dγ/dT )
was assumed to be a negative constant value. Because of the relatively high laser power-density,
surface temperature in the spot region increases rapidly and reaches the boiling temperature Tb ,
leading to significant material vaporisation and increase in recoil pressure that locally deforms
the melt-pool surface. Beneath the front part of the depressed region, a relatively thin layer of
molten metal exists as shown in figure 9. The maximum molten metal velocity over the surface in
the depressed region is about 6 m s−1 due to the large temperature gradients, forming a multi-cellular
flow pattern in the thin molten metal layer due to Marangoni flow instabilities [61]. The maximum
molten metal velocity predicted for cases in batch 3 is higher than that for cases in batch 1 and 2.
This is primarily attributed to larger temperature gradients induced over the surface, increasing
the magnitude of Marangoni shear force. Moreover, for temperatures above a critical value at
which the sign of the temperature gradient of surface tension (dγ/dT ) changes from positive to
negative (see figure 2(e)), the absolute value of the temperature gradient of surface tension increases
with temperature, increasing the magnitude of Marangoni force applied to the molten material.
Due to the recoil pressure and the outward fluid motion on the surface, molten metal accumulates
ahead of the depressed region, which is also observed experimentally by Nakamura et al. [62] and
simulated numerically by Khairallah et al. [1, 36]. Elements of the accumulated liquid volume can
be ejected from the pool and form spatters as shown in figure 11(a and c). Spatters are small
19Figure 10: Evolution of thermal and fluid flow fields over the melt-pool surface during laser melting of stainless
steel 316L with different laser powers. (a) P = 500 W, (b) P = 700 W, and (c) P = 900 W. The variable absorptivity
model is utilised. Cases belong to batch 2, where an Nd:YAG laser (λ = 1.064 × 10⁻⁶ m) is employed with a travel
speed of 10−2 m s−1 .
compared to the melt-pool volume and generally cool down during their flight and thus do not have
sufficient thermal energy to melt the substrate and stick to the surface. Molten metal moves from
the central region of the depressed region towards the melt-pool rim and transfers the heat absorbed
from the laser. This fluid velocity corresponds to a Péclet number (Pe) in the order of O(100),
which is similar to the conduction-mode laser melting. Molten metal moving from the depressed
region towards the rear part of the pool meets an inward flow in the transition region, resulting in
the formation of two vortices over the surface. In the transition region, surface temperature is less
than the critical temperature at which the sign of the temperature gradient changes (see figure 2(e)),
thus the surface tension increases with increasing the temperature (i.e. dγ/dT > 0) in the transition
region, resulting in a fluid motion from the cold to the hot regions. In the trailing region, temperature
gradients are too small to generate significant Marangoni forces to drive the molten metal flow, and
20thus thermal diffusion dominates the energy transfer.
Figure 11: Evolution of thermal and fluid flow fields over the melt-pool surface during laser melting of stainless
steel 316L using a fibre laser (λ = 1.070 × 10⁻⁶ m) with a laser power of P = 200 W and a travel speed of 1.5 m s−1 .
The case belong to batch 3 and the variable absorptivity model is utilised.
5 Conclusions
The influence of laser characteristics on internal molten metal flow in laser-beam melting of a metallic
substrate was investigated numerically using a high-fidelity three-dimensional model. An enhanced
absorption model that accounts for laser emission wavelength, surface temperature, laser-ray incident
angle and material composition was utilised in the model, and the results compared with experimental
measurements as well as numerical data predicted using a constant absorption model. The physics
of complex heat and molten metal flow in laser melting is described for various test cases with
different laser powers, laser emission wavelengths, and power-density distributions.
For conduction-mode laser melting, where surface deformations are small compared to the melt-
21pool depth, the absorptivity changes primarily because of changes in surface temperature. However,
for cases that surface deformations are significant with respect to the melt-pool depth, changes
in the absorptivity are affected by both the surface temperature and the laser-ray incident angle.
Changes in the absorptivity affect energy-density distribution over the surface and hence the thermal
field over the melt-pool surface, which in turn can influence the Marangoni-driven molten metal flow
as well as the distribution of recoil pressure over the surface. These physical processes are tightly
coupled to one another, resulting in highly non-linear responses to changes in process parameters.
For laser melting processes with a relatively low power density using a CO2 or fibre transmissible
laser (with an emission wavelength close to 1 µm), the molten metal velocities and surface deforma-
tions are relatively small. Because of the small incident angle, the absorptivity for a CO2 laser is
lower than that for a Nd:YAG laser; thus, a lower laser power is required to obtain a melt-pool with
similar dimensions using an Nd:YAG laser as compared to a CO2 laser. Switching to a relatively
high power density laser melting process, molten metal velocities increase compared to the low power
density processes. For sufficiently high power densities, melt-pool surface deformations become
significant, resulting in strongly enhanced laser absorption which in turn further enhances metal
vaporisation.
The results of the present work demonstrate that the coupling between these physical processes
cannot be rendered with sufficient resolution employing a constant absorptivity model, reducing
the range of predictability of the computational models developed to describe the dynamics of
melt-pool behaviour in laser welding and additive manufacturing. Moreover, considering absorptivity
as a calibration parameter in computational models necessitates trial-and-error simulations, which
increases the total costs of computational analyses.
Although the focus of the present work is primarily on laser melting of bare metallic substrates
without powder layers, the fundamental laser-matter interaction mechanisms described here are
similar to those in laser melting of powder beds. The enhanced laser-absorptivity model employed
in the present work can also be utilised in numerical simulations of melt-pool behaviour in laser
melting of powder beds, provided that multiple reflections are included in the model.
Acknowledgement
This research was carried out under project numbers F31.7.13504, P16-46/S17024i and P16-
46/S17024m in the framework of the Partnership Program of the Materials innovation institute
M2i (www.m2i.nl) and the Foundation for Fundamental Research on Matter (FOM) (www.fom.nl),
which is part of the Netherlands Organisation for Scientific Research (www.nwo.nl). This research
project is also a part of Aim2XL program (www.m2i.nl/aim2xl). The authors would like to thank
the industrial partners in this project “Allseas Engineering B.V.” and “Rotterdam Fieldlab Additive
Manufacturing B.V. (RAMLAB)” for the financial support.
22Author Contributions
Conceptualisation, A.E.; methodology, A.E., M.S., S.J.L.B. and M.L.; software, A.E.; validation,
A.E., M.S. and S.J.L.B.; formal analysis, A.E.; investigation, A.E., M.S., S.J.L.B. and M.L.; resources,
A.E., M.S., S.J.L.B., M.L., G.R.B.E.R. and M.J.M.H.; data curation, A.E., M.S., S.J.L.B. and M.L.;
writing—original draft preparation, A.E.; writing—review and editing, A.E., M.S., S.J.L.B., M.L.,
G.R.B.E.R., I.M.R., C.R.K. and M.J.M.H.; visualisation, A.E., M.S., S.J.L.B. and M.L.; supervision,
G.R.B.E.R., I.M.R., C.R.K. and M.J.M.H.; project administration, A.E., G.R.B.E.R. and M.J.M.H.;
and funding acquisition, G.R.B.E.R., I.M.R. and M.J.M.H.
References
[1] Khairallah, S. A., Martin, A. A., Lee, J. R. I., Guss, G., Calta, N. P., Hammons, J. A., Nielsen,
M. H., Chaput, K., Schwalbach, E., Shah, M. N., Chapman, M. G., Willey, T. M., Rubenchik,
A. M., Anderson, A. T., Wang, Y. M., Matthews, M. J., and King, W. E. Controlling
interdependent meso-nanosecond dynamics and defect generation in metal 3D printing. Science,
368(6491):660–665, 2020. DOI: 10.1126/science.aay7830.
[2] Markl, M. and Körner, C. Multiscale modeling of powder bed–based additive manu-
facturing. Annual Review of Materials Research, 46(1):93–123, 2016. DOI: 10.1146/
annurev-matsci-070115-032158.
[3] Ebrahimi, A., Kleijn, C. R., and Richardson, I. M. A simulation-based approach to characterise
melt-pool oscillations during gas tungsten arc welding. International Journal of Heat and Mass
Transfer, 164:120535, 2021. DOI: 10.1016/j.ijheatmasstransfer.2020.120535.
[4] Francois, M. M., Sun, A., King, W. E., Henson, N. J., Tourret, D., Bronkhorst, C. A., Carlson,
N. N., Newman, C. K., Haut, T., Bakosi, J., Gibbs, J. W., Livescu, V., Wiel, S. A. V.,
Clarke, A. J., Schraad, M. W., Blacker, T., Lim, H., Rodgers, T., Owen, S., Abdeljawad, F.,
Madison, J., Anderson, A. T., Fattebert, J.-L., Ferencz, R. M., Hodge, N. E., Khairallah, S. A.,
and Walton, O. Modeling of additive manufacturing processes for metals: Challenges and
opportunities. Current Opinion in Solid State and Materials Science, 21(4):198–206, 2017.
DOI: 10.1016/j.cossms.2016.12.001.
[5] DebRoy, T., Mukherjee, T., Wei, H. L., Elmer, J. W., and Milewski, J. O. Metallurgy,
mechanistic models and machine learning in metal printing. Nature Reviews Materials, 6(1):
48–68, 2020. DOI: 10.1038/s41578-020-00236-1.
[6] Cook, P. S. and Murphy, A. B. Simulation of melt pool behaviour during additive manufacturing:
Underlying physics and progress. Additive Manufacturing, 31:100909, 2020. DOI: 10.1016/j.
addma.2019.100909.
23[7] Simonds, B. J., Tanner, J., Artusio-Glimpse, A., Williams, P. A., Parab, N., Zhao, C., and
Sun, T. The causal relationship between melt pool geometry and energy absorption measured
in real time during laser-based manufacturing. Applied Materials Today, 23:101049, 2021. DOI:
10.1016/j.apmt.2021.101049.
[8] Ebrahimi, A., Kleijn, C. R., and Richardson, I. M. Numerical study of molten metal melt pool
behaviour during conduction-mode laser spot melting. Journal of Physics D: Applied Physics,
54:105304, 2021. DOI: 10.1088/1361-6463/abca62.
[9] Ebrahimi, A., Kleijn, C. R., Hermans, M. J. M., and Richardson, I. M. The effects of process
parameters on melt-pool oscillatory behaviour in gas tungsten arc welding. Journal of Physics
D: Applied Physics, 54(27):275303, 2021. DOI: 10.1088/1361-6463/abf808.
[10] Xie, J., Kar, A., Rothenflue, J. A., and Latham, W. P. Temperature-dependent absorptivity
and cutting capability of CO2 , Nd:YAG and chemical oxygen–iodine lasers. Journal of Laser
Applications, 9(2):77–85, 1997. DOI: 10.2351/1.4745447.
[11] Mahrle, A. and Beyer, E. Theoretical aspects of fibre laser cutting. Journal of Physics D:
Applied Physics, 42(17):175507, 2009. DOI: 10.1088/0022-3727/42/17/175507.
[12] Ren, Z., Zhang, D. Z., Fu, G., Jiang, J., and Zhao, M. High-fidelity modelling of selective
laser melting copper alloy: Laser reflection behavior and thermal-fluid dynamics. Materials &
Design, 207:109857, 2021. DOI: 10.1016/j.matdes.2021.109857.
[13] Yang, Z., Bauereiß, A., Markl, M., and Körner, C. Modeling laser beam absorption of metal
alloys at high temperatures for selective laser melting. Advanced Engineering Materials, page
2100137, 2021. DOI: 10.1002/adem.202100137.
[14] Shu, Y., Galles, D., Tertuliano, O. A., McWilliams, B. A., Yang, N., Cai, W., and Lew, A. J.
A critical look at the prediction of the temperature field around a laser-induced melt pool on
metallic substrates. Scientific Reports, 11(1), 2021. DOI: 10.1038/s41598-021-91039-z.
[15] Kidess, A., Kenjereš, S., Righolt, B. W., and Kleijn, C. R. Marangoni driven turbulence in
high energy surface melting processes. International Journal of Thermal Sciences, 104:412–422,
2016. DOI: 10.1016/j.ijthermalsci.2016.01.015.
[16] Grange, D., Queva, A., Guillemot, G., Bellet, M., Bartout, J.-D., and Colin, C. Effect of
processing parameters during the laser beam melting of Inconel 738: Comparison between
simulated and experimental melt pool shape. Journal of Materials Processing Technology, 289:
116897, 2021. DOI: 10.1016/j.jmatprotec.2020.116897.
[17] De, A. and DebRoy, T. A smart model to estimate effective thermal conductivity and viscosity
in the weld pool. Journal of Applied Physics, 95(9):5230–5240, 2004. DOI: 10.1063/1.1695593.
24[18] King, W. E., Anderson, A. T., Ferencz, R. M., Hodge, N. E., Kamath, C., Khairallah, S. A.,
and Rubenchik, A. M. Laser powder bed fusion additive manufacturing of metals; physics,
computational, and materials challenges. Applied Physics Reviews, 2(4):041304, 2015. DOI:
10.1063/1.4937809.
[19] Khairallah, S. A. and Anderson, A. Mesoscopic simulation model of selective laser melting of
stainless steel powder. Journal of Materials Processing Technology, 214(11):2627–2636, 2014.
DOI: 10.1016/j.jmatprotec.2014.06.001.
[20] Indhu, R., Vivek, V., Sarathkumar, L., Bharatish, A., and Soundarapandian, S. Overview of
laser absorptivity measurement techniques for material processing. Lasers in Manufacturing
and Materials Processing, 5(4):458–481, 2018. DOI: 10.1007/s40516-018-0075-1.
[21] Ye, J., Khairallah, S. A., Rubenchik, A. M., Crumb, M. F., Guss, G., Belak, J., and Matthews,
M. J. Energy coupling mechanisms and scaling behavior associated with laser powder bed
fusion additive manufacturing. Advanced Engineering Materials, 21(7):1900185, 2019. DOI:
10.1002/adem.201900185.
[22] Svetlizky, D., Das, M., Zheng, B., Vyatskikh, A. L., Bose, S., Bandyopadhyay, A., Schoenung,
J. M., Lavernia, E. J., and Eliaz, N. Directed energy deposition (DED) additive manufacturing:
Physical characteristics, defects, challenges and applications. Materials Today, 2021. DOI:
10.1016/j.mattod.2021.03.020.
[23] Trapp, J., Rubenchik, A. M., Guss, G., and Matthews, M. J. In situ absorptivity measurements
of metallic powders during laser powder-bed fusion additive manufacturing. Applied Materials
Today, 9:341–349, 2017. DOI: 10.1016/j.apmt.2017.08.006.
[24] Ready, J. Industrial applications of lasers. Academic Press, San Diego, 2nd edition, 1997.
ISBN 9780125839617.
[25] Katayama, S. Handbook of laser welding technologies. Woodhead Publishing Limited, Philadel-
phia, PA, 2013. ISBN 9780857092649.
[26] Kouraytem, N., Li, X., Cunningham, R., Zhao, C., Parab, N., Sun, T., Rollett, A. D., Spear,
A. D., and Tan, W. Effect of laser-matter interaction on molten pool flow and keyhole dynamics.
Physical Review Applied, 11(6):064054, 2019. DOI: 10.1103/physrevapplied.11.064054.
[27] Lvovsky, A. I. Fresnel equations. In Encyclopedia of Optical and Photonic Engineering. CRC
Press, Boca Raton, Florida, 2nd edition, 2015. ISBN 9781351247184.
[28] Bass, M. Laser materials processing. Elsevier Science, Amsterdam, North-Holland, 1983. ISBN
9780444863966.
25[29] Simonds, B. J., Sowards, J., Hadler, J., Pfeif, E., Wilthan, B., Tanner, J., Harris, C.,
Williams, P., and Lehman, J. Time-resolved absorptance and melt pool dynamics during
intense laser irradiation of a metal. Physical Review Applied, 10(4):044061, 2018. DOI:
10.1103/physrevapplied.10.044061.
[30] Ujihara, K. Reflectivity of metals at high temperatures. Journal of Applied Physics, 43(5):
2376–2383, 1972. DOI: 10.1063/1.1661506.
[31] Wang, L. and Yan, W. Thermoelectric magnetohydrodynamic model for laser-based metal addi-
tive manufacturing. Physical Review Applied, 15(6):064051, 2021. DOI: 10.1103/physrevapplied.
15.064051.
[32] Saldi, Z. S. Marangoni driven free surface flows in liquid weld pools. PhD dissertation, Delft
University of Technology, Delft University of Technology, 2012.
[33] Jaques, A. Thermophysical properties of argon. Technical Report FNAL-TM-1517, Illinois,
United States, 1988.
[34] Mills, K. C. Fe-316 stainless steel. In Recommended Values of Thermophysical Properties for
Selected Commercial Alloys, pages 135–142. Elsevier, 2002. DOI: 10.1533/9781845690144.135.
[35] Heeling, T., Cloots, M., and Wegener, K. Melt pool simulation for the evaluation of process
parameters in selective laser melting. Additive Manufacturing, 14:116–125, 2017. DOI: 10.1016/
j.addma.2017.02.003.
[36] Khairallah, S. A., Anderson, A. T., Rubenchik, A., and King, W. E. Laser powder-bed fusion
additive manufacturing: Physics of complex melt flow and formation mechanisms of pores,
spatter, and denudation zones. Acta Materialia, 108:36–45, 2016. DOI: 10.1016/j.actamat.2016.
02.014.
[37] Kim, C. S. Thermophysical properties of stainless steels. Technical Report ANL-75-55, Illinois,
United States, 1975.
[38] Pichler, P., Simonds, B. J., Sowards, J. W., and Pottlacher, G. Measurements of thermophysical
properties of solid and liquid NIST SRM 316L stainless steel. Journal of Materials Science, 55
(9):4081–4093, 2019. DOI: 10.1007/s10853-019-04261-6.
[39] Sahoo, P., Debroy, T., and McNallan, M. J. Surface tension of binary metal—surface active
solute systems under conditions relevant to welding metallurgy. Metallurgical Transactions B,
19(3):483–491, 1988. DOI: 10.1007/bf02657748.
[40] Hirt, C. W. and Nichols, B. D. Volume of fluid (VOF) method for the dynamics of free boundaries.
Journal of Computational Physics, 39(1):201–225, 1981. DOI: 10.1016/0021-9991(81)90145-5.
26You can also read