The impact of chlorine chemistry combined with
←
→
Page content transcription
If your browser does not render page correctly, please read the page content below
Research article
Atmos. Chem. Phys., 22, 3743–3762, 2022
https://doi.org/10.5194/acp-22-3743-2022
© Author(s) 2022. This work is distributed under
the Creative Commons Attribution 4.0 License.

            The impact of chlorine chemistry combined with
          heterogeneous N2 O5 reactions on air quality in China
             Xiajie Yang1,2 , Qiaoqiao Wang1,2 , Nan Ma1,2 , Weiwei Hu3 , Yang Gao4 , Zhijiong Huang1,2 ,
          Junyu Zheng1,2 , Bin Yuan1,2 , Ning Yang1,2 , Jiangchuan Tao1,2 , Juan Hong1,2 , Yafang Cheng5 , and
                                                        Hang Su5
              1 Institute
                        for Environmental and Climate Research, Jinan University, Guangzhou 511443, China
         2 Guangdong–Hongkong–Macau       Joint Laboratory of Collaborative Innovation for Environmental Quality,
                                                Guangzhou 511443, China
             3 Guangzhou Institute of Geochemistry, Chinese Academy of Sciences, Guangzhou 510640, China
                      4 Key Laboratory of Marine Environment and Ecology, Ministry of Education,

                                    Ocean University of China, Qingdao 266100, China
                               5 Max Planck Institute for Chemistry, Mainz 55128, Germany

                                      Correspondence: Qiaoqiao Wang (qwang@jnu.edu.cn)

                                     Received: 13 October 2021 – Discussion started: 8 November 2021
                            Revised: 6 February 2022 – Accepted: 20 February 2022 – Published: 21 March 2022

      Abstract. The heterogeneous reaction of N2 O5 on Cl-containing aerosols (heterogeneous N2 O5 + Cl chem-
      istry) plays a key role in chlorine activation, NOx recycling, and consequently O3 and PM2.5 formation. In this
      study, we use the GEOS-Chem model with additional anthropogenic and biomass burning chlorine emissions
      combined with updated parameterizations for the heterogeneous N2 O5 + Cl chemistry (i.e., the uptake coef-
      ficient of N2 O5 (γN2 O5 ) and the ClNO2 yield (ϕClNO2 )) to investigate the impacts of chlorine chemistry on air
      quality in China, the role of the heterogeneous N2 O5 + Cl chemistry, and the sensitivity of air pollution formation
      to chlorine emissions and parameterizations for γN2 O5 and ϕClNO2 . The model simulations are evaluated against
      multiple observational datasets across China and show significant improvement in reproducing observations of
      particulate chloride, N2 O5 , and ClNO2 when including anthropogenic chlorine emissions and updates to the
      parameterization of the heterogeneous N2 O5 + Cl chemistry relative to the default model. The simulations show
      that total tropospheric chlorine chemistry could increase annual mean maximum daily 8 h average (MDA8) O3
      by up to 4.5 ppbv but decrease PM2.5 by up to 7.9 µg m−3 in China, 83 % and 90 % of which could be attributed to
      the effect of the heterogeneous N2 O5 + Cl chemistry. The heterogeneous uptake of N2 O5 on chloride-containing
      aerosol surfaces is an important loss pathway of N2 O5 as well as an important source of O3 and hence is partic-
      ularly useful in elucidating the commonly seen ozone underestimations relative to observations. The importance
      of chlorine chemistry largely depends on both chlorine emissions and the parameterizations for the heteroge-
      neous N2 O5 + Cl chemistry. With the additional chlorine emissions, the simulations show that annual MDA8 O3
      in China could be increased by up to 3.5 ppbv. The corresponding effect on PM2.5 concentrations varies largely
      with regions, with an increase of up to 4.5 µg m−3 in the North China Plain but a decrease of up to 3.7 µg m−3
      in the Sichuan Basin. On the other hand, even with the same chlorine emissions, the effects on MDA8 O3 and
      PM2.5 in China could differ by 48 % and 27 %, respectively, between different parameterizations.

Published by Copernicus Publications on behalf of the European Geosciences Union.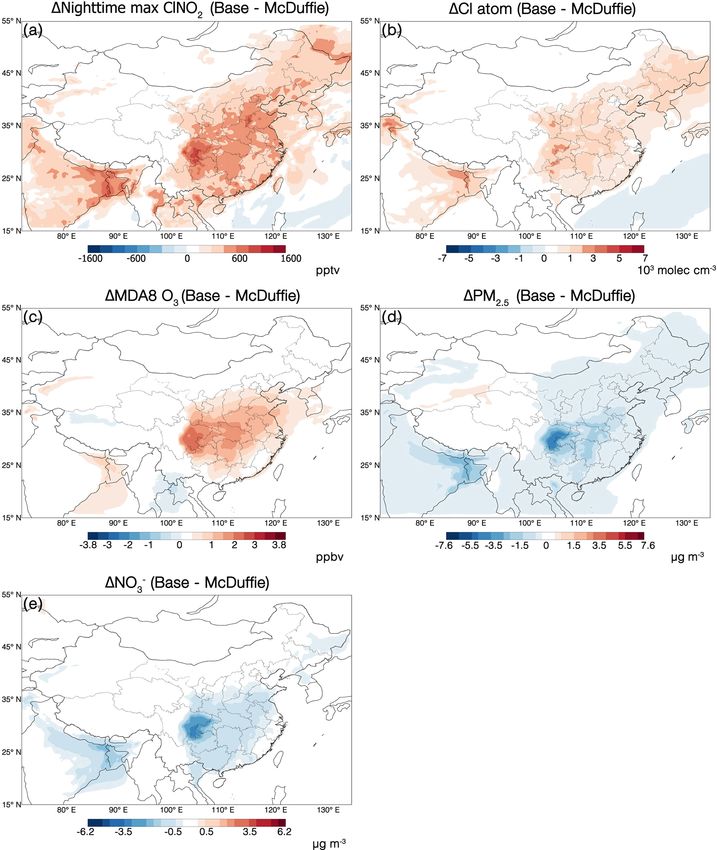
3744         X. Yang et al.: The impact of chlorine chemistry combined with heterogeneous N2 O5 reactions on air quality

1   Introduction                                                 sis of ClNO2 at daytime (Reaction R4) not only releases
                                                                 highly reactive Cl atoms but also recycles NO2 back to
Chlorine (Cl) plays an important role in atmospheric chem-       the atmosphere, which also significantly affects the daytime
istry in both the stratosphere and the troposphere, primarily    photochemistry (Riedel et al., 2014). Previous global and
via the reactions of the Cl atom with various atmospheric        hemispheric models found that the heterogeneous N2 O5 + Cl
trace gases including dimethyl sulfide, methane, and other       chemistry could increase monthly mean values of the max-
volatile organic compounds (VOCs). The chemistry of Cl is        imum daily 8 h average (MDA8) O3 concentrations by 1.0–
quite similar with that of hydroxyl radicals (OH) while Cl       8.0 ppbv in most Northern Hemisphere regions (Sarwar et al.,
atoms react up to 2 orders of magnitude faster with some         2014; Wang et al., 2019). The reaction also impacts sec-
VOCs than OH (Atkinson et al., 2006). Studies have shown         ondary aerosol formation, mainly through the recycling of
that Cl accounts for around 2.5 %–2.7 % of the global CH4        NOx (Staudt et al., 2019; Mitroo et al., 2019). For exam-
oxidation in the troposphere, and the contribution varies        ple, Sarwar et al. (2014) estimated that ClNO2 production
across regions, reaching up to 10 %–15 % in Cabo Verde and       decreases nitrate by 3.3 % in winter and 0.3 % in summer av-
∼ 20 % in east China (Lawler et al., 2011; Hossaini et al.,      eraged over the entire Northern Hemisphere. The influence
2016). The Cl atom, therefore, is regarded as a potentially      of the heterogeneous formation of ClNO2 in China is even
important tropospheric oxidant.                                  larger due to the polluted environment, leading to an increase
   In general, Cl atoms can be produced from the photo-          in ozone concentrations by up to 7 ppbv and a decrease in to-
dissociation and the oxidation of chlorinated organic species    tal nitrate by up to 2.35 µg m−3 on a monthly mean basis (Li
(e.g., CH3 Cl, CH2 Cl2 , and CHCl3 ) and inorganic chlorine      et al., 2016; Sarwar et al., 2014)
species (i.e., HCl and Cl2 ) (Saiz-Lopez and Von Glasow,            There are two key parameters that determine the uptake
2012; Simpson et al., 2015). Nitryl chloride (ClNO2 ), formed    efficiency of N2 O5 and production of ClNO2 , the aerosol
through the heterogeneous reaction between dinitrogen pen-       uptake coefficient of N2 O5 (γN2 O5 ) and the ClNO2 yield
toxide (N2 O5 ) and chloride-containing aerosols (hereinafter    (ϕClNO2 ). The most widely used parameterization for γN2 O5
referred to as the heterogeneous N2 O5 + Cl chemistry), is       and ϕClNO2 was proposed by Bertram and Thornton (2009)
found to be another important source of tropospheric Cl          (hereinafter referred to as BT09), which is based on the lab-
atoms in polluted regions (Liu et al., 2018; Haskins et al.,     oratory studies with considerations of aerosol water content,
2019; Choi et al., 2020; Simpson et al., 2015). The het-         concentrations of nitrate and chloride, and specific surface
erogeneous formation of ClNO2 and the subsequent pho-            area (i.e., the ratio of surface area concentrations to parti-
tolysis can be described by Reactions (R1)–(R4) shown            cle volume concentrations). However, recent field and model
below (Finlayson-Pitts et al., 1989; Osthoff et al., 2008).      studies have shown that this parameterization would over-
The net Reactions (R1) (N2 O5 hydrolysis on non-chloride-        estimate both γN2 O5 and ϕClNO2 , especially in regions with
containing aerosols) and (R2) (uptake of N2 O5 on chloride-      high Cl levels (Mcduffie et al., 2018b, a; Xia et al., 2019;
containing aerosols) could be expressed as Reaction (R3), in     Chang et al., 2016; Hong et al., 2020; Yu et al., 2020). The
which the ClNO2 yield (i.e., ϕClNO2 , defined as the molar ra-   discrepancies could be partly attributed to the complexity of
tio of produced ClNO2 to total reacted N2 O5 ) represents the    atmospheric aerosols (e.g., mixing state and complex coating
fraction of N2 O5 reacting via Reaction (R2).                    materials) in contrast to the simple proxies used in laboratory
N2 O5 (g) + H2 O(aq) → 2 HNO3 (aq)                       (R1)    studies (Yu et al., 2020). Specifically, the suppressive effect
                                                                 of organic coatings is not considered in BT09. Several pa-
N2 O5 (g) + HCl(aq) → HNO3 (aq) + ClNO2 (g)              (R2)    rameterizations updated from BT09 have been proposed by
N2 O5 (g) + (1−ϕ)H2 O(aq) + ϕHCl(aq)                             more recent studies based on field measurements and box
                → (2 − ϕ)HNO3 (aq) + ϕClNO2 (g)          (R3)    model studies (Yu et al., 2020; Mcduffie et al., 2018a, b; Xia
                                                                 et al., 2019). However, some of these previous field-based
ClNO2 (g) + hν → Cl(g) + NO2 (g)                         (R4)
                                                                 parameterizations were derived from observations under dif-
   Estimates based on model simulations have suggested that      ferent ambient conditions which may not be applicable to
ClNO2 provides a source of Cl atoms totaling 0.66 Tg Cl a−1 ,    the highly polluted regions in China. A full evaluation of the
with the vast majority (95 %) being in the Northern Hemi-        representativeness of different parameterizations for the het-
sphere (Sherwen et al., 2016). The relative contribution of      erogeneous N2 O5 + Cl chemistry and the associated impacts
ClNO2 to global tropospheric Cl atoms is 14 % on average         on ambient air quality in China is not available yet.
and exhibits clear regional variations (Sherwen et al., 2016).      In addition to the parameterization, the influence of the
For example, the study by Riedel et al. (2012) reported that     heterogeneous N2 O5 + Cl chemistry is also sensitive to chlo-
the relative contribution is approximately 45 % in Los Ange-     rine emissions. In early modeling studies, global tropo-
les based on a simple box model combined with local obser-       spheric chlorine is mainly from sea salt aerosols (SSA), and
vations.                                                         most of the chlorine over continental regions in North Amer-
   The heterogeneous formation of ClNO2 also serves as a         ica and Europe is dominated by the long-range transport of
reservoir for reactive nitrogen at night. The rapid photoly-     SSA (Wang et al., 2019; Sherwen et al., 2017). The study by

Atmos. Chem. Phys., 22, 3743–3762, 2022                                           https://doi.org/10.5194/acp-22-3743-2022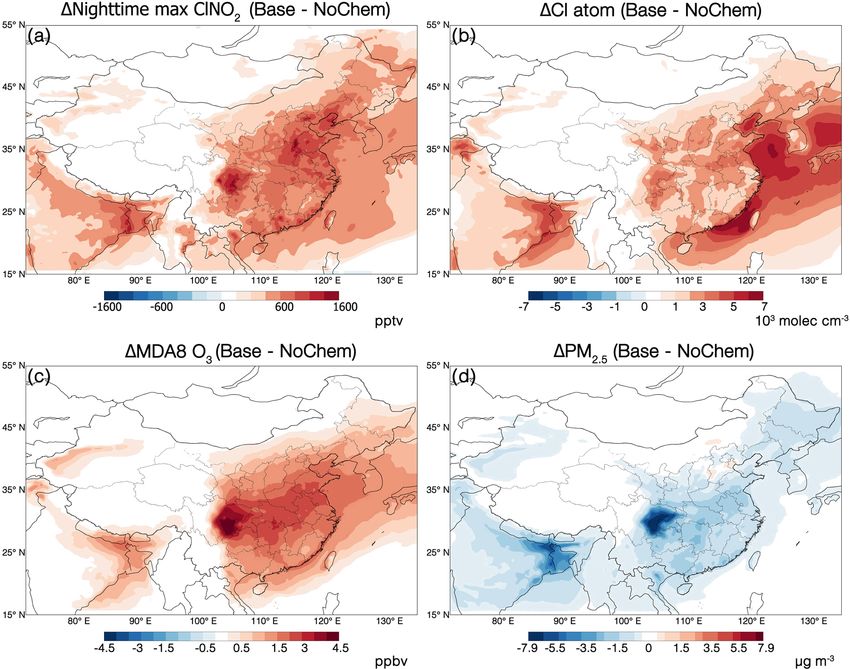
X. Yang et al.: The impact of chlorine chemistry combined with heterogeneous N2 O5 reactions on air quality 3745
Wang et al. (2019) found an addition of anthropogenic chlo- over east Asia and China (Wang et al., 2013; Geng et al.,
rine emissions in the model would result in overestimates of 2015; Li et al., 2019).
HCl observations in the US and suggested insignificant influ-
ence of anthropogenic Cl in the US. However, there are also 2.1.1 Chlorine chemistry
studies pointing out the importance of anthropogenic chlo-
rine emissions in China (Le Breton et al., 2018; Yang et al., The GEOS-Chem model includes a comprehensive chlo-
2018; Hong et al., 2020). The study by X. Wang et al. (2020) rine chemistry mechanism coupled with bromine and iodine
suggested that anthropogenic chlorine emissions in China are chemistry. Full details could be found in the study of Wang
more than 8 times higher than those in the US and could dom- et al. (2019). Briefly, the model includes 12 gas-phase inor-
inate reactive chlorine in China, resulting in an increase in ganic chlorine species (Cl, Cl2 , Cl2 O2 , ClNO2 , ClNO3 , ClO,
PM2.5 and ozone by up to 3.2 µg m−3 and 1.9 ppbv on an an- ClOO, OClO, BrCl, ICl, HOCl, HCl), three gas-phase or-
nual mean basis, respectively. The comprehensive effects of ganic chlorine species (CH3 Cl, CH2 Cl2 , CHCl3 ), and aerosol
anthropogenic chlorine on air quality as well as their sensi- Cl− in two size bins (fine mode with radius ≤ 0.5 µm and
tivities to different parameterizations for the heterogeneous coarse mode with radius > 0.5 µm). The gas–aerosol equilib-
N2 O5 + Cl chemistry, however, has not been investigated in rium between HCl and Cl− is calculated with ISORROPIA
previous studies. II (Fountoukis and Nenes, 2007) as part of the H2 SO4 –HCl–
In this work, we use the GEOS-Chem model to investigate HNO3 –NH3 –non-volatile cation (NVC) thermodynamic sys-
the impacts of chlorine chemistry including the heteroge- tem, where Na+ is used as a proxy for NVCs.
neous N2 O5 + Cl chemistry on air quality in China. Multiple The heterogeneous uptake of N2 O5 on aerosol surfaces
observational datasets, including N2 O5 , ClNO2 , O3 , PM2.5 , leading to the production of ClNO2 and HNO3 has also
and its chemical compositions from different representative been included in GEOS-Chem with the parameterizations for
sites across China, are used to assess the model performance. γN2 O5 and ϕClNO2 proposed by McDuffie et al. (2018b, a)
With comprehensive chlorine emissions as well as appro- by default (hereinafter referred to as McDuffie parameter-
priate parameterizations for the heterogeneous N2 O5 + Cl ization). McDuffie parameterization is the first field-based
chemistry, our objectives are (1) to improve the model’s per- empirical parameterization derived from the framework pro-
formance regarding the simulation of particulate chloride, posed in multiple laboratory studies including BT09 (Anttila
ClNO2 , N2 O5 , PM2.5 , and O3 concentrations and (2) to ex- et al., 2006; Bertram and Thornton, 2009; Riemer et al.,
tend the investigation on the effects of chlorine chemistry on 2009) to account for the uptake dependence on aerosol wa-
both PM2.5 and ozone pollution in China as well as their sen- ter and nitrate concentrations as well as the resistance from
sitivities to anthropogenic chlorine emissions and the param- an organic coating. The coefficients for McDuffie parame-
eterizations for the heterogeneous N2 O5 + Cl chemistry. terization were derived from applying a box model to obser-
vations of N2 O5 , ClNO2 , O3 , and NOx mixing ratios during
the winter in the eastern US. The parameterization for γN2 O5
2 Methodology accounts for both the inorganic and organic aerosol compo-
nents and can be described by Eqs. (1)–(3):
2.1 GEOS-Chem model 1 1 1
= + , (1)
The GEOS-Chem model (version 12.9.3, γN2 O5 γcore γcoat
http://www.geos-chem.org, last access: 14 March 2022, 4V 1
https://doi.org/10.5281/zenodo.3974569) is driven by as- γcore = KH × 2.14 × 10⁵ × [H2 O] 1 − [H O] , (2)
c · Sa 2
ka [NO− ] + 1
similated meteorological fields (GEOS-FP) from the NASA 3
Global Modeling and Assimilation Office (GMAO) at NASA 4RT εHaq Daq Rc
Goddard Space Flight Center. The simulation in this study γcoat = , (3)
clRp
was conducted in a nested-grid model with a native horizon-
tal resolution of 0.25◦ × 0.3125◦ (latitude × longitude) and where γcore represents the reactive uptake of the inorganic
47 vertical levels over East Asia (15◦ S–55◦ N, 70–140◦ E). aerosol core and γcoat represents the retardation of the or-
The dynamical boundary conditions were from a global ganic coating; c is the average gas-phase thermal velocity of
simulation with a horizontal resolution of 2◦ × 2.5◦ . We N2 O5 (m s−1 ), V is the total particle volume concentration
initialized the model with a 1 month spinup followed by (m3 m−3 ), Sa is the total particle surface area concentration
a 1-year simulation for 2018. The simulation included (m2 m−3 ), KH is the unitless Henry law coefficient for N2 O5
a detailed representation of coupled NOx –ozone–VOC– with a constant value of 51, [H2 O] and [NO− 3 ] are the con-
aerosol–halogen chemistry (Sherwen et al., 2016; Wang centrations of aerosol liquid water content and aerosol ni-
et al., 2019). Previous studies have demonstrated the ability trate (mol L−1 ), respectively, and ka is the rate constant ra-
of GEOS-Chem to reasonably reproduce the magnitude and tio representing the competition between aerosol-phase H2 O
seasonal variation in surface ozone and particulate matter and NO− +
3 for the H2 ONO2 (aq) intermediate and is fixed at
https://doi.org/10.5194/acp-22-3743-2022 Atmos. Chem. Phys., 22, 3743–3762, 2022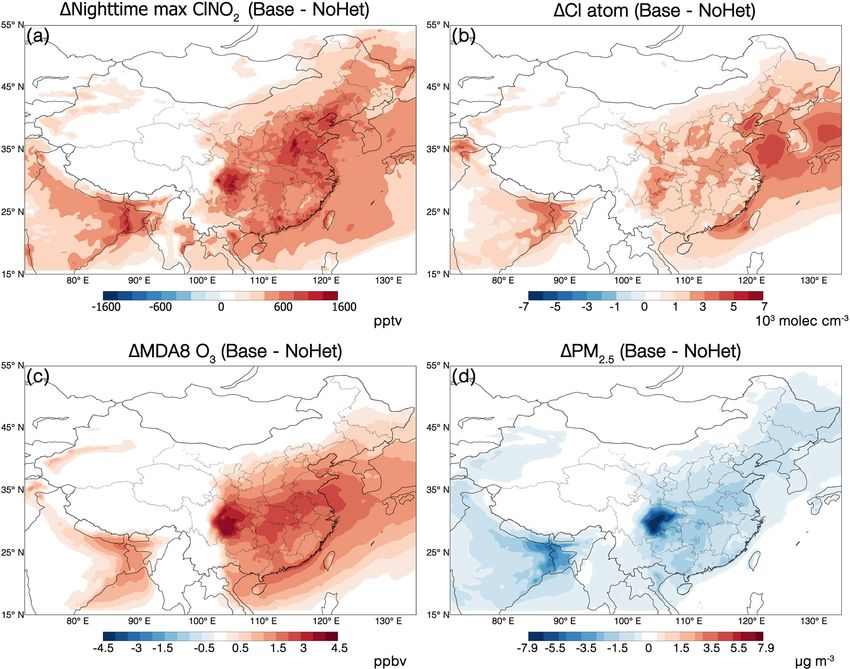
3746 X. Yang et al.: The impact of chlorine chemistry combined with heterogeneous N2 O5 reactions on air quality
0.04 in Eq. (2). R is the ideal gas constant; T is the tempera- but excludes the dependence on aerosol chloride so as to bet-
ture (K); Haq and Daq are the aqueous Henry law constant ter reproduce observed wintertime reactive nitrogen in the
and aqueous-phase diffusion coefficient of N2 O5 , respec- eastern US. Moreover, the parameterization accounts for the
tively; ε is a linear combination of relative humidity (RH) suppressive effects of the organics (i.e., γcoat ), which are not
and O : C ratio (= 0.15 × O : C + 0.0016 × RH); and Rp , Rc , directly included in BT09 (Anttila et al., 2006; Riemer et al.,
and l are the total particle radius, inorganic core radius, and 2009; Morgan et al., 2015). In contrast to the McDuffie pa-
organic coating thickness, respectively (m). rameterization, the Yu parameterization excludes the organic
ϕClNO2 is calculated following BT09 but is reduced by suppression but includes the chloride enhancement so as to
75 % based on the observations conducted in the eastern US better reproduce γN2 O5 observed in China (Yu et al., 2020).
and offshore in spring 2015 (i.e., the WINTER aircraft cam- It is worth mentioning that the coefficients applied in the
paign) (McDuffie et al., 2018b). It could be described by parameterization of γN2 O5 also differ between the McDuffie
Eq. (4): and Yu parameterizations as both are fixed to reproduce the
−1 ambient observation representing different pollution condi-
[H2 O] tions. For example, ka is equal to 0.04 in Eq. (2) but 0.033
ϕClNO2 = 0.25 × kc +1 , (4)
[Cl− ] in Eq. (5). The γN2 O5 in the McDuffie parameterization is
thus expected to be lower compared with the Yu parameter-
where kc is the rate constant ratio representing the com-
ization due to the resistance from organic coating and the
petition between aerosol-phase H2 O and Cl− for the
lack of the chloride enhancement. For ϕClNO2 , both the Mc-
H2 ONO+ 2 (aq) intermediate and is fixed at 1/450 here, and Duffie and Yu parameterizations are based on BT09, but with
[Cl− ] is the concentration of aerosol chloride (mol L−1 ). For
different coefficients (i.e., kc = 1/450 in Eq. 4 and 1/150 in
a more detailed description of the McDuffie parameteriza-
Eq. 6). Although kc in Eq. (4) is relatively smaller, the scal-
tion, readers are referred to McDuffie et al. (2018b, a). Keep
ing factor of 0.25 applied in Eq. (4) ultimately results in a
it in mind that the coefficients for the parameterizations in
much smaller ϕClNO2 in the McDuffie parameterization com-
Eqs. (1)–(4) were derived to better reproduce wintertime ob-
pared with the Yu parameterization under the same condition.
servations in the eastern US. However, there are large uncer-
Again, keep it in mind that the McDuffie parameterization is
tainties in both the values of the coefficients and functional
derived from fits to observations over the eastern US (Mc-
form of the parameterizations, specifically related to their ap-
Duffie et al., 2018a) while the Yu parameterization is fitted
plicability to other regions.
to observations at rural locations in China (Yu et al., 2020).
Recently, Yu et al. (2020) proposed new parameterizations
In this study, we updated the parameterizations for γN2 O5
of γN2 O5 and ϕClNO2 based on BT09 to account for the de-
and ϕClNO2 in the heterogeneous N2 O5 + Cl chemistry (here-
pendence on aerosol water, nitrate, and chloride concentra-
inafter referred to as parameterizations for heterogeneous
tions but with coefficients derived from uptake coefficients
N2 O5 + Cl chemistry) in the GEOS-Chem with the Yu pa-
directly measured on ambient aerosol in two rural sites in
rameterization. Additional simulation cases were also per-
China. The parameterizations of γN2 O5 and ϕClNO2 (here-
formed to evaluate the representativeness of both the Yu
inafter referred to as the Yu parameterization) are described
and McDuffie parameterizations regarding the simulation of
by Eqs. (5) and (6), respectively.
N2 O5 , ClNO2 , O3 , PM2.5 , and its chemical compositions in
4V China. Detailed description of the model setup for related
γN2 O5 = KH × 3.0 × 10⁴ × [H2 O]
c · Sa cases is provided below in Sect. 2.1.3.
1 2.1.2 Emissions
× 1 − (5)
[H2 O] [Cl− ]
ka [NO − + kb [NO − +1
3] 3] The study uses the Hemispheric Transport of Air Pollution
[H2 O]
−1 (HTAPv2, http://www.htap.org/, last access: 14 March 2022)
ϕClNO2 = 1 + kc (6) based on the emission of 2010 as a global anthropogenic
[Cl− ]
inventory. This inventory is overwritten by a regional
Here kb is the rate constant ratio representing the com- emission inventory MIX (with a horizontal resolution of
petition between aerosol-phase Cl− and NO− 3 for the 0.25◦ × 0.25◦ ) over East Asia based on the emission in 2017,
H2 ONO+ 2 (aq) intermediate and is fixed at 3.4. In contrast to which is developed for the Model Inter-Comparison Study
the McDuffie parameterization, ka and kc in the Yu parame- for Asia (MICS-Asia) and covers all major anthropogenic
terization are fixed at 0.033 and 1/150, respectively. sources in 30 Asian countries and regions (Li et al., 2017).
Although both parameterizations are developed based on In addition, anthropogenic emissions of black carbon (BC)
BT09, there are significant differences of γN2 O5 and ϕClNO2 and organic carbon (OC) in Guangdong Province, China (20–
between the McDuffie and Yu parameterizations. For γN2 O5 , 26◦ N, 109–117◦ E), are overwritten by a more recent high-
the McDuffie parameterization generally follows BT09 for resolution inventory (9 km × 9 km) described by Huang et al.
the calculation of the uptake on inorganic aerosols (i.e., γcore ) (2021). Biomass burning emissions are from the Global Fire
Atmos. Chem. Phys., 22, 3743–3762, 2022 https://doi.org/10.5194/acp-22-3743-2022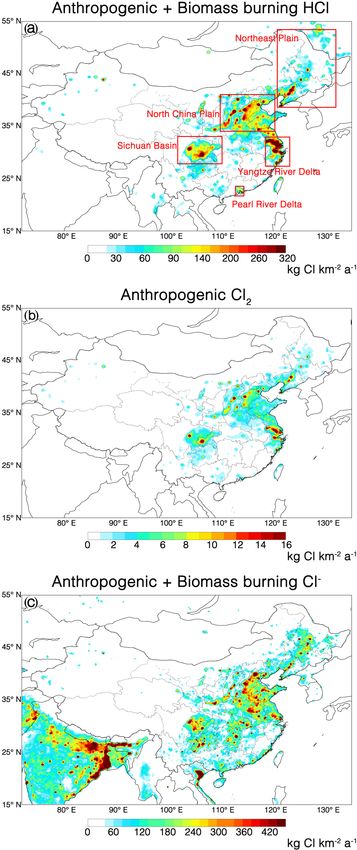
X. Yang et al.: The impact of chlorine chemistry combined with heterogeneous N2 O5 reactions on air quality                                3747

Table 1. Chlorine emissions in China in the model.                               for China) (Liu et al., 2018) and are estimated to be 218 and
                                                                                 8.9 Gg Cl in China, respectively. For HCl from biomass burn-
   Sources                         By default        Updated in this study       ing, the emission factors from Lobert et al. (1999) are used
                                  (Gg Cl a−1 )                (Gg Cl a−1 )       for different types of biomass provided in GFED4, and a total
   Sea salt Cl−                      6.5 × 10⁴                      6.5 × 10⁴    emission of 30 Gg Cl is obtained in China in 2018. Total im-
   Anthropogenic HCl                         0                            218    plemented chlorine emission for the simulation year of 2018
   Biomass burning HCl                       0                              30   is 756 Gg Cl.
   Anthropogenic Cl2                         0                             8.9      Figure 1 shows the distribution of Cl emissions from the
   Anthropogenic Cl−                         0                            379    sources mentioned above. Anthropogenic and biomass burn-
   Biomass burning Cl−                       0                            120    ing emissions of HCl are concentrated in the Northeast Plain,
   CH3 Cl∗                                 3.8                            3.8    North China Plain, Yangtze River Delta, and Sichuan Basin
   CH2 Cl2 ∗                               2.4                            2.4    and are up to 320 kg Cl km−2 a−1 in the Sichuan Basin. Emis-
   CHCl3 ∗                                0.70                           0.70
                                                                                 sions of HCl are low in south China, mainly due to the
 ∗ Sources are shown in terms of the chemical release (e.g., +Cl, +OH, +hν ).    low chlorine content of coal in these regions (Hong et al.,
                                                                                 2020). The relative contribution of biomass burning to total
                                                                                 HCl emissions in China is 14 % on average but could be-
                                                                                 come dominant in the Northeast Plain due to the discrepan-
Emissions Database (GFED4) (Van et al., 2010) with a 3 h                         cies in the spatial distributions of anthropogenic and biomass
time resolution. The biogenic emissions of VOCs are calcu-                       burning emissions. The anthropogenic Cl2 emissions have
lated based on the Model of Emissions of Gases and Aerosols                      a similar spatial distribution to that of HCl but are 1 or-
from Nature (MEGAN2.1) (Guenther et al., 2006).                                  der of magnitude lower than HCl emissions. The distribu-
   Table 1 lists Cl emissions from all sources in the model.                     tion of non-sea-salt Cl− emissions is also similar to that
The global tropospheric chlorine by default in the model is                      of HCl and Cl2 , except that non-sea-salt Cl− emissions are
mainly from the mobilization of Cl− from SSA distributed                         also high in central China. In contrast, emissions of sea salt
over two size bins (fine and coarse modes) (Wang et al.,                         Cl− (Fig. S1 in the Supplement) are mainly distributed over
2019), which is computed online as the integrals of the size-                    the ocean, implying limited influences inland due to rapid
dependent source function depending on wind speeds and sea                       deposition during transport. The spatial distributions of dif-
surface temperatures (Jaeglé et al., 2011). During the simu-                     ferent organic chlorine sources are similar, with maximums
lation year of 2018, SSA contributes 6.5 × 10⁴ Gg Cl− , most                     (∼ 0.5 kg Cl km−2 a−1 ) in coastal regions (Fig. S1).
of which however is distributed over the ocean due to its rela-
tively short lifetime (∼ 1.5 d) (Choi et al., 2020). The release                 2.1.3   Model setup for different simulation cases
of atomic Cl from organic chlorine (CH3 Cl, CH2 Cl2 , and
CHCl3 ) via oxidation by OH and Cl is also included in the                       In this study, we conducted a series of simulation cases to
model by default. These organic chlorine gases are mainly                        investigate the effects of chlorine chemistry on air quality in
of biogenic marine origin (Simmonds et al., 2006), with a                        China, the role of N2 O5 –ClNO2 chemistry, and the associ-
mean tropospheric lifetime longer than 250 d (X. Wang et al.,                    ated sensitivities to chlorine emissions as well as the param-
2020), and are simulated in the model by imposing fixed sur-                     eterizations for N2 O5 –ClNO2 chemistry. A detailed model
face concentrations as described by Schmidt et al. (2016). To-                   setup for those cases is listed in Table 2. The Base case is the
tal emissions of Cl atoms from CH3 Cl, CH2 Cl2 , and CHCl3                       one with all updates in this study, including additional chlo-
are calculated to be 3.8, 2.4, and 0.70 Gg Cl a−1 , respectively.                rine sources from anthropogenic and biomass burning emis-
   Considering the importance of anthropogenic chlorine in                       sions as well as N2 O5 uptake and ClNO2 production rep-
China, we have further updated chlorine inventories in the                       resented by the Yu parameterization. The NoEm case is con-
model to account for anthropogenic HCl, Cl2 and fine par-                        ducted with a similar setup as the Base case but only includes
ticulate Cl− , and biomass burning HCl and Cl− emissions                         chlorine emissions from SSA and organic chlorine sources
(also shown in Tables 1 and S1 in the Supplement). For fine                      so as to evaluate the model improvement originating from
particulate Cl− from both anthropogenic and biomass burn-                        the updated chlorine emissions through the comparison with
ing, the emissions are estimated based on PM2.5 emissions                        the Base case. The McDuffie case is also performed using
from MIX and GFED4 inventories combined with the emis-                           the McDuffie instead of Yu parameterization for γN2 O5 and
sion ratios of fine particulate Cl− versus PM2.5 for different                   ϕClNO2 while keeping others the same as the Base case so as
emission sectors adopted from the study of Fu et al. (2018).                     to evaluate the discrepancies originating from different pa-
Estimated Cl− emissions from anthropogenic and biomass                           rameterizations for the heterogeneous N2 O5 + Cl chemistry.
burning are 379 and 120 Gg, respectively, comparable to the                         In addition, while keeping others the same as the Base
results of 486 Gg in total for the year of 2014 by Fu et al.                     case, the NoHet case sets ϕClNO2 to zero (Eq. 6) and re-
(2018). The anthropogenic emissions of HCl and Cl2 are                           moves the enhancement of N2 O5 uptake from aerosol chlo-
from ACEIC (Anthropogenic Chlorine Emissions Inventory                           ride (i.e., [Cl− ] = 0 in Eq. 5). The comparison between the

https://doi.org/10.5194/acp-22-3743-2022                                                         Atmos. Chem. Phys., 22, 3743–3762, 2022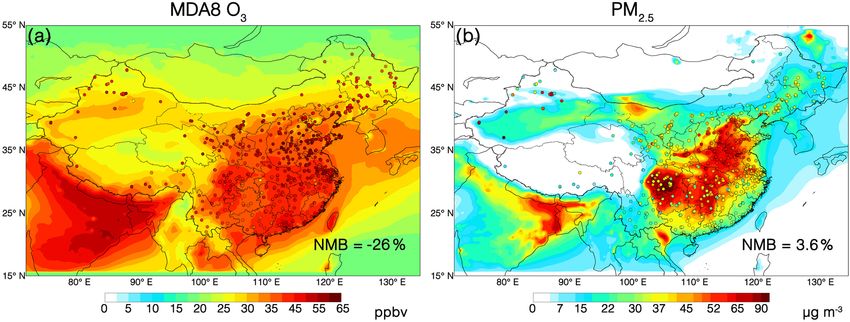
3748          X. Yang et al.: The impact of chlorine chemistry combined with heterogeneous N2 O5 reactions on air quality

                                                                      Base and NoHet cases could thus evaluate the importance of
                                                                      the heterogeneous N2 O5 + Cl chemistry (i.e., the model sen-
                                                                      sitivities to a smaller gamma N2 O5 and zero ClNO2 produc-
                                                                      tion). Similarly, combined with three more sensitivity cases
                                                                      (NoChem, NoEmHet, and NoAll; see details in Table 2), the
                                                                      study provides an overall evaluation of the importance of tro-
                                                                      pospheric chlorine chemistry as well as its sensitivities to
                                                                      chlorine emissions and the parameterizations for the hetero-
                                                                      geneous N2 O5 + Cl chemistry in the model.

                                                                      2.2   Observations
                                                                      Multiple observed datasets were applied in this study to eval-
                                                                      uate the performance of GEOS-Chem simulation, includ-
                                                                      ing the concentrations of chemical compositions of PM2.5
                                                                      from three representative sites, located in south (Guangzhou,
                                                                      23.14◦ N, 113.36◦ E), east (Dongying, 37.82◦ N, 119.05◦ E),
                                                                      and north (Gucheng, 37.36◦ N, 115.96◦ E) China, respec-
                                                                      tively (Fig. S2). Concentrations of SO2−        −     +     −
                                                                                                               4 , NO3 , NH4 , Cl ,
                                                                      and organic matter (OM) in PM2.5 were measured by a high-
                                                                      resolution time-of-flight aerosol mass spectrometer (HR-
                                                                      ToF-AMS; Aerodyne Research Inc., USA; Decarlo et al.,
                                                                      2006) from 2 October to 18 November 2018 (with a time
                                                                      resolution of 1 min) at the Guangzhou site (W. Chen et al.,
                                                                      2021), and from 18 March to 21 April 2018 (with a 1 min
                                                                      time resolution) at the Dongying site. Concentrations of these
                                                                      species were measured by an Aerodyne quadruple aerosol
                                                                      chemical speciation monitor (ACSM; Aerodyne Research
                                                                      Inc., USA; Ng et al., 2011) from 11 November to 18 De-
                                                                      cember 2018, with a time resolution of 2 min at the Gucheng
                                                                      site (Li et al., 2021).
                                                                         Concentrations of N2 O5 and ClNO2 (with a time resolu-
                                                                      tion of 1 min) were also measured at the Guangzhou site by a
                                                                      chemical ionization mass spectrometer (CIMS, THS Instru-
                                                                      ments Inc., Atlanta; Kercher et al., 2009) from 25 September
                                                                      to 12 November 2018 (Ye et al., 2021). To have a thorough
                                                                      evaluation of the representativeness of different parameter-
                                                                      izations for γN2 O5 and ϕClNO2 , observations of ClNO2 and
                                                                      N2 O5 at six more sites across China from previous studies
                                                                      (see Table S2 and Fig. S2) are also used in this study. It
                                                                      should be noted that model results sampled at those sites for
                                                                      comparison were simulated in the same months but differ-
                                                                      ent years while ignoring the uncertainties associated with the
                                                                      interannual variability.
                                                                         In addition, we also use observed hourly data of O3 and
                                                                      PM2.5 published by the China National Environmental Mon-
                                                                      itoring Center (CNEMC, http://www.cnemc.cn/sssj/, last ac-
                                                                      cess on 20 June 2021) to evaluate the model’s overall perfor-
                                                                      mance in China. The network was launched in 2013 as part
                                                                      of the Clean Air Action Plan and included ∼1500 stations
Figure 1. Annual emissions of (a) HCl, (b) Cl2 , and (c) non-         located in 370 cities by 2018 (Fig. S2).
sea-salt Cl− . Locations of the Northeast Plain, North China Plain,
Yangtze River Delta, Pearl River Delta, and Sichuan Basin are high-
lighted by red boxes in (a).

Atmos. Chem. Phys., 22, 3743–3762, 2022                                                https://doi.org/10.5194/acp-22-3743-2022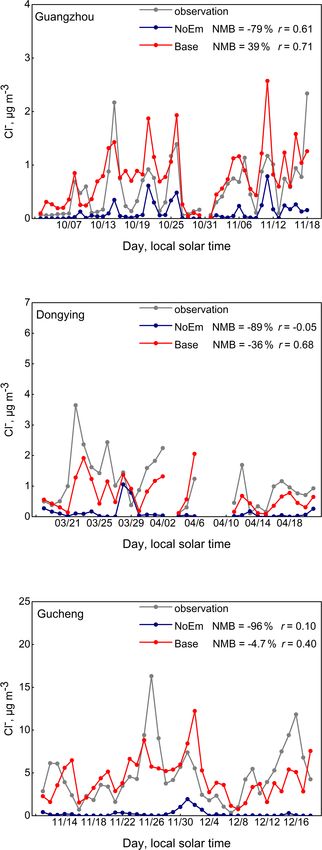
X. Yang et al.: The impact of chlorine chemistry combined with heterogeneous N2 O5 reactions on air quality                       3749

Table 2. Model setup of all simulation cases.

        Cases       N2 O5 uptake                           ClNO2 production             Other tropospheric   Anthropogenic and
                    (γN2 O5 )                              (ϕClNO2 )                    chlorine chemistry   biomass burning
                                                                                                             inorganic chlorine
                                                                                                             emissions
        Base        Yu et al. (2020)                       Yu et al. (2020)             Full                 Yes
        McDuffie    McDuffie et al. (2018a, b)             McDuffie et al. (2018a, b)   Full                 Yes
        NoEm        Yu et al. (2020)                       Yu et al. (2020)             Full                 None
        NoHet       Yu et al. (2020) but with [Cl− ] = 0   None                         Full                 Yes
        NoChem      Yu et al. (2020) but with [Cl− ] = 0   None                         None                 Yes
        NoEmHet     Yu et al. (2020) but with [Cl− ] = 0   None                         Full                 None
        NoAll       Yu et al. (2020) but with [Cl− ] = 0   None                         None                 None

3     Results and discussion                                            to 0.40–0.71 in the Base case. The significant improvement
                                                                        in the model performance again suggests sources other than
3.1    Improved model performance with updated chlorine                 SSA play a key role in Cl− concentrations in China.
       emissions and parameterizations for the                             The comparison between observed and simulated N2 O5
       heterogeneous N2 O5 + Cl chemistry                               (Fig. 3a) shows that NMB for the NoEm case is −58 %,
                                                                        150 %, 108 %, and 25 % at the Guangzhou, Wangdu,
Figure 2 shows time series of observed and simulated Cl−                Taizhou, and Mount Tai sites, respectively. In contrast, the
concentrations at the Guangzhou, Dongying, and Gucheng                  corresponding NMB for the Base case is much smaller,
sites. The observations show the lowest Cl− concentrations              −57 %, 48 %, 91 %, and 18 %, respectively. The improve-
at the Guangzhou site (0.55 ± 0.52 µg m−3 ), although the               ment in the Base case is apparent at most sites, implying that
site is the closest to the ocean among all three sites, while           additional chlorine emissions could effectively increase the
the highest concentrations (4.7 ± 3.3 µg m−3 ) are observed             uptake coefficient of N2 O5 in the Yu parameterization. As
at the Gucheng site, away from the sea. Moderate concen-                shown in Fig. S3, although the values of γN2 O5 between the
trations of Cl− are observed at the Dongying site, around               Base and NoEm cases are similar over the ocean, the Base
1.1 ± 0.82 µg m−3 . The relatively higher concentrations ob-            case has relatively higher γN2 O5 over China compared with
served inland again suggest the dominance of non-sea-salt               the NoEm case (0.016 vs. 0.014 on an annual mean basis).
Cl− in China, as mentioned before in the Introduction.                  Little improvement is found at the Guangzhou site (−58 % in
   The comparison between observations and simulated re-                the NoEm case vs. −57 % in the Base case). Previous stud-
sults from the NoEm case shows a serious underestimate                  ies also found an underestimation of N2 O5 in the Pearl River
of Cl− concentrations, with normalized mean bias (NMB)                  Delta, which could be partly explained by the underestima-
ranging from −96 % to −79 %, suggesting the missing of                  tion of the sources (e.g NO2 ) and/or the overestimation of the
significant chlorine sources in addition to sea salt chlo-              sink of N2 O5 there (Dai et al., 2020; Li et al., 2016).
rine. In contrast, the Base case with updated chlorine emis-               The N2 O5 results from the McDuffie case, which uses
sions exhibits much higher Cl− concentrations and can                   the McDuffie parameterization (a default setting in GEOS-
successfully reproduce observations, with average concen-               Chem; see Sects. 2.1.1 and 2.1.3) instead of the Yu param-
trations of 0.77 ± 0.54, 0.71 ± 0.52, and 4.5 ± 2.4 µg m−3              eterization are also shown in Fig. 3a. The NMB for the
(NMB = 39 %, −36 %, and −4.7 %) at the Guangzhou,                       McDuffie case is −53 %, 154 %, 143 %, and 37 % at the
Dongying, and Gucheng sites, respectively. The increase                 Guangzhou, Wangdu, Taizhou, and Mount Tai sites, respec-
in Cl− concentrations in the Base case compared with the                tively. The comparison between the McDuffie and Base cases
NoEm case is the most significant at the Gucheng site, by a             indicates that the Yu parameterization can reproduce ob-
factor of 24 (from 0.19 to 4.5 µg m−3 on average). The slight           served N2 O5 better in China in general, while the McDuffie
underestimates at the Dongying site in the Base case could be           parameterization tends to overestimate N2 O5 concentrations.
to some extent explained by the bias in GFED4, which under-             The overestimate of N2 O5 in the McDuffie parameteriza-
estimates emissions from agricultural fires due to their small          tion suggests the potential underestimate in the correspond-
size and short duration as suggested by the study of Zhang              ing γN2 O5 . As shown Fig. S3, the value of γN2 O5 from the
et al. (2020). In spite of that, the model with the Base case           McDuffie case is much smaller than that from the Base case
reproduces the overall distribution of the observed particu-            (0.0071 vs. 0.016 averaged over China).
late chloride concentrations in China well. The correlation                The underestimate in γN2 O5 from the McDuffie case could
coefficients (r) between observed and model results at the              to a large extent be explained by the suppressive effect of
three sites also increase from −0.05–0.61 in the NoEm case              organic coatings (γcoat ) as discussed above in Sect. 2.1.1.

https://doi.org/10.5194/acp-22-3743-2022                                                Atmos. Chem. Phys., 22, 3743–3762, 2022
3750 X. Yang et al.: The impact of chlorine chemistry combined with heterogeneous N2 O5 reactions on air quality
fect of organic coatings and consequently an underestimate
in the solubility and diffusivity of N2 O5 in organic matter
(Chang et al., 2016; Yu et al., 2020). Although γcoat in the
McDuffie parameterization is calculated as a function of or-
ganic aerosol O : C ratio and RH (see Eq. 2), which could
increase with higher RH and higher O : C ratio, it may still
overpredict the suppressive role of organic coatings in China.
On the other hand, the study by Yu et al. (2020) found that
excluding the organic coating best reproduced uptake coef-
ficients observed in China. In addition, the underestimate in
γN2 O5 in the McDuffie parameterization in China could also
be to some extent explained by the lack of the chloride en-
hancement (also discussed in Sect. 2.1.1). It is worth noting
that the evaluation here is specific to China, and the differ-
ences between the Yu and McDuffie parameterizations have
not been evaluated elsewhere.
For the comparison of ClNO2 (Fig. 3b), we use the mean
nighttime (excluding the data at a local time of 10:00–16:00)
maximum mixing ratio, as suggested by Wang et al. (2019).
Observed ClNO2 is high in Guangzhou (1121 pptv) and
Wangdu (∼ 990 pptv), followed by Changping (∼ 500 pptv)
and Beijing (∼ 430 pptv). The lowest concentrations are ob-
tained at Mount Tai and Tai Mo Shan (∼ 150 and 120 pptv,
respectively) due to relatively clean conditions at high al-
titude. The comparison between observed and simulated
ClNO2 at different sites also suggests a better model perfor-
mance for the Base case, with NMB in the range of −28 %–
22 %, compared with the NMB of −77 % to −31 % and
−59 % to −36 % for the NoEm and McDuffie cases, respec-
tively. The difference in ClNO2 concentrations is mainly as-
sociated with distinct ϕClNO2 values among different cases.
As shown in Fig. S4, the value of ϕClNO2 is significantly
higher in the Base case (0.36 averaged over China) than in
the NoEm (0.14) and McDuffie (0.11) cases. The large dif-
ference between the NoEm and Base cases again emphasizes
the important role of non-sea-salt chlorine in the formation
of ClNO2 . The overall underestimates in the McDuffie pa-
rameterization on the other hand may suggest that the scal-
ing factor of 0.25 applied to ϕClNO2 in Eq. (4) is too much
Figure 2. Time series of simulated and observed particulate Cl−
concentrations at the Guangzhou, Dongying, and Gucheng sites.
for the atmospheric condition in China. More field measure-
ments and model evaluations are required to come up with a
more precise parameterization better representing ϕClNO2 in
China.
The magnitude of the organic suppression is highly depen- Overall, with updated chlorine emissions and Yu parame-
dent on many factors (e.g., organic composition, particle terization for γN2 O5 and ϕClNO2 , the Base case agrees better
phase state) and thus remains poorly quantified (Griffiths with both the magnitude and the spatial variation in observed
et al., 2009; Gross et al., 2009; Thornton et al., 2003). Al- N2 O5 and ClNO2 in China. The differences in γN2 O5 and
though many studies have shown that organic aerosol can ϕClNO2 could also affect the ratios of ClNO2 to HNO3 . As
suppress the N2 O5 uptake (Anttila et al., 2006; Riemer et al., shown in Fig. S5, the value of ClNO2 /HNO3 is the highest
2009), the level of organic suppression may be overpredicted from the Base case (9.8 % averaged in China and up to 47 %
in the currently implemented parameterization attributed to in the Sichuan Basin on an annual mean basis), followed by
the poorly quantified and/or unknown factors (e.g., Morgan the McDuffie (4.7 % averaged in China and up to 18 % in the
et al., 2015). For example, some studies found that ignor- Sichuan Basin) and NoEm (3.1 % averaged in China and up
ing the difference between water-soluble and water-insoluble to 12 % in coastal regions) cases.
organics may lead to an upper limit for the suppressive ef-
Atmos. Chem. Phys., 22, 3743–3762, 2022 https://doi.org/10.5194/acp-22-3743-2022X. Yang et al.: The impact of chlorine chemistry combined with heterogeneous N2 O5 reactions on air quality 3751 Figure 3. Comparison of observed and simulated (a) averaged N2 O5 concentrations and (b) mean nighttime maximum mixing ratio of ClNO2 concentrations at different sites. The simulation definitions are provided in Table 2. GZ: Guangzhou; WD: Wangdu; TZ: Taizhou; Tai: Mount Tai; CP: Changping; BJ: Beijing; TMS: Tai Mo Shan. Figure 4. Annual mean surface concentrations of (a) MDA8 O3 and (b) PM2.5 over China in 2018. GEOS-Chem model values from the Base case are shown as contours. Observations from the China National Environmental Monitoring Center (CNEMC) are shown as circles. To further elucidate how the model behaves in reproduc- a similar range of r, the Base case tends to have a slightly ing the spatial distribution of ozone and PM2.5 through the smaller bias in general, with NMB of −26 % on an annual incorporation of the additional chlorine emissions and Yu pa- average (−49 % to −5.5 % on seasonal mean) vs. −28 % rameterization for the heterogeneous N2 O5 + Cl chemistry, (−54 % to −5.9 %) in the NoEm case and −27 % (−53 % simulated MDA8 O3 and PM2.5 from different cases were to −5.2 %) in the McDuffie case. For the comparison with compared with observations across China. Figure 4 shows observed PM2.5 , the NMB bias from the Base case is 3.6 % simulated annual mean MDA8 O3 and PM2.5 in 2018 in on an annual average (−6.3 %–28 % seasonal mean). Com- China from the Base case compared with the observations pared with the NoEm case, there is some improvement in from CNEMC (China National Environmental Monitoring summer (5.0 % vs. 3.9 %) and winter (−7.9 % vs. −4.3 %) Center, introduced in Sect. 2.2). The observed annual mean but slightly larger bias in autumn (26 % vs. 28 %). The Mc- MDA8 O3 and PM2.5 are 49 ppbv and 39 µg m−3 , respec- Duffie case on the other hand produces slightly higher PM2.5 tively, in 2018 in China. Model results from the Base case concentrations, with NMB of 5.6 %. Regarding the chemical could generally reproduce observed spatial and seasonal vari- compositions of PM2.5 (Table S3), although the model per- ations in annual mean MDA8 O3 and PM2.5 concentrations, formance varies with sites and species, the Base case demon- with NMB of −26 % and 3.6 % and r of 0.83 and 0.81, re- strates better agreement with observations compared with the spectively (Fig. S6). NoEm and McDuffie cases in general. Table 3 also summarized the model performance on both On the whole, the model performance is better with the ad- annual and seasonal scales regarding the simulation of O3 ditional anthropogenic and biomass burning chlorine emis- and PM2.5 from different cases. For the comparison with ob- sions combined with the Yu parameterization for the het- served MDA8 O3 , although different simulation cases show erogeneous N2 O5 + Cl chemistry. Therefore, the follow- https://doi.org/10.5194/acp-22-3743-2022 Atmos. Chem. Phys., 22, 3743–3762, 2022
3752 X. Yang et al.: The impact of chlorine chemistry combined with heterogeneous N2 O5 reactions on air quality
Table 3. Normalized mean bias (NMB) and correlation coefficients (r) between observed and simulated MDA8 O3 and PM2.5 concentrations
during 2018 in China.
Species Time Base McDuffie NoEm
NMB r NMB r NMB r
MDA8 O3 Annual −26 % 0.83 −27 % 0.83 −28 % 0.82
MAMa −35 % 0.87 −36 % 0.87 −36 % 0.87
JJAb −5.5 % 0.50 −5.2 % 0.48 −5.9 % 0.48
SONc −24 % 0.79 −26 % 0.78 −28 % 0.76
DJFd −49 % 0.81 −53 % 0.80 −54 % 0.80
PM2.5 Annual 3.6 % 0.81 5.6 % 0.81 2.3 % 0.80
MAM −6.3 % 0.52 −4.9 % 0.53 −6.2 % 0.52
JJA 3.9 % 0.70 4.6 % 0.70 5.0 % 0.70
SON 28 % 0.79 32 % 0.80 26 % 0.79
DJF −4.3 % 0.82 −2.6 % 0.82 −7.9 % 0.82
a March, April, and May (spring). b June, July, and August (summer). c September, October, and
November (autumn). d December, January, and February (winter).
ing investigation of the impacts of chlorine chemistry on face annual mean OH (Fig. S7b) and MDA8 O3 (Fig. 5c)
air quality in China as well as their sensitivities to chlo- by 3.8 × 10⁴ molec. cm−3 and 1.1 ppbv, respectively, aver-
rine emissions and parameterizations for the heterogeneous aged in China (up to 1.2 × 10⁵ molec. cm−3 and 4.5 ppbv,
N2 O5 + Cl chemistry is mainly based on the Base case. respectively in the Sichuan Basin). In contrast, annual mean
PM2.5 surface concentrations are decreased by 0.91 µg m−3
averaged in China (up to 7.9 µg m−3 in the Sichuan Basin),
3.2 Impacts of tropospheric chlorine chemistry on air mainly due to the decrease in NO− +
3 and NH4 (up to 6.4 and
quality and the role of the heterogeneous N2 O5 + Cl
1.9 µg m−3 , respectively), although SO2−
4 concentrations are
chemistry
increased slightly by up to 1.2 µg m−3 in the Sichuan Basin
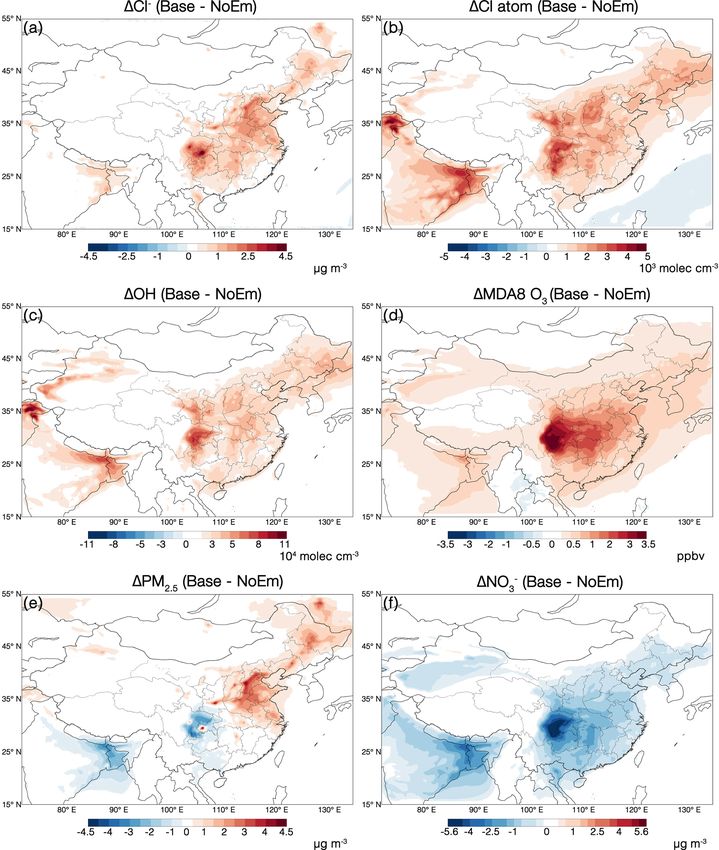
To comprehensively quantify the importance of chlorine (Fig. S7).
chemistry, we conducted a sensitivity case in which all Both global and regional studies suggested that the het-
related tropospheric chlorine chemistry was turned off erogeneous N2 O5 + Cl chemistry can enhance O3 produc-
(NoChem, also listed in Table 2). The differences be- tion through the production of Cl atoms and the recycling
tween the Base and NoChem cases (Figs. 5 and S7) of NOx (Li et al., 2016; Sarwar et al., 2014; Wang et al.,
could thus represent the impact of the chlorine chemistry. 2019). Therefore, we further investigate the role that the het-
The comparison shows that chlorine chemistry could in- erogeneous N2 O5 + Cl chemistry plays in tropospheric chlo-
crease annual mean nighttime max ClNO2 surface concen- rine chemistry through the comparison between the Base and
trations by 243 pptv averaged in China (up to 1548 pptv NoHet (Figs. 6 and S8) cases. Keep it in mind that the com-
in the Sichuan Basin). The increase in annual mean Cl parison mainly assesses the impact of ClNO2 production,
atoms is 1.7 × 10³ molec. cm−3 averaged in China (up to namely the uptake of N2 O5 on chloride aerosol, not the gen-
7 × 10³ molec. cm−3 in coastal regions). The increased Cl eral role of N2 O5 heterogeneous chemistry. The comparison
atoms could react with VOCs (especially alkanes), produc- illustrates that the heterogeneous N2 O5 + Cl chemistry could
ing more peroxy radicals, including organic peroxy radi- result in a significant production of ClNO2 , reaching 600–
cals (RO2 ) and hydroperoxyl radicals (HO2 ). As shown in 1400 pptv for annual mean nighttime max surface concen-
Fig. S7 (a), the chlorine chemistry could increase annual trations in the North China Plain and up to 1546 pptv in the
mean HO2 concentrations by 1.6 × 10⁶ molec. cm−3 aver- Sichuan Basin. The change in the surface concentrations of
aged in China (up to 8.6 × 10⁶ molec. cm−3 in the coastal Cl atoms (an annual mean increase of 1–4 × 10³ molec. cm−3
regions). In the presence of NO, the peroxy radicals recycle in central and eastern China) is mainly due to the photolysis
OH while they oxidize NO to NO2 . The subsequent photol- of ClNO2 and accounts for 74 % of total change in annual
ysis of NO2 could further lead to more O3 production and mean Cl atoms due to all tropospheric chlorine chemistry in
consequently also more OH (Osthoff et al., 2008; Riedel China, which is consistent with the results from the previous
et al., 2014; Simpson et al., 2015). On the other hand, the study by Liu et al. (2017).
recycling of NOx back into the atmosphere associated with In addition to the production of Cl atoms, the ClNO2
the photolysis of ClNO2 could also lead to more O3 pro- formation also affects the partitioning of NOy from HNO3
duction. The results here show a significant increase in sur- into more reactive forms (e.g., NOx and ClNO2 ) through
Atmos. Chem. Phys., 22, 3743–3762, 2022 https://doi.org/10.5194/acp-22-3743-2022X. Yang et al.: The impact of chlorine chemistry combined with heterogeneous N2 O5 reactions on air quality 3753 Figure 5. Effects of chlorine chemistry on annual mean surface concentrations of (a) nighttime max ClNO2 , (b) Cl atoms, (c) MDA8 O3 , and (d) PM2.5 in China, estimated as the differences between the Base and NoChem cases. the recycling of NOx and is therefore of great importance for 83 % of total change in annual mean MDA8 O3 due to all in atmospheric chemistry (Bertram et al., 2013; Li et al., tropospheric chlorine chemistry in China. It is interesting to 2016; S. Wang et al., 2020). To analyze the impact of the note that while MDA8 O3 surface concentrations show max- heterogeneous N2 O5 + Cl chemistry on NOy partitioning, ima in summer and minima in winter in general, the influence Fig. S9 shows the change in the ratios of NOx to NOy of the heterogeneous N2 O5 + Cl chemistry on O3 concentra- and NO− 3 to NOy as the difference between the Base and tions exhibits a different seasonality. The increase in seasonal NoHet cases. Since ClNO2 could be treated as a reservoir mean MDA8 O3 concentrations is the largest in winter (by up for reactive nitrogen at night, we include ClNO2 as part to 6.5 ppbv in the Sichuan Basin) but is less than 1.5 ppbv in of NOx in the calculation (NOx = NO + NO2 + ClNO2 and summer. This is because of more accumulation of N2 O5 and NOy + NO + NO2 + ClNO2 + HNO3 + 2 × N2 O5 + NO3 + ClNO2 in dark conditions in long winter nights (Sarwar et al., HONO + HNO4 + NO− 3 + various organic nitrates). The re- 2014). sults show that due to the ClNO2 production, the ratios of There is also an obvious decrease in the annual mean sur- NOx to NOy increase by 1.8 % averaged in China and up to face concentrations of PM2.5 attributed to the heterogeneous 5.4 % in the Sichuan Basin, Northeast Plain, and North China N2 O5 + Cl chemistry, ranging from 1.5 to 4.5 µg m−3 in cen- Plain on an annual mean basis. Meanwhile, the ratios of NO−3 tral and eastern China (accounting for 90 % of total change to NOy decrease by 1.1 % averaged in China and up to 5.1 % in annual mean PM2.5 due to all tropospheric chlorine chem- in the Sichuan Basin on an annual mean basis. istry in China). The decrease is more significant in autumn Consequently, the annual mean MDA8 O3 surface concen- and winter in China, with a range of 3.5–5.5 µg m−3 in cen- trations are increased by 1.5–3 ppbv in central and eastern tral and eastern China and up to 11 µg m−3 in the Sichuan China and up to 3.8 ppbv in the Sichuan Basin, accounting Basin. In contrast, the decrease in PM2.5 is less than 2 µg m−3 https://doi.org/10.5194/acp-22-3743-2022 Atmos. Chem. Phys., 22, 3743–3762, 2022
3754         X. Yang et al.: The impact of chlorine chemistry combined with heterogeneous N2 O5 reactions on air quality

Figure 6. Effects of the heterogeneous N2 O5 + Cl chemistry on annual mean surface concentrations of (a) nighttime max ClNO2 , (b) Cl
atom, (c) MDA8 O3 , and (d) PM2.5 in China, estimated as the differences between the Base and NoHet cases.

in summer in China. The change in PM2.5 is mainly due to             crease is probably associated with Cl atoms from photolysis
the decrease in NO−3 (up to 6.2 µg m
                                     −3 in the Sichuan Basin         of gas-phase chlorine, especially non-sea-salt Cl2 in inland
on an annual average). In addition, NH+ 4 is also decreased by       China, while the decrease at coastal regions is mainly due
up to 1.8 µg m−3 in the Sichuan Basin annually on average,           to catalytic production of bromine and iodine radicals origi-
following the pattern of 1NO−  3 . This is because NH3 is in         nating from sea salt aerosols. The comparison demonstrates
excess in most regions in China (Xu et al., 2019), and the           the dominance of the heterogeneous N2 O5 + Cl chemistry in
formation of ClNO2 via Reaction (R2) could hinder the for-           total tropospheric chlorine chemistry in China.
mation of HNO3 and shift the partitioning between NH3 and
NH+                                            −         +
    4 towards NH3 . Unlike the change in NO3 and NH4 , the
heterogeneous N2 O5 + Cl chemistry increases surface SO2−            3.3   The effect of heterogeneous N2 O5 + Cl chemistry in
                                                            4
concentration slightly, which could be explained by the en-                response to chlorine emissions
hancements of atmospheric oxidation associated with the in-          Since both γN2 O5 and ϕClNO2 in the Yu parameterization are
crease in Cl atoms, OH, and O3 , facilitating the formation of       highly dependent on [Cl− ], the effect of the heterogeneous
secondary aerosols (Sarwar et al., 2014).                            N2 O5 + Cl chemistry on air quality is thus sensitive to chlo-
   On the other hand, the effect of tropospheric chlorine            rine emissions. Figure 7 shows the effects of the additional
chemistry without the heterogeneous N2 O5 + Cl chemistry is          chlorine emissions from anthropogenic and biomass burn-
much smaller (Fig. S10, the comparison between the NoHet             ing sources on annual mean surface concentrations of dif-
and NoChem cases), leading to an increase of up to 0.7 ppbv          ferent species (Cl− , Cl atoms, OH, MDA8 O3 , PM2.5 , and
in inland China and a decrease of 0.3–0.5 ppbv in coastal            NO− 3 ) in China, calculated as the differences between the
regions for annual mean MDA8 O3 concentrations. The in-              Base and the NoEm cases. With the implementation of the

Atmos. Chem. Phys., 22, 3743–3762, 2022                                               https://doi.org/10.5194/acp-22-3743-2022
X. Yang et al.: The impact of chlorine chemistry combined with heterogeneous N2 O5 reactions on air quality 3755
Figure 7. Effects of anthropogenic and biomass burning chlorine emissions on annual mean surface concentrations of (a) Cl− , (b) Cl atoms,
(c) OH, (d) MDA8 O3 , (e) PM2.5 , and (f) NO−
3 in China, estimated as the differences between the Base and NoEm cases.
additional chlorine emissions, the particulate Cl− concentra- The spatial distribution of 1Cl atoms is also consistent with
tion increased significantly in inland China, with the largest that of the additional chlorine emissions and 1Cl− , show-
increase in the Sichuan Basin (4.5 µg m−3 ) and little change ing the largest increment in the Sichuan Basin (about 4.5–
in west China. The increase is in the range of 1.5–3.5 µg m−3 5 × 10³ molec. cm−3 ). There is also a moderate increase in
in the North China Plain and3756 X. Yang et al.: The impact of chlorine chemistry combined with heterogeneous N2 O5 reactions on air quality a range of 1.5–4 × 10³ molec. cm−3 . Only a minor increase It is worth mentioning that the effects of the additional in Cl atoms is found in south China (< 1 × 10³ molec. cm−3 ). chlorine emissions work mainly through the heterogeneous As discussed earlier in Sect. 3.2, increased Cl atoms could N2 O5 + Cl chemistry. Without this heterogeneous chemistry, lead to more HO2 and OH via VOC oxidation. Combined the increase in chlorine emissions shows only a minor change with increased NOx associated with the release of NO2 upon in Cl atoms (
X. Yang et al.: The impact of chlorine chemistry combined with heterogeneous N2 O5 reactions on air quality                         3757

Figure 8. Effects of different parameterizations on annual mean surface concentrations of (a) nighttime max ClNO2 , (b) Cl atoms, (c) MDA8
O3 , (d) PM2.5 , and (e) NO−
                           3 in China, estimated as the differences between the Base and McDuffie cases.

The little dependence of γN2 O5 on concentrations of Cl− to-           emission. Consequently, the McDuffie case produces less
gether with the lower value of ϕClNO2 make the results from            O3 , with annual mean surface concentrations of MDA8 O3
the McDuffie case less sensitive to chlorine emissions, pro-           lower by 0.47 ppbv averaged in China (by up to 2 ppbv in the
ducing fewer ClNO2 and Cl atoms compared with the Base                 Sichuan Basin) but results in more PM2.5 (0.63 µg m−3 av-
case (with the Yu parameterization), although with the same            eraged in China and up to 4.7 µg m−3 in the Sichuan Basin

https://doi.org/10.5194/acp-22-3743-2022                                                Atmos. Chem. Phys., 22, 3743–3762, 2022
3758 X. Yang et al.: The impact of chlorine chemistry combined with heterogeneous N2 O5 reactions on air quality
on an annual mean basis mainly due to changes in NO− 3) the decrease in NO− 3 due to the competition between the
(Fig. 8). In other words, compared to the Base case with the formation of ClNO2 and HNO3 upon the uptake of N2 O5
Yu parameterization, the impacts of chlorine emissions on on aerosol surfaces. The additional emissions also increase
annual MDA8 O3 and PM2.5 in the McDuffie case have been Cl atoms and OH in China associated with the photolysis
decreased by 48 % and 27 %, respectively, averaged in China. of ClNO2 , consequently leading to an increase in annual
Therefore, even with the same amounts of chlorine emis- mean MDA8 O3 concentrations by up to 3.5 ppbv. In con-
sions, the impacts of the heterogeneous N2 O5 + Cl chemistry trast, the significance of the heterogeneous N2 O5 + Cl chem-
on air quality vary significantly with different parameteriza- istry, especially over inland China, would be severely under-
tions. estimated if only sea salt chlorine is considered, with only
a slight increase in MDA8 O3 (X. Yang et al.: The impact of chlorine chemistry combined with heterogeneous N2 O5 reactions on air quality 3759
the Guangdong Natural Science Funds for Distinguished Young 236, 117604, https://doi.org/10.1016/j.atmosenv.2020.117604,
Scholar (grant no. 2018B030306037). 2020.
DeCarlo, P. F., Kimmel, J. R., Trimborn, A., Northway,
M. J., Jayne, J. T., Aiken, A. C., Gonin, M., Fuhrer,
Review statement. This paper was edited by Steven Brown and K., Horvath, T., Docherty, K. S., Worsnop, D. R., and
reviewed by Erin E. McDuffie and one anonymous referee. Jimenez, J. L.: Field-Deployable, High-Resolution, Time-of-
Flight Aerosol Mass Spectrometer, Anal. Chem., 78, 8281–8289,
https://doi.org/10.1021/ac061249n, 2006.
Finlayson-Pitts, B. J., Ezell, M. J., and Pitts, J. N. J.: Formation
of chemically active chlorine compounds by reactions of atmo-
References spheric NaCl particles with gaseous N2 O5 and ClONO2 , Chem-
inform, 20, 241–244, 1989.
Anttila, T., Kiendler-Scharr, A., Tillmann, R., and Mentel, T. F.: Fountoukis, C. and Nenes, A.: ISORROPIA II: a computa-
On the Reactive Uptake of Gaseous Compounds by Organic- tionally efficient thermodynamic equilibrium model for K+ –
2−
Coated Aqueous Aerosols: Theoretical Analysis and Application Ca2+ –Mg2+ –NH+ + − −
4 –Na –SO4 –NO3 –Cl –H2 O aerosols, At-
to the Heterogeneous Hydrolysis of N2 O5 , J. Phys. Chem. A, mos. Chem. Phys., 7, 4639–4659, https://doi.org/10.5194/acp-7-
110, 10435–10443, https://doi.org/10.1021/jp062403c, 2006.. 4639-2007, 2007.
Atkinson, R., Baulch, D. L., Cox, R. A., Crowley, J. N., Hamp- Fu, X., Wang, T., Wang, S., Zhang, L., Cai, S., Xing, J., and Hao, J.:
son, R. F., Hynes, R. G., Jenkin, M. E., Rossi, M. J., Troe, J., Anthropogenic Emissions of Hydrogen Chloride and Fine Partic-
and IUPAC Subcommittee: Evaluated kinetic and photochemi- ulate Chloride in China, Environ. Sci. Technol., 52, 1644–1654,
cal data for atmospheric chemistry: Volume II – gas phase re- https://doi.org/10.1021/acs.est.7b05030, 2018.
actions of organic species, Atmos. Chem. Phys., 6, 3625–4055, Geng, G., Zhang, Q., Martin, R. V., Van Donkelaar, A., Huo, H.,
https://doi.org/10.5194/acp-6-3625-2006, 2006. Che, H., Lin, J., and He, K.: Estimating long-term PM2.5 concen-
Bertram, T. H. and Thornton, J. A.: Toward a general parameteriza- trations in China using satellite-based aerosol optical depth and a
tion of N2 O5 reactivity on aqueous particles: the competing ef- chemical transport model, Remote Sens. Environ., 166, 262–270,
fects of particle liquid water, nitrate and chloride, Atmos. Chem. 2015.
Phys., 9, 8351–8363, https://doi.org/10.5194/acp-9-8351-2009, Griffiths, P. T., Badger, C. L., Cox, R. A., Folkers, M., Henk, H. H.,
2009. and Mentel, T. F.: Reactive Uptake of N2 O5 by Aerosols Con-
Bertram, T. H., Perring, A. E., Wooldridge, P. J., Dibb, J., Av- taining Dicarboxylic Acids. Effect of Particle Phase, Composi-
ery, M. A., and Cohen, R. C.: On the export of reactive ni- tion, and Nitrate Content, J. Phys. Chem. A, 113, 5082–5090,
trogen from Asia: NOx partitioning and effects on ozone, At- https://doi.org/10.1021/jp8096814, 2009.
mos. Chem. Phys., 13, 4617–4630, https://doi.org/10.5194/acp- Gross, S., Iannone, R., Xiao, S., and Bertram, A. K.: Reac-
13-4617-2013, 2013. tive uptake studies of NO3 and N2 O5 on alkenoic acid,
Chang, W. L., Brown, S. S., Stutz, J., Middlebrook, A. M., Bahreini, alkanoate, and polyalcohol substrates to probe nighttime
R., Wagner, N. L., Dubé, W. P., Pollack, I. B., Ryerson, T. B., aerosol chemistry, Phys. Chem. Chem. Phys., 11, 7792–7803,
and Riemer, N.: Evaluating N2 O5 heterogeneous hydrolysis pa- https://doi.org/10.1039/B904741G, 2009.
rameterizations for CalNex 2010, J. Geophys. Res.-Atmos., 121, Guenther, A., Karl, T., Harley, P., Wiedinmyer, C., Palmer, P.
5051–5070, https://doi.org/10.1002/2015JD024737, 2016. I., and Geron, C.: Estimates of global terrestrial isoprene
Chen, C., Zhang, H., Yan, W., Wu, N., Zhang, Q., and He, K.: emissions using MEGAN (Model of Emissions of Gases and
Aerosol water content enhancement leads to changes in the major Aerosols from Nature), Atmos. Chem. Phys., 6, 3181–3210,
formation mechanisms of nitrate and secondary organic aerosols https://doi.org/10.5194/acp-6-3181-2006, 2006.
in winter over the North China Plain, Environ. Pollut., 287, Haskins, J. D., Lee, B. H., Lopez-Hilifiker, F. D., Peng, Q., Jaeglé,
117625, https://doi.org/10.1016/j.envpol.2021.117625, 2021. L., Reeves, J. M., Schroder, J. C., Campuzano-Jost, P., Fibiger,
Chen, W., Ye, Y., Hu, W., Zhou, H., Pan, T., Wang, Y., Song, D., McDuffie, E. E., Jiménez, J. L., Brown, S. S., and Thornton,
W., Song, Q., Ye, C., Wang, C., Wang, B., Huang, S., Yuan, J. A.: Observational Constraints on the Formation of Cl2 From
B., Zhu, M., Lian, X., Zhang, G., Bi, X., Jiang, F., Liu, J., the Reactive Uptake of ClNO2 on Aerosols in the Polluted Ma-
Canonaco, F., Prevot, A. S. H., Shao, M., and Wang, X.: rine Boundary Layer, J. Geophys. Res.-Atmos., 124, 8851–8869,
Real-Time Characterization of Aerosol Compositions, Sources, https://doi.org/10.1029/2019JD030627, 2019.
and Aging Processes in Guangzhou During PRIDE-GBA 2018 Hong, Y., Liu, Y., Chen, X., Fan, Q., Chen, C., Chen,
Campaign, J. Geophys. Res.-Atmos., 126, e2021JD035114, X., and Wang, M.: The role of anthropogenic chlorine
https://doi.org/10.1029/2021JD035114, 2021. emission in surface ozone formation during different sea-
Choi, M. S., Qiu, X., Zhang, J., Wang, S., Li, X., Sun, Y., Chen, sons over eastern China, Sci. Total Environ., 723, 137697,
J., and Ying, Q.: Study of Secondary Organic Aerosol Forma- https://doi.org/10.1016/j.scitotenv.2020.137697, 2020.
tion from Chlorine Radical-Initiated Oxidation of Volatile Or- Hossaini, R., Chipperfield, M. P., Saiz-Lopez, A., Fernandez,
ganic Compounds in a Polluted Atmosphere Using a 3D Chem- R., Monks, S., Feng, W., Brauer, P., and von Glasow,
ical Transport Model, Environ. Sci. Technol., 54, 13409–13418, R.: A global model of tropospheric chlorine chemistry:
https://doi.org/10.1021/acs.est.0c02958, 2020. Organic versus inorganic sources and impact on methane
Dai, J., Liu, Y., Wang, P., Fu, X., Xia, M., and Wang, T.: The impact oxidation, J. Geophys. Res.-Atmos., 121, 14,271-214,297,
of sea-salt chloride on ozone through heterogeneous reaction https://doi.org/10.1002/2016JD025756, 2016.
with N2 O5 in a coastal region of south China, Atmos. Environ.,
https://doi.org/10.5194/acp-22-3743-2022 Atmos. Chem. Phys., 22, 3743–3762, 2022You can also read