The Gulf of Mexico Harmful Algal Bloom Forecast Revised 05/03/2021
←
→
Page content transcription
If your browser does not render page correctly, please read the page content below
The Gulf of Mexico Harmful Algal Bloom Forecast                           Revised 05/03/2021
Providing information and forecasts on Karenia brevis (red tide) in the Gulf of Mexico

                                                                                       Alert statement on current
                                                                                       respiratory irritation conditions,
                                                                                       bloom location and extent, and
                                                                                       likelihood of intensification.

                                                                                 Real-Time view (i.e. current
                                                                                 conditions) of the risk of respiratory
                                                                                 irritation, bloom location and extent
                                                                                 and likelihood of intensification.

                                                                                 Click on the “View Product” buttons
                                                                                 for detailed information on the
                                                                                 respiratory forecasts for the next 30
                                                                                 hrs; the likelihood of intensification;
                                                                                 and the position of the bloom based
                                                                                 on chlorophyll fluorescence imagery
                                                                                 and cell counts information.
The Respiratory Forecast provides an estimate of the risk of respiratory irritation at individual beaches over the next 30 hours. It is updated every 3 hours. The marker pins show where we have data and their color shows the expected condition now. More info on the legend opens a page that explains the respiratory risk potential, which is based on K. brevis cell concentration, wind direction and wind speed Click on a marker pin to get a popup for the forecast at each beach for every 3 hrs. The colors and labels in the popup match the legend. Wind dir(direction) is the direction that the wind blows from (the direction you are facing when you feel the wind on your face).
Forecast of Initial Intensification of the bloom along the coast
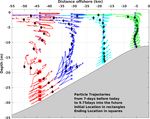
The Intensification Forecast is based on modeled circulation of the Gulf. Offshore winds push surface water offshore, which causes water near
the bottom to move toward the coast, and come up at the shore, called “upwelling”. Karenia usually starts growing near the bottom offshore.
Upwelling is responsible for bloom formation and intensification at the coast when the bloom is developing.

                                                                                                     Background Cell Concentration (Cells/L)
                                                                                                                                                 Onshore excursion due to upwelling (km)

                                                                                                     Model to determine whether
 Animation shows the movement of                     Observed and modeled (purple                    intensification is likely. The location
 particles (K. brevis cells) onshore and             dashed box) winds. Lines point to the           of the filled circle shows likely
 offshore at different depth layers.                 direction the wind is blowing to.               intensification based on the onshore
 Blue boxes show the starting point                                                                  movement and cell concentration.
 and black diamonds the final position.
                                                                                                                                               Movement toward the coast
 Upwelling favorable winds from the
                                                                                                                                               (positive) and offshore
 north drive surface water offshore,
                                                                                                                                               (negative). >10 km is somewhat
 bring cells to the coast in the bottom
                                                                                                                                               favorable; >20 km moderately
 waters. “0” distance represents the
                                                                                                                                               favorable; and >30 km highly
 location at the beach.
                                                                                                                                               favorable.
Satellite imagery showing fluorescence
caused by chlorophyll-a. The algorithm is
not specific to K. brevis, but K. brevis is
the most common algae on the SW
Florida coast.
Zoom in (+) Layers box
Colored circles show K. brevis cell
concentrations in seawater samples or out (-)
(from several sources), provide more
information, and help confirm the
presence of blooms.
The layers box on the top right allows you
to turn off and on cell counts, imagery or
the masks which hide areas where K.
brevis is unlikely to occur.
If you click on a circle, the date and
source is shown. If you click elsewhere,
you get the latitude and longitude of the
center of the “hand” that you are using
to scroll around the window.Other Current Information The bottom boxes provide links to current information from other sources. Unlike, the top row of tools, the images shown here are examples, and do not show current conditions. The Beach Conditions Reporting System at Mote Marine Lab provides nearly daily (or twice daily) reports of various conditions at the beach, including respiratory irritation, waves, water color, etc. The State of Florida Observations gives current Red Tide Status, and links to additional maps and graphics
You can also read


