The Growing Infrastructure Crisis: The Challenge of Scour Risk Assessment and the Development of a New Sensing System
←
→
Page content transcription
If your browser does not render page correctly, please read the page content below
infrastructures
Article
The Growing Infrastructure Crisis: The Challenge of Scour Risk
Assessment and the Development of a New Sensing System
Panagiotis Michalis *                and Elizabeth Vintzileou

                                          School of Civil Engineering, National Technical University of Athens, 15773 Athens, Greece;
                                          elvintz@central.ntua.gr
                                          * Correspondence: pmichalis@mail.ntua.gr

                                          Abstract: Scour action is one of the main factors that add significant stress to the growing infras-
                                          tructure crisis as it is considered one of the most destructive flood-related hazards occurring around
                                          underwater foundation elements. Recent cases of bridge failures have highlighted the need for a
                                          reliable scour monitoring and early warning system to assess flood and geo-hazards in real-time,
                                          providing advanced key info for repair and maintenance actions. Despite the past efforts to provide
                                          such a system for scour assessment, most of the developed instruments were not able to offer a reliable
                                          solution for scour monitoring, due to technical and cost issues. As a result, there currently exists a
                                          gap in the knowledge and understanding of scour mechanism during flood incidents. This study
                                          presents the development of a new sensing system to assess hydro-hazards at bridge infrastructure. It
                                          initially focuses on factors contributing to the growing infrastructure crisis and provides an overview
                                          of the current practices and assessment procedures to assess scour processes and a summary of
                                          advantages and limitations of existing monitoring efforts. A new monitoring concept for assessing
                                          scour and sediment deposition processes is then presented focusing on modelling the geometric
                                          components of a new sensor which is evaluated in simulations under different environments that
                                          represent prospective field conditions. Main results are analysed and presented focusing on key
Citation: Michalis, P.; Vintzileou, E.
                                          criteria that maximize sensitivity of the sensor to scour and sedimentation processes. The obtained
The Growing Infrastructure Crisis:
The Challenge of Scour Risk
                                          results indicate that the sensor has the potential to provide a new monitoring device for scour and
Assessment and the Development of         sediment deposition monitoring, and it is proposed to be further developed and assessed in labo-
a New Sensing System. Infrastructures     ratory and field conditions. This study aspires to contribute to the ongoing discourse on the use of
2022, 7, 68. https://doi.org/10.3390/     sensing techniques to monitor, assess, and manage scour action effectively.
infrastructures7050068
                                          Keywords: critical infrastructure; climatic risks; bridges; scour; ageing structures; sensor; structural
Academic Editor: Sakdirat
Kaewunruen
                                          health monitoring; modelling; floods; asset management

Received: 5 March 2022
Accepted: 19 April 2022
Published: 5 May 2022                     1. Introduction
Publisher’s Note: MDPI stays neutral           Critical transportation infrastructure is one of the socio-economic backbones of our
with regard to jurisdictional claims in   society. However, nowadays several factors exist that amplify and contribute to the existing
published maps and institutional affil-   growing infrastructure crisis:
iations.
                                          •    Ageing infrastructure: The main bridge stock of the Trans-European Transport Net-
                                               work (TEN-T) presents a major issue for European countries. For example, 47% of
                                               bridges in Germany are more than 40 years old with an estimated deficiency rate at
Copyright: © 2022 by the authors.
                                               37%, while in France and UK, the estimated number of bridges is 233,500 and 155,000
Licensee MDPI, Basel, Switzerland.             with the rate of defects at 39% and 30%, respectively [1]. Similarly, in the US, the 2020
This article is an open access article         infrastructure report card published by the American Society of Civil Engineers (ASCE)
distributed under the terms and                estimated that almost 42% of more than 617,000 bridges have exceeded their conven-
conditions of the Creative Commons             tional 50-year design lifespan, while 7.5% of bridge stock is designated as structurally
Attribution (CC BY) license (https://          deficient [2]. The ageing critical infrastructure indicates that an increasing number of
creativecommons.org/licenses/by/               bridges will soon need major rehabilitation or retirement. In many instances, countries
4.0/).                                         lack modern databases and of knowledge about the population of bridges [3], while

Infrastructures 2022, 7, 68. https://doi.org/10.3390/infrastructures7050068                            https://www.mdpi.com/journal/infrastructures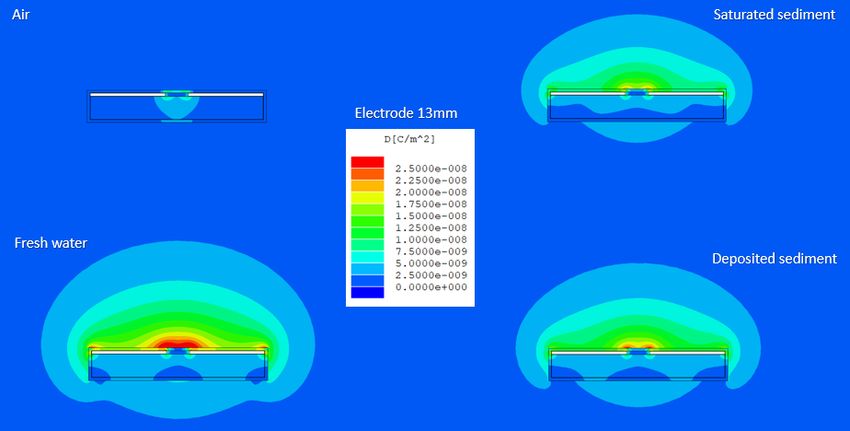
Infrastructures 2022, 7, 68                                                                                            2 of 16

                                   in many occasions the ‘as built’ information of these ageing structures is also not
                                   available. Bridge stock is also owned and managed by various bodies using different
                                   management practices [4] and various asset management systems [5], which makes
                                   their condition assessment a challenging issue. As a result, countries need to urgently
                                   address maintenance and rehabilitation issues to ensure resilience, serviceability and
                                   safety of ageing transportation network [6,7].
                              •    Shifting extreme climatic conditions: In view of climate change predictions [8,9] which
                                   anticipate an increase in the intensity of precipitation, bridge failures are also expected
                                   to increase due to more frequent or intense flooding. Bridge collapse-inducing flow
                                   return periods also vary considerably and are often frequently lower than values
                                   considered in many climate impact assessments [10]. As a result, the existing methods
                                   that incorporate flood risk into bridge design methods do not capture significant
                                   variability associated with collapse return periods.
                              •    ‘Living’ rivers: Around 82% of the bridges’ cross waterways are anticipated to change
                                   morphologically due to their dynamic nature during their lifetime. Soil erosion,
                                   sediment transport and deposition processes pose a major threat to infrastructure
                                   constructed over ‘living’ rivers. As a result of these processes occurring in river
                                   environment, the predominant mode of bridge failures worldwide is considered the
                                   combination of flooding and scour effects [11].
                              •    Socio-economic impact: Hazards associated with highly disruptive and cascading inci-
                                   dents on critical infrastructure systems have major social and economic impact for the
                                   general public, the affected regions but also the maintainers and asset owners [12,13].
                                   The direct cost of a bridge failure alone is estimated to be two or three times greater
                                   compared to the original cost of the bridge [14]. However, the indirect costs of struc-
                                   tural failures suffered by the public, business and industry have estimated to be five
                                   times greater than the direct costs of bridge repair [15].
                                    Scour processes therefore pose an important threat to bridge stock as it is expected to
                              occur at most of the hydraulic structures during their service life [16]. This is highlighted
                              by major incidents of bridge failures, associated with fatalities, disruption and significant
                              direct and indirect costs, as a result of the lack of reliable methods to quantify scour depth
                              at structures. In Europe, this has been evidenced by the cases of the Malahide Viaduct
                              failure (Ireland, 2009), the closure of more than 15 bridges in Cumbria (England, 2009)
                              during a period of extensive floods, and the Hintze Ribeiro bridge failure (Portugal, 2001)
                              with 59 fatalities. In Greece, with an estimated number of 17,000 bridges [17], scour has
                              also been the main reason of many structural collapses that led to major disruption of the
                              transport network. Recent cases include: the railway bridge over Ksirias stream (Magnisia
                              region, 2006); a bridge on the Athens-Thessaloniki motorway over Ziliana stream (Pieria
                              region, 2008); Diava bridge over Pineios river (Kalabaka region, 2016); a bridge failure
                              over Kompsato river (Rodopi region, 2017); more than 10 bridge collapses in major flood
                              events in Karditsa region during 2020. Scour processes triggered by extensive flooding
                              has also been the main issue resulting in degradation of cultural monuments such as the
                              high-profile collapse of 18th-century Plaka Bridge over Arachthos river (Arta region, 2015),
                              the third largest one-arch stone bridge in Europe.
                                    These incidents highlight the fact that scour and its combined effect with other hazards
                              can substantially increase bridge risk [4] and cause catastrophic bridge failures, occasionally
                              without prior visual warning. At the same time, they indicate the limitations of the current
                              inspection practices to assess erosion processes. Consequently, scour hazard leads to
                              destructive direct consequences for infrastructure owners/insurers/maintainers due to
                              high direct costs associated with bridge repair and replacement [18].
                                    The main motivation of this work is to explore the development of a new sensing
                              instrument to assess scour risk and potentially fulfil a useful role for cost-effective man-
                              agement of scour susceptible structures. The optimization of the new sensor geometric
                              characteristics is presented for the first time in this study, which can enable continuous
                              monitoring of both scour and sediment deposition conditions at bridge sites. The remainder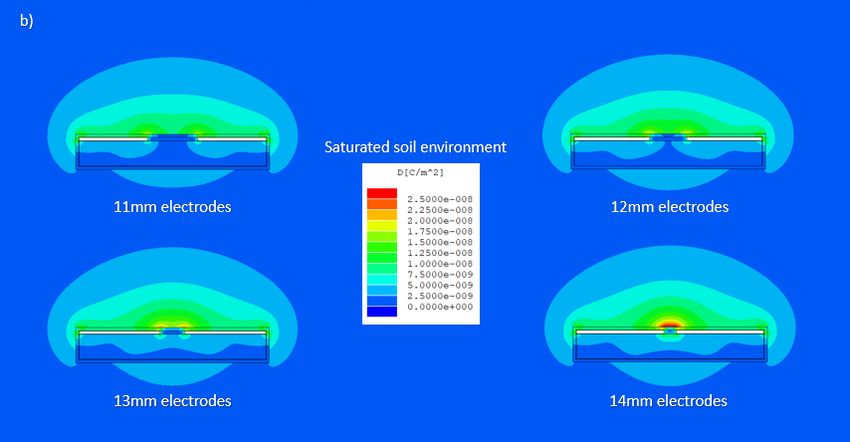
Infrastructures 2022, 7, 68                                                                                            3 of 16

                              of this article is structured as follows: Section 2 focuses on the identification of the main
                              issues that arise from the current scour assessment practice and provides and overview of
                              the advantages and limitations of the existing monitoring procedures. Section 3 presents
                              the monitoring concept, measuring principle and conceptual application of the sensor. The
                              main investigation presented in Section 4 focuses on the development of a new sensor for
                              assessing scour and sediment deposition processes. Finite element modelling (FEM) is
                              performed to define and assess key criteria that maximise the sensitivity of the sensor to
                              scour and sedimentation processes, such as extend and magnitude of generated electrostatic
                              field between sensor electrodes, capacitance obtained in various simulated conditions and
                              ability to monitor target processes. Finally, Section 5 presents recommendations for future
                              research followed by the conclusions.

                              2. Overview of Scour and Backfilling Processes
                                   Scour is a natural phenomenon that involves the interaction between hydraulic condi-
                              tions and mobile erodible bed materials. Short-term scour is caused by single flash floods
                              with high intensity, which is difficult to estimate as a result of limited existing information
                              with regard to rates of natural scour [19] due a to lack of complete field datasets. The
                              eroded areas start to be re-filled again (i.e., backfilling process) as the flow reduces [20].
                              However, scour is a time-dependent process and continues to develop after the peak of a
                              flood. The need to obtain real-time information about the scour evolution during flood
                              events is therefore critical.

                              2.1. Scour Assessment and Monitoring Procedures
                                    Monitoring is an important tool in the assessment of the ongoing performance of criti-
                              cal infrastructure [21]. Although it does not offer a solution to problems directly associated
                              with scour at hydraulic and marine structures, monitoring can provide advanced warning
                              for the public safety and collect data from the field necessary to provide a critical insight
                              about the evolution of the scour mechanism. This enables proactive asset management
                              including strategic maintenance actions and prioritisation of human resources, but it also
                              leads to improved scour mitigation strategies and resilience to climatic hazards.
                                    Over the past decades, several efforts [22–34] focused on the development and applica-
                              tion of scour monitoring techniques. These are based on Sonar, Time-Domain Reflectometry
                              (TDR), passive Radio frequency identification (RFID) technology, Ground Penetrating
                              Radar (GPR), and vibration-based methods to provide real-time assessment of scour con-
                              ditions around structural elements. Recent studies [33,34] also investigated, for the first
                              time, the Amplitude Domain Reflectometry (ADR) method, which successfully measured
                              scour and sediment deposition processes. However, the majority of these methods have
                              not managed to establish a reliable and efficient solution for scour monitoring addressing
                              the wide course of scour challenges. The main limitations of the developed techniques are
                              mainly due to the high cost, the complexity of the equipment, the capability of providing
                              repeatable and reliable information, the complicated data interpretation, and the harsh
                              environmental conditions [35]. An overview and assessment of the main existing scour
                              monitoring methods alongside with advantages and limitations is presented in Table 1.
Infrastructures 2022, 7, 68 4 of 16
Table 1. Overview of main monitoring methods employed to detect both scour and backfill processes.
Scour Method Assessment Advantages Limitations
Limited use by depth, velocity—Debris/Ice
Physical probes [36] Direct Effective in fast and shallow water
impact—Personnel required
Debris/Ice impact—Transducer
Sonar devices [36] Direct Continuous scour monitoring
frequency—Beam width
Issues with clays/saltwater
Ground Penetrating Radar
Direct Continuous record of riverbed conditions—High cost/complex
(GPR) [27]
equipment—Trained personnel
Real-time monitoring of scour and Not yet tested in the field (Results based on
MEMS sensors [37] Direct
deposition height. laboratory environment)
High maintenance cost—Not able to detect
Magnetic Collar [20] Direct Easy to operate—Low cost
deposition—Excavation of riverbed
Not real-time application—High
Steel Rod [20] Direct Easy to operate—Low cost
maintenance cost—Excavation of riverbed
Commercially
Numbered Brick Column Not able to detect deposition—Not real-time
Indirect available—Applicable during high
[38] application—Excavation of riverbed
floods
No continuous field data—Sensor battery
Buried Orientation Low cost—Automatic transmission
Indirect life—Debris impact when
Sensors [39] of wireless signals
floating—Excavation of riverbed
Optical-Fibre-based Real-time monitoring—Resistance
Direct Installation issues—More field tests required
Sensors [40] to environmental corrosion
Time Domain Real-time application—Continuous Complicated signal interpretation—Cable
Direct
Reflectometry (TDR) [25] data during high floods length—Expensive system
Cost effective and robust
Reduction in the signal over
Smart Rocks [41] Direct method—Can be deployed easily to
distance—Sensor battery life
structures
Diving [42] Indirect N/A Not reliable method—Safety considerations
Detection of both scour and
Amplitude Domain Not monitoring of scour along the probe
sediment deposition
Reflectometry (ADR) Direct length but at predetermined
processes—Soil density
sensor [33,34] locations—Debris impact
information—Real-time application
Cannot provide continuous
Passive Scour Chain
Indirect No maintenance required data—Excavation of riverbed—Not reliable
System [43]
method
Not able to detect deposition—Need to
Brisco System [43] Direct Commercially available
attach the device on the structure
Commercially
Difficult to be installed at existing
Tell-Tail System [20] Direct available—Continuous monitoring
structures–Durability of the sensors
of scour and deposition
Seismic Survey (PSS, Determination of both scour and Not real-time monitoring—Cannot be used
Indirect
RPSS) [44] foundation depth—Low cost during flood events—Trained personnel
Pneumatic Detection Can be implemented under extreme
Indirect Not yet tested in the field
System [44] flood events-Real-time application
Piezoelectric Film devices Debris/Ice impact—Unreliable
Direct Cost effective
[45] measurements due to sensor sensitivity
No need for underwater
Vibration based methods
Indirect installation—Relatively Bridge specific calibration required
[29,30,46]
cost-effective method
2.2. Main Issues That Arise from Current Scour Assessment Practice
The current bridge inspection practice relies on specialist diver engineers carrying out
underwater examinations of structural elements [47]. This method is not reliable as bridges
are inspected at intervals of several years, posing many threats to bridges due to scour
effects, especially during yearly gaps between the inspections. For example, in the UK and
Ireland, special inspections requiring an underwater examination of the structural elements
take place at time intervals of six years or after specific events (e.g., major floods) [47,48].
Similarly, in the US, scour at hydraulic structures is being evaluated with visual inspectionsInfrastructures 2022, 7, 68 5 of 16
at time intervals of five years [49]. Considering that road infrastructure is subject to more
intense and frequent extreme events within its design life, visual inspection practice cannot
provide reliable assessment of scour effects between these long-time intervals, leading to
undetected scour areas and ultimately catastrophic failures.
Another major issue relies on the fact that most of the assessment and monitoring
methods are not able to identify scour holes ‘masked’ by backfill soil [50]. This is of
significant importance, as backfill sediment does not have the same soil properties as the
original soil [33], and it is easily eroded again during smaller-scale floods compromising the
integrity of structures. The limited tools to reliably assess hydro-hazards at bridges, make
scour risk assessment a particularly challenging issue. Thus, the research opportunity arises
to develop new sensing instruments and structural health monitoring methods that can
provide direct and real-time assessment of both scour and sediment deposition conditions
and potentially enhance the current understanding of bed level processes under extreme
hydrodynamic effects.
3. A New Monitoring Concept
3.1. Measuring Principle
The measuring principle of the proposed scour sensing system is based on the detection
of perturbations in the electrical properties of objects surrounding the environment of the
instrument. It is based on electromagnetic waves travelling along a transmission line,
which are expected to encounter an impedance change at boundaries between materials
with different electrical properties. Figure 1 provides an example of the generated voltage
patterns. In the case of an impedance mismatch (Zo 6= ZL ), the incident wave (Vinc. ) is
partitioned to transmitted (Vtran. ) and reflected (Vref. ) signals. As a result, a standing wave
Infrastructures 2022, 7, x FOR PEER REVIEW
(VSWR ) is formed in the incident transmission line while the transmitted wave amplitude 6 of 17
is reduced.
Figure1.1.Transverse
Figure Transverseelectromagnetic
electromagneticwave wavecharacteristics
characteristicsofofaatransmission
transmissionline
lineat atan
aninstant
instanttime
time
forimpedance
for impedance mismatch.
mismatch. The The voltage
voltage standing
standingwave wave(V(VSWR)
SWR
is
) formed
is due
formed to
due the
to thesuperposition
superpositionbe-
tween the
between theincident
incident(V
(Vinc. ) and
) reflected
and (V
reflected ref.) waves, while the transmitted (Vtran.) wave amplitude is
(V ) waves, while the transmitted (V ) wave amplitude
inc. ref. tran.
reduced.
is reduced.
By measuring
By measuring the the reflection
reflection andand transmission
transmission parameters
parameters of of aa sensing
sensing device
device itit isis
possibleto
possible tocharacterise
characteriseaatransmission
transmissionline lineand
andextract
extractimportant
importantinformation
informationabout aboutthe
the
permittivity(ε)
permittivity (ε)ofofthe
themedium
medium(i.e., (i.e.,the
theability
abilityof
ofaamaterial
materialtotobe
bepolarized
polarizedby byananelectric
electric
field[51])
field [51])that
thatthe
the instrument
instrument is inserted.
is inserted. ForFor example,
example, scourscour conditions
conditions (i.e., sensor
(i.e., sensor ex-
exposed
posed in water conditions) will correspond to the permittivity value
in water conditions) will correspond to the permittivity value of water (εw ≈ 80), comparedof water (εw ≈ 80),
compared
to to the permittivity
the permittivity values ofsediment
values of saturated saturated(εs sediment (εs and
= 23 ÷ 30) = 23 deposited
÷ 30) and sediment
deposited
sediment conditions
conditions (εd ≈ 30 ÷ (εd38)
≈ 30 ÷ 38)
[33]. The [33]. Thecontrast
large large contrast of the permittivity
of the permittivity valuesvalues ob-
obtained
tained
in in the aforementioned
the aforementioned conditionsconditions will therefore
will therefore enable toenable
assesstoscour
assessdepthscourbutdepth
alsobut
to
also to differentiate
differentiate betweenbetween
original original
saturated saturated and deposited
and deposited soil conditions.
soil conditions.
3.2. Conceptual Sensor Components and Application
The conceptual sensor components are presented in Figure 2 and consist of two elec-
trodes attached to a solid structure, which is inserted into a protective access tube. The
electrodes generate an electromagnetic field that penetrates the external medium outside
the access tube. The total capacitance generated by the sensor depends on the capacitorspermittivity (ε) of the medium (i.e., the ability of a material to be polarized by an electric
field [51]) that the instrument is inserted. For example, scour conditions (i.e., sensor ex-
posed in water conditions) will correspond to the permittivity value of water (εw ≈ 80),
compared to the permittivity values of saturated sediment (εs = 23 ÷ 30) and deposited
sediment conditions (εd ≈ 30 ÷ 38) [33]. The large contrast of the permittivity values ob-
Infrastructures 2022, 7, 68
tained in the aforementioned conditions will therefore enable to assess scour depth6 ofbut 16
also to differentiate between original saturated and deposited soil conditions.
3.2. Conceptual Sensor Components and Application
The conceptual
conceptualsensor sensorcomponents
componentsare are presented
presented in Figure
in Figure 2 and
2 and consist
consist of elec-
of two two
electrodes attached
trodes attached to atosolid
a solid structure,
structure, which
which is isinserted
insertedinto
intoaaprotective
protective access
access tube. The
electrodes
electrodes generate
generatean anelectromagnetic
electromagneticfield that
field that penetrates
penetrates thethe
external medium
external medium outside the
outside
access tube.
the access TheThe
tube. totaltotal
capacitance generated
capacitance generatedby the by sensor depends
the sensor on the
depends oncapacitors that
the capacitors
correspond to the
that correspond toplexiglass structure,
the plexiglass the air,
structure, thethe air,access tubetube
the access and the
andexternal simulated
the external simu-
medium which depends on the permittivity value. The geometric
lated medium which depends on the permittivity value. The geometric components components of the sensor
of the
remain constant
sensor remain indicating
constant that the
indicating thatoutput of theofsensor
the output is primarily
the sensor dependent
is primarily of the
dependent of
capacitance of the
the capacitance of medium
the medium that is inserted.
that The change
is inserted. in thein
The change obtained capacitance
the obtained value
capacitance
of the of
value sensor is therefore
the sensor employed
is therefore to provide
employed an indication
to provide of scour
an indication and sedimentation
of scour and sedimen-
depth around the sensor location.
tation depth around the sensor location.
Figure 2.
Figure 2. Cross
Cross section
section of
of sensor
sensor components
components and
and electromagnetic
electromagnetic field
field generated
generated between
between elec-
elec-
trodes. The generated field generated between the two electrodes is expected to penetrate
trodes. The generated field generated between the two electrodes is expected to penetrate the exter-
the
nal medium.
external medium.
An indicative conceptual application of the scour sensor is presented in Figure 3
alongside the typical sensor response that is anticipated during scour evolution around
the bridge foundation. During the scouring process, the original riverbed (εs = 23–30)
will be gradually substituted by water (εw = 80) conditions. This change in the medium
permittivity conditions will cause an increase in the sensor signal, which will indicate a
corresponding increase in the scour depth around the sensor location. The sensing system
can be coupled by an early warning system in which the signal is transmitted through the
data acquisition system to structure maintainer/asset owner. Critical threshold levels can
be determined so the scour sensor is able to exceed certain pre-defined values indicating
the alert, intervention and danger lines (see Figure 3). This will allow precautionary actions
to be carried out increasing safety and reducing bridge maintenance/rehabilitation costs.
In the example demonstrated in Figure 3, the sensing device is shown to be installed
on the side of a bridge pier. However, it should be noted that the exact location of the sensor
should be derived from the examination of the different factors that influence evolution of
scour, as it is considered a complex process. Certain scour development parameters (e.g.,
size and shape of structural element, riverbed material, river morphology, sedimentation
and scour zones, angle of attack of flood flow to the pier, debris risk) need to be taken into
account, so that the instrumentation satisfies the requirements of each individual bridge
and river. Similarly, for the sensor installation around the bridge pier, the anticipated
formation of scour holes and the different scour development patterns that may occur in
cohesive compared to non-cohesive sediments should also be taken into account [52,53].
The latter influences the installation location of the sensing device and whether it will be
attached into the foundation structure or will be placed at a certain distance from the bridge
foundation. Finally, the size of the sensing device installed into the riverbed is influenced
by other factors that also need to be determined, e.g., debris impact risk, influence of device
on local scour, etc.anticipated formation of scour holes and the different scour development patterns that
may occur in cohesive compared to non-cohesive sediments should also be taken into ac-
count [52,53]. The latter influences the installation location of the sensing device and
whether it will be attached into the foundation structure or will be placed at a certain
distance from the bridge foundation. Finally, the size of the sensing device installed into
Infrastructures 2022, 7, 68 7 of 16
the riverbed is influenced by other factors that also need to be determined, e.g., debris
impact risk, influence of device on local scour, etc.
Figure3.3.Conceptual
Figure Conceptualmonitoring
monitoring application
application andand anticipated
anticipated outputs
outputs of theofscour
the scour
sensorsensor into a
into a bridge
bridge structure. Increased scour depth is expected to lead to a corresponding increase in the sensor
structure. Increased scour depth is expected to lead to a corresponding increase in the sensor output.
output.
Instruments based on similar concepts (i.e., using probe-shaped sensing units installed
into the riverbed) have been applied in the past for monitoring scour conditions at bridge
structures (see also Table 1) as permanent scour monitoring instruments. For example, the
ADR sensor has been experimentally assessed under different environmental conditions
in the flume laboratory, and the obtained results indicated that the instrument is able
to monitor scour and sediment deposition conditions [33,34]. However, the ADR probe
consists of ring-shape electrodes which are located at pre-determined depth intervals.
This indicates that scour depth is determined only when bed level surpasses the sensor
location; therefore, the instrument cannot provide continuous monitoring of scour along
the probe length. Fixed probe sensors based on TDR technology have also been assessed in
both laboratory and field conditions for the same purpose as they can provide advanced
accuracy of scour evolution along the probe length [25,32]. However, major limitations
of TDR instruments lie in the complicated signal interpretation [41] and the high cost of
equipment [25].
In light of the limitations of previous scour monitoring efforts, the next sections fo-
cused on the investigation via FEM of a new sensor to assess bed level variations. The main
aim was to optimise the electrode geometrical characteristics to allow continuous scour
monitoring along the probe length, with easy to deploy electrode design and with satisfac-
tory accuracy to assess bed level variations in various simulated environmental conditions.
4. Modelling of a New Sensor
4.1. Input Parameters and Sensor Geometry
The optimum sensor geometry was defined using the two-dimensional (2D) finite
element software Maxwell 2D. The study focused on simulating various permittivity
conditions that are expected to occur in a representative environment and corresponded
to air (εa = 1.0006), saturated sediment (εs = 25), water (εw = 80) and deposited sediment
(εd = 35) conditions. Two strip electrodes were simulated in order to define their optimum
size and location according to the computed capacitance and the magnitude of the electricInfrastructures 2022, 7, 68 8 of 16
flux density (magD). The magD describes the displacement effects of an electric field on
the polarisation or bound charges within a dielectric material.
The main aim of the simulations was to define the optimum electrode components of
a prospective sensor for the purpose of scour and sediment deposition monitoring based
on the following parameters:
• The extent and magnitude of the electrostatic field penetration in the surround-
ing medium;
• The capacitance difference between (a) water and saturated soil conditions, and (b) satu-
rated soil and deposited sediments;
• The increased magnitude and electric potential between the simulated electrodes.
The model was simulated in the XY plane, and the solver was defined as electrostatic.
In 2D elements, the simulation of the cross section is extended infinitely in the orthogonal
directions; therefore, the total capacitance that is generated between the strip electrodes was
calculated in picoFarads per meter (pF/m). The boundary conditions were set to ‘balloon’,
which models the case where the structure is assumed to be infinitely far away from all
other electromagnetic sources. The electric potentials of the two strip electrodes were set to
+1 Volt (V) and 0 V, respectively.
With regard to the inner cross section, a solid rectangular was simulated as this is
expected to add durability for field application purposes and at the same time is anticipated
to weaken the external field penetration. The simulated inner cross section therefore
comprised of a solid plexiglass structure attached to two mirrored strip electrodes. The
Infrastructures 2022, 7, x FOR PEER REVIEW
permittivity values assigned in the model are presented in Figure 4. A fiberglass access 9 of 17
tube was also deemed to be necessary to add durability and resilience of the system to
external environmental conditions and was included in the simulations to investigate its
effect
effecton
onthe
thecomputed
computedcapacitance
capacitanceand itsits
and influence on on
influence thethe
sensitivity of the
sensitivity sensor.
of the An air
sensor. An
gap between sensor electrodes was also simulated to investigate the effect of air
air gap between sensor electrodes was also simulated to investigate the effect of air intointo the
computed capacitance.
the computed capacitance.
Figure4.4.Typical
Figure Typicaltop
topview
viewofofsensor
sensormodel
modelwith
withtwo
twostrip
stripelectrodes
electrodesattached
attachedtotoaasolid
solidplexiglass
plexiglass
structure enclosed
structure enclosed by
by an
an access
accesstube.
tube.The electrodes
The areare
electrodes separated in horizontal
separated distance
in horizontal by a simu-
distance by a
lated air gap.
simulated air gap.
Themodel
The modelsolver
solverset-up
set-upwas wasadjusted
adjustedto to10%
10%refinement
refinementperperpass
passwith
with10 10requested
requested
passes,while
passes, whilethe
theerror
errorwas
wassetsettoto 0.01%
0.01% toto enable
enable usus
to to capture
capture in detail
in detail field
field characteris-
characteristics
tics into
into the areas
the areas of interest
of interest (i.e.,(i.e.,
nextnext to strip
to strip electrodes).
electrodes). Thegenerated
The generatedtypical
typicalmesh
meshforfor
simulatedwater
simulated waterconditions
conditionsisisshown
shownininFigure
Figure5.5.Figure 4. Typical top view of sensor model with two strip electrodes attached to a solid plexiglass
structure enclosed by an access tube. The electrodes are separated in horizontal distance by a simu-
lated air gap.
The model solver set-up was adjusted to 10% refinement per pass with 10 requested
Infrastructures 2022, 7, 68 passes, while the error was set to 0.01% to enable us to capture in detail field characteris- 9 of 16
tics into the areas of interest (i.e., next to strip electrodes). The generated typical mesh for
simulated water conditions is shown in Figure 5.
Figure 5. Typical mesh generated in simulated water conditions. Increased mesh density is observed
Figure 5. Typical mesh generated in simulated water conditions. Increased mesh density is observed
to be generated between the transmitter and receiver electrodes and on the region that corresponds
to
to be
thegenerated
edge of thebetween the transmitter and receiver electrodes and on the region that corresponds
electrodes.
to the edge of the electrodes.
4.2. Analysis and Optimisation of the Sensor Using FEM
4.2.
4.2.1.Analysis and Optimisation
Field Magnitude of the
in Different Sensor Using
Environmental FEM
Conditions
4.2.1.The
Field Magnitude
effect in electrode
of increased Differentlength
Environmental Conditions
on the obtained capacitance, the magD of the
electricThe effect
flux of increased
density, is of mainelectrode
importance length
for the onsensitivity
the obtainedof thecapacitance, the magD of
sensor to external
simulated
the electricenvironmental
flux density,conditions.
is of mainThe simulations
importance were
for thecarried out with
sensitivity the sensor
of the electrodes
to external
of various lengths
simulated of 11 mm,conditions.
environmental 12 mm, 13 mm Theand 14 mm. were carried out with the electrodes
simulations
Typicallengths
of various magD values obtained
of 11 mm, for an
12 mm, 13electrode
mm andlength 14 mm. of 13 mm and different simu-
latedTypical
environmental conditions are presented in
magD values obtained for an electrode lengthFigure 6. It is observed
of 13 mmthat in air different
and condi- simu-
tion, the electrostatic field that is generated between the sensor electrodes passes more
lated environmental conditions are presented in Figure 6. It is observed that in air condition,
readily through the dielectric material of the inner cross section and hardly penetrates the
the electrostatic field that is generated between the sensor electrodes passes more read-
medium outside the access tube. This is attributed to the greater permittivity value of the
ily through the dielectric material of the inner cross section and hardly penetrates the
plexiglass structure when compared to external simulated air environment. The magD
medium outside
and penetration theare
area access tube. This
significantly is attributed
increased to the
in the other greaterconditions
simulated permittivitywithvalue
an of the
plexiglass
electric fieldstructure
that has awhen compared
good circular to external
symmetry simulatedbetween
being generated air environment. The magD
the sensor elec-
and
trodes. penetration
The maximum areamagDare significantly
is obtained inincreased in the other
water environment, while simulated conditions
greater strength of with
an electric field
Infrastructures 2022, 7, x FOR PEER REVIEW
that has a good circular symmetry being generated between the sensor
10 of 17
electrodes. The maximum magD is obtained in water environment, while greater strength
of electric field is also recorded in deposited sediment compared to saturated sediment
conditions. For all simulated
electric models,
field is also recorded the maximum
in deposited sedimentmagD thattoissaturated
compared generated between
sediment con- the
transmitter and receiver electrodes was observed for the region that correspondstheto the
ditions. For all simulated models, the maximum magD that is generated between
transmitter and receiver electrodes was observed for the region that corresponds to the
edge of the electrodes.
edge of the electrodes.
Figure 6. Typical magD and penetration of electric field obtained in air, saturated sediment, water
Figure 6. Typical magD and penetration of electric field obtained in air, saturated sediment, water
and deposited soil simulated conditions for electrode length of 13 mm. The magD and penetration
and depositedarea
soilofsimulated conditions
the generated for electrode
field are increased length of
and maximized for13
themm. The magD
simulated and
condition thatpenetration
corre-
sponds tofield
area of the generated water environment.
are increased and maximized for the simulated condition that corresponds
to water environment.
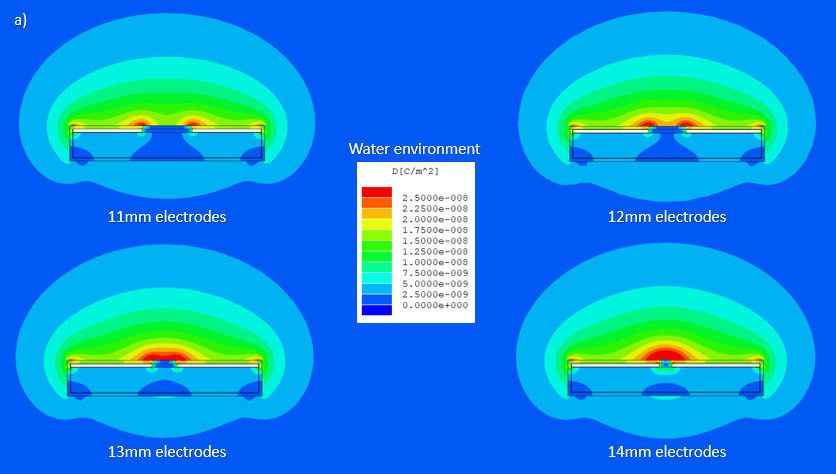
Figure 7a,b show the variation of the magD obtained for different simulated electrode
lengths in water conditions and saturated soil conditions, respectively. The obtained re-
sults also indicate that an increase in the electrode length resulted to an increase in both
magnitude of the electric flux density and penetration area of the field into the surround-
ing external medium. Greater magD is obtained for increased electrode size with a maxi-
mum value of 2.5 × 10⁻⁸ C/m2 recorded for electrode length of 14 mm in water conditionsInfrastructures 2022, 7, 68 10 of 16
Figure 7a,b show the variation of the magD obtained for different simulated electrode
lengths in water conditions and saturated soil conditions, respectively. The obtained
results also indicate that an increase in the electrode length resulted to an increase in both
magnitude of the electric flux density and penetration area of the field into the surrounding
external medium. Greater magD is obtained for increased electrode size with a maximum
value of 2.5 × 10⁻⁸ C/m2 recorded for electrode length of 14 mm in water conditions (see
Figure 7a). The maximum strength of the electric flux density in the simulated saturated
soil environment is also obtained for the maximum electrode arc length of 14 mm, which
corresponds to 2.25 × 10⁻⁸ C/m2 (see Figure 7b). Maximum penetration of the simulated
Infrastructures 2022, 7, x FOR PEER REVIEW 11 of 17
electric field is also observed to be achieved for the conditions that corresponded to water
environment and for increased electrode lengths.
Figure
Figure 7. MagD
7. MagD andand field
field penetration
penetration areaarea obtained
obtained in (a)inwater,
(a) water, andsaturated
and (b) (b) saturated soil conditions
soil conditions for
for various electrode lengths of 11 mm, 12 mm, 13 mm and 14 mm. In both simulated
various electrode lengths of 11 mm, 12 mm, 13 mm and 14 mm. In both simulated conditions, conditions,
the
the maximum magD and field penetration are obtained for the electrode length of 14 mm.
maximum magD and field penetration are obtained for the electrode length of 14 mm.
4.2.2. Computed Capacitance in Various Environmental Conditions
The effect of increased electrode length on the computed capacitance was also inves-
tigated and presented in this section. A distinct difference between the capacitance values
obtained at different environmental conditions will enable a sensing system to differenti-
ate between scour, saturated soil and deposited soil conditions. The computed capacitanceInfrastructures 2022, 7, 68 11 of 16
4.2.2. Computed Capacitance in Various Environmental Conditions
The effect of increased electrode length on the computed capacitance was also investi-
gated and presented in this section. A distinct difference between the capacitance values
obtained at different environmental conditions will enable a sensing system to differentiate
between scour, saturated soil and deposited soil conditions. The computed capacitance
for different electrode lengths and simulated conditions is presented in Figure 8. In all
simulated conditions, increased electrode arc length resulted in greater capacitance, with
Infrastructures 2022, 7, x FOR PEER REVIEW 12 of 17
the maximum value obtained in simulated water conditions and for electrode length of
14 mm.
Infrastructures 2022, 7, x FOR PEER REVIEW 12 of 17
360
320
360
280
(pF/m) (pF/m)
320
240
280
200
Capacitance
160
240
120
200
Capacitance
80
160 11mm
12mm
40
120 13mm
14mm
0
80 11mm
Air Saturated Soil Deposited Soil Water
12mm
40 13mm
Simulated Medium
14mm
0
Figure 8. Capacitance values
Capacitance
Air valuesobtained
obtained
Saturated
for
forvarious
various
Soil Deposited
simulated
simulated
Soil
media
mediafor
Water forelectrode lengths
electrode ofof
lengths 1111
mmmm
(rectangular
(rectangular mark),
mark), 12
12 mm
mm (triangle
(trianglemark),
mark),13
13mm
mm(node
(nodemark)
mark)and
and14
14mm
mm(filled
(filleddot
dotmark).
mark).
Simulated Medium
Figure Figure
The 9 presents
8. Capacitance valuespredicted
the
maximum capacitance obtained capacitance
value
for of 340 pF/m
various difference between
corresponded
simulated media towater and
waterlengths
for electrode saturated
conditions for
of 11 mm
soil conditions
electrodes
(rectangular with for
mark), increased
length
12 14electrode
mmof(triangle
mm, length.
13 mmThe
following
mark), capacitance
a(node
decrease
mark)toand difference
256 pF/m
14 mm fordot
and
(filled 11 mm
221 elec-in
pF/m
mark).
trode arc length
deposited is recorded
and saturated soilatconditions,
99.01 pF/mrespectively.
and further increases almost linearly by 8.6%,
14.8%Figure
and 20.4%
Figure for electrode
99presents
presents the sizes of
thepredicted
predicted 12 mm, 13difference
capacitance
capacitance mm and 14 mm,
between
difference respectively.
betweenwater andand
water saturated soil
saturated
conditions for increased
soil conditions electrode
for increased length.
electrode The capacitance
length. difference
The capacitance for 11for
difference mm11 electrode
mm elec-
arc
trodelength is recorded
arc length at 99.01atpF/m
is recorded 99.01 and
pF/mfurther increases
and further almostalmost
increases linearly by 8.6%,
linearly by 14.8%
8.6%,
and 20.4% for electrode sizes of 12 mm, 13 mm and 14 mm, respectively.
14.8% and 20.4% for electrode sizes of 12 mm, 13 mm and 14 mm, respectively.
Figure 9. Capacitance difference obtained between water and saturated soil conditions for various
electrode lengths of 11, 12, 13 and 14 mm. Increased electrodes lengths resulted in a corresponding
increase in the capacitance difference computed between the two simulated conditions.
Figure 9. Capacitance
9.
The capacitance difference
differenceobtained
betweenbetween water
deposited andand saturatedsoil
saturated
saturated soilisconditions
soil conditions
presentedforinvarious
various
Fig-
electrode lengths of 11,
ure 10. A nearly linear12, 12, 13 and 14 mm.
13 andis14also
increase mm. Increased electrodes lengths resulted in a corresponding
observed with the capacitance different for electrode
increase in
increase
length ofin11
the capacitance
the capacitance difference
mm difference computed
to be recorded at computed betweenthe
and tothe
between
28.95 pF/m twosimulated
two
furthersimulatedconditions.
increaseconditions.
by 7.3%, 14% and
20.1% for electrode sizes of 12 mm, 13 mm, and 14 mm, respectively.
The capacitance difference between deposited and saturated soil is presented in Fig-
ure 10. A nearly linear increase is also observed with the capacitance different for electrode
length of 11 mm to be recorded at 28.95 pF/m and to further increase by 7.3%, 14% and
20.1% for electrode sizes of 12 mm, 13 mm, and 14 mm, respectively.Infrastructures 2022, 7, 68 12 of 16
The capacitance difference between deposited and saturated soil is presented in Figure 10.
A nearly linear increase is also observed with the capacitance different for electrode length
Infrastructures 2022, 7, x FOR PEER REVIEW
of 11 mm to be recorded at 28.95 pF/m and to further increase by 7.3%, 14% and 20.1% 13 offor
17
electrode sizes of 12 mm, 13 mm, and 14 mm, respectively.
Figure 10. Capacitance difference obtained between
between deposited
deposited and
and saturated
saturated soil
soil conditions
conditions for
for vari-
var-
ious electrode lengths of 11, 12, 13 and 14 mm. Increased electrodes lengths resulted in a correspond-
ous electrode lengths of 11, 12, 13 and 14 mm. Increased electrodes lengths resulted in a corresponding
ing increase
increase in capacitance
in the the capacitance difference
difference computed
computed between
between the two
the two simulated
simulated conditions.
conditions.
The obtained
The obtained results
results indicate
indicate that
that greater
greater electrode
electrode sizes
sizes maximise
maximise the the sensitivity
sensitivity ofof
the sensor to the various simulated external environmental
the sensor to the various simulated external environmental conditions. An increase of conditions. An increase of
electrode length (from 11 mm to 14 mm) results in a corresponding
electrode length (from 11 mm to 14 mm) results in a corresponding increase in computed increase in computed
capacitance. Greater
capacitance. Greater capacitance
capacitance values
values were
were recorded
recorded for for the
the maximum
maximum electrode
electrode length
length
of 14 mm. Maximum capacitance difference is also achieved for
of 14 mm. Maximum capacitance difference is also achieved for electrode length of 14 mm electrode length of 14 mm
which indicates enhanced capability of the sensor to detect scour conditions
which indicates enhanced capability of the sensor to detect scour conditions (i.e., difference (i.e., differ-
ence between
between waterwater and saturated
and saturated soil conditions)
soil conditions) and and to differentiate
to differentiate deposited
deposited soil soil
and and
sat-
saturated
urated soilsoil conditions,
conditions, which
which will
will enabletotosense
enable sensethethebackfilled
backfilled soil
soil sediment processes.
processes.
This is
This is due
duetotothe
theincreased
increasedelectrode
electrode area
area andandthethenearnear proximity
proximity of two
of the the two electrodes
electrodes that
that increased
increased the overall
the overall capacitance.
capacitance.
Greater electrode length also led to a significant rise in the strength and penetration
area of the the electric
electric flux
fluxdensity.
density.TheTheoverall
overall electric
electricflux density
flux densitywas wasobserved
observed to be
to in-
be
creased ininwater
increased waterwhenwhencompared
comparedtotosaturated
saturatedsediment
sedimentand anddeposited
deposited soilsoil conditions
conditions for
simulatedelectrode
all simulated electrodelengths.
lengths.This
Thisisis due
due to to
thethe large
large difference
difference of relative
of the the relative permit-
permittivity
tivity
of water of as
water as compared
compared to saturated
to saturated sediment, sediment, whichinresults
which results in magnitude
a greater a greater magnitude
of electric
field and in
of electric increased
field and in capacitance values in simulated
increased capacitance water environment.
values in simulated The strength
water environment. The
of the electric
strength of thefield extending
electric into the into
field extending medium was found
the medium wasto be significantly
found decreased
to be significantly de-
after the penetration distance of 22 mm. The same electrode arrangement
creased after the penetration distance of 22 mm. The same electrode arrangement also also provided the
maximum difference between saturated sediment and water
provided the maximum difference between saturated sediment and water conditions. conditions.
For electrode length of 14 mm, the capacitance, magD and field penetration area are
increased and andappear
appeartotobebe the
the optimum
optimum compared
compared to other
to other simulated
simulated electrode
electrode sizes.sizes.
This
This geometric
geometric configuration
configuration is expected
is expected to provide
to provide increasedsensitivity
increased sensitivityofofthe the sensor
sensor toto
changes to medium permittivity and, thus, to scour and sediment
changes to medium permittivity and, thus, to scour and sediment deposition processes. deposition processes.
The
The final
final design
design of of the
the proposed
proposed sensor
sensor comprises
comprises of of two
two mirrored
mirrored strips
strips generating
generating aa
symmetrical electric field, which enables satisfactory penetration
symmetrical electric field, which enables satisfactory penetration into the medium outsideinto the medium outside
the access
the access tube.tube.
5. Recommendations and Future Research
The lessons learnt from previous scour monitoring applications indicate that despite
the numerous efforts to provide a sensing method for scour monitoring, a one-instrument-
fits-all-bridges solution does not currently exist [50]. New research efforts on monitoring
scour processes have therefore the potential to fulfil a useful role for cost-effective man-
agement of scour susceptible structures. In this direction, the current study focused on theInfrastructures 2022, 7, 68 13 of 16
5. Recommendations and Future Research
The lessons learnt from previous scour monitoring applications indicate that despite
the numerous efforts to provide a sensing method for scour monitoring, a one-instrument-
fits-all-bridges solution does not currently exist [50]. New research efforts on monitoring
scour processes have therefore the potential to fulfil a useful role for cost-effective man-
agement of scour susceptible structures. In this direction, the current study focused on the
optimisation of the characteristics of a new sensor in a simulated environment using FEM.
Future steps are required towards the experimental validation and field application of
the sensor. This will involve the fabrication of a small-scale prototype to experimentally
assess and calibrate the sensing device in various scour depths under different soil, water
salinity and temperature conditions that are expected to occur in field environment. The
durability of the sensor and its protective access tube to the representative environment
needs also to be investigated with FEM simulations and then in operational conditions by
installing a mock-up instrument on a bridge site.
In existing structures, the sensor is proposed to be used as a permanent monitoring
instrument, which is fully driven into the riverbed and completely submerged at a certain
distance for the water surface, so that debris has the minimum possible impact. In new
bridge structures, the proposed monitoring method can potentially provide a ‘plug &
sense’ option and can be incorporated into the outer skin of the foundation, which is in
contact with the riverbed. Future research is required to evaluate the aforementioned
application options, considering a number of site conditions (e.g., geomorphological and
foundation conditions).
6. Conclusions
Scour action is a challenge for critical infrastructure systems, due to the changing
climate bringing more active weather systems. Bed level conditions at underwater founda-
tions have proved very difficult to monitor, considering that scour holes are often re-filled
by deposited loose material that is easily eroded during subsequent smaller-scale events.
The evaluation of scour and sediment deposition processes is also becoming more criti-
cal, taking into account the deterioration of infrastructure and the issues arising from the
rehabilitation of hydraulic and marine structures.
This study initially reviewed parameters that amplify the growing infrastructure crisis,
with particular focus on limitations of existing scour assessment procedures. An analysis
of the advantages and limitations of existing monitoring instruments is also carried out
in an effort to assess characteristics that hamper their widespread application to assess
scour process. Main bridge failures on the European continent due to scour process are
also presented, highlighting the need for more reliable scour monitoring.
The investigation then focuses on introducing a new monitoring concept and the
conceptual characteristics and application of a new scour sensor. The development and
optimisation of the components of the new sensor for measuring scour and re-deposited
sediment conditions at foundation elements was performed via FEM. The investigation
focused on the influence of the geometric components of a two-strip electrode sensor on the
computed capacitance, the strength and penetration area of the electric field. Our findings
demonstrated that decreased electrode size and increased air gap between electrodes
had a decreasing impact on the computed capacitance and the magnitude of the electric
flux density. The obtained results indicated that the optimum geometric configuration
corresponds to the electrodes of 14 mm length placed at a horizontal distance of 1 mm. This
geometric electrode configuration was found to provide the greatest capacitance difference
between water and saturated soil conditions and therefore increased sensitivity to scour
processes. The optimum sensor components that were defined in this study have the
potential to provide a new instrument for monitoring effectively of scour and backfilled
sediment processes.Infrastructures 2022, 7, 68 14 of 16
Author Contributions: Conceptualization, P.M.; methodology, P.M.; software, P.M.; validation, P.M.;
formal analysis, P.M.; investigation, P.M.; resources, P.M.; data curation, P.M.; writing—original
draft preparation, P.M.; writing—review and editing, P.M. and E.V.; visualization, P.M.; supervision,
E.V.; project administration, P.M.; funding acquisition, P.M. All authors have read and agreed to the
published version of the manuscript.
Funding: This research is co-financed by Greece and the European Union (European Social Fund-
ESF) through the Operational Programme “Human Resources Development, Education and Lifelong
Learning” in the context of the project “Reinforcement of Postdoctoral Researchers—2nd Cycle”
(MIS-5033021), implemented by the State Scholarships Foundation (IKΥ).
Institutional Review Board Statement: Not applicable.
Informed Consent Statement: Not applicable.
Data Availability Statement: Not applicable.
Acknowledgments: The authors would like to thank Tina Katika and the two anonymous reviewers
for their insightful suggestions and careful reading of the manuscript.
Conflicts of Interest: The authors declare no conflict of interest.
References
1. BRIME. Deliverable D14 Final Report. 2001. Available online: https://trimis.ec.europa.eu/sites/default/files/project/
documents/brimerep.pdf (accessed on 2 March 2022).
2. American Society of Civil Engineers (ASCE). 2021 Report Card for America’s Infrastructure. Available online: https://
infrastructurereportcard.org/ (accessed on 24 March 2022).
3. Pregnolato, M. Bridge safety is not for granted—A novel approach to bridge management. Eng. Struct. 2019, 196, 109193.
[CrossRef]
4. Santarsiero, G.; Masi, A.; Picciano, V.; Digrisolo, A. The Italian Guidelines on Risk Classification and Management of Bridges:
Applications and Remarks on Large Scale Risk Assessments. Infrastructures 2021, 6, 111. [CrossRef]
5. Bekic, D.; Kerin, I.; Cahill, P.; Michalis, P.; Lapthorne, J.; Šolman, H.; Gilja, G.; Potocki, K.; Pakrashi, V.; McKeogh, E. BRIDGE
SMS—Innovative Solution for Management of Bridges over Water. In Proceedings of the 5th International Conference on Road
and Rail Infrastructure (CETRA 2018), Zadar, Croatia, 17–19 May 2018; pp. 57–63.
6. Gkoumas, K.; Gkoktsi, K.; Bono, F.; Galassi, M.; Tirelli, D. The Way Forward for Indirect Structural Health Monitoring (iSHM)
Using Connected and Automated Vehicles in Europe. Infrastructures 2021, 6, 43. [CrossRef]
7. Mitoulis, S.A.; Argyroudis, S.A.; Loli, M.; Imam, B. Restoration models for quantifying flood resilience of bridges. Eng. Struct.
2021, 238, 112180. [CrossRef]
8. Jongman, B.; Hochrainer-Stigler, S.; Feyen, L.; Aerts, J.C.J.H.; Mechler, R.; Botzen, W.J.W.; Bouwer, L.M.; Pflug, G.; Rojas, R.; Ward,
P.J. Increasing stress on disaster-risk finance due to large floods. Nat. Clim. Chang. 2014, 4, 264–268. [CrossRef]
9. Forzieri, G.; Feyen, L.; Russo, S.; Vousdoukas, M.; Alfieri, L.; Outten, S.; Migliavacca, M.; Bianchi, A.; Rojas, R.; Cid, A.
Multi-hazard assessment in Europe under climate change. Clim. Chang. 2016, 137, 105–119. [CrossRef]
10. Flint, M.M.; Fringer, O.; Billington, S.L.; Freyberg, D.; Diffenbaugh, N. Historical Analysis of Hydraulic Bridge Collapses in the
Continental United States. J. Infrastruct. Syst. 2017, 23, 04017005. [CrossRef]
11. Wardhana, K.; Hadipriono, F.C. Analysis of Recent Bridge Failures in the United States. J. Perform. Constr. Facil. 2003, 17, 144–150.
[CrossRef]
12. Rojas, R.; Feyen, L.; Watkiss, P. Climate change and river floods in the European Union: Socio-economic consequences and the
costs and benefits of adaptation. Glob. Environ. Chang. 2013, 23, 1737–1751. [CrossRef]
13. Michalis, P.; Sentenac, P. Subsurface condition assessment of critical dam infrastructure with non-invasive geophysical sensing.
Environ. Earth Sci. 2021, 80, 556. [CrossRef]
14. FHWA (Federal Highway Administration). Evaluating Scour at Bridges; Technical advisory T5140.23; US Department of Trans-
portation: Washington, DC, USA, 1991.
15. Lagasse, P.F.; Richardson, V.E. ASCE Compendium of Stream Stability and Bridge Scour Papers. J. Hydraul. Eng. 2001, 127,
531–533. [CrossRef]
16. Richardson, E.V.; Davis, S.R. Evaluating Scour at Bridges, 4th ed.; FHWA NHI 01-001: Hydraulic Engineering Circular No. 18; US
Department of Transportation: Washington, DC, USA, 2001.
17. Dianeosis. Bridges and Infrastructures in Greece. 2019. Available online: https://www.dianeosis.org/2019/09/gefyres/
(accessed on 23 April 2022). (In Greek).
18. Vardanega, P.J.; Gavriel, G.; Pregnolato, M. Assessing the suitability of bridge-scour monitoring devices. Proc. Inst. Civ.
Eng.–Forensic Eng. 2021, 174, 105–117. [CrossRef]
19. Kirby, A.M.; Roca, M.; Kitchen, A. Manual on Scour at Bridges and Other Hydraulic Structures, 2nd ed.; CIRIA: London, UK, 2015.You can also read