The FY2013 Defense Budget, Deficits, Cost-Escalation, and Sequestration
←
→
Page content transcription
If your browser does not render page correctly, please read the page content below
1800 K Street, NW
               Suite 400
   Washington, DC 20006

   Phone: 1.202.775.3270
     Fax: 1.202.775.3199
                   Email:
  acordesman@gmail.com
                    Web:
www.csis.org/burke/reports

                    The FY2013 Defense Budget,
                    Deficits, Cost-Escalation, and
                    Sequestration
                                Anthony H. Cordesman,
                                Arleigh A. Burke Chair in Strategy

                                                                     July 16, 2012

                                                                     www.csis.org |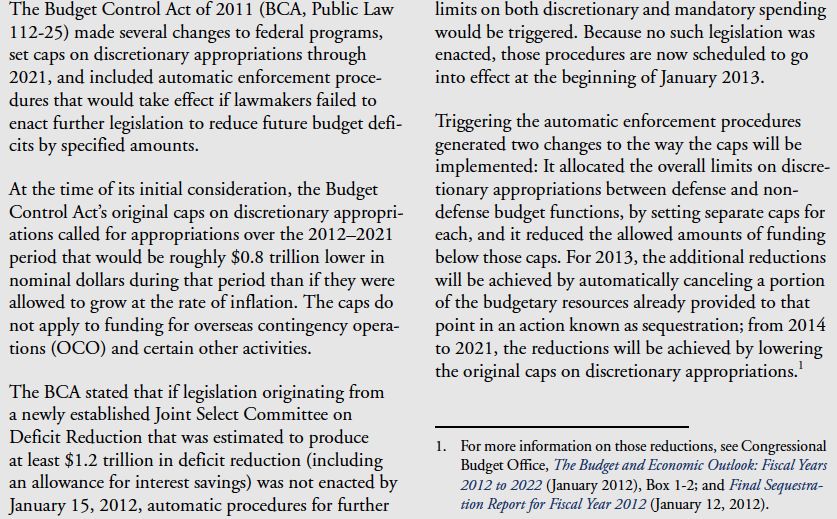
Tying Security Strategy to the US Role in the Global
                      Economy
• The US may not face peer threats in the near to mid term, but it faces a wide variety of lesser
  threats that make maintaining effective military forces, foreign aid, and other national security
  programs a vital national security interest.
• The US does need to reshape its national security planning and strategy to do a far better job of
  allocating resources to meet these threats. It needs to abandon theoretical and conceptual exercises
  in strategy that do not focus on detailed force plans, manpower plans, procurement plans, and
  budgets; and use its resources more wisely.
• The US still dominates world military spending, but it must recognize that maintaining the US
  economy is a vital national security interest in a world where the growth and development of other
  nations and regions means that the relative share the US has in the global economy will decline
  steadily over time, even under the best circumstances.
• At the same time, US dependence on the security and stability of the global economy will continue
  to grow indefinitely in the future. Talk of any form of “independence,” including freedom from energy
  imports, is a dangerous myth. The US cannot maintain and grow its economy without strong military
  forces and effective diplomatic and aid efforts.
• US military and national security spending already places a far lower burden on the US economy
  than during the peaceful periods of the Cold War, and existing spending plans will lower that burden
  in the future. National security spending is now averaging between 4% and 5% of the GDP -- in spite
  of the fact the US has been fighting two wars in Iraq and Afghanistan -- versus 6-7% during the Cold
  War.

                                                                                                          2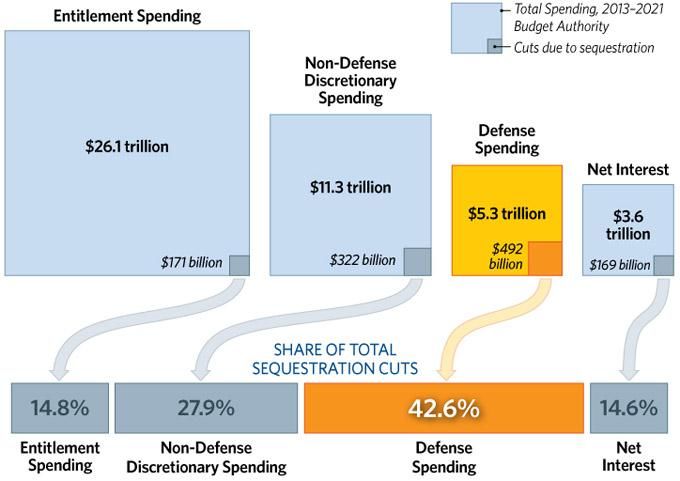
The Strains of War: Ten Years of DoD “Topline” Budget
       Outlays in $US Billions in Current and Constant Dollars
    These dollars include all enacted war and supplemental funding

                  Wartime spending peaked in FY2010. It was 2.3 times
                  (129%) higher in current dollars than in FY2001 (the
                   last pre 9/11 budget ) and 1.8 times (77%) higher in
                                    constant dollars

             FY2000 FY2001 FY2002 FY2003 FY2004 FY2005 FY2006 FY2007 FY2008 FY2009 FY2010 FY 2011 FY2012

   Current    281.2    291.0    332.1    387.3   436.5   474.2   499.3   529.1   594.6   636.3   666.7   678.0   688.2

   Constant 397.2     398.6    442.6    505.3    550.2   572.4   582.7   600.1   651.3   686.5   705.3   702.2   699.1

Source: DoD FY2013 Green Book, pp. 166-168
                                                                                                                   3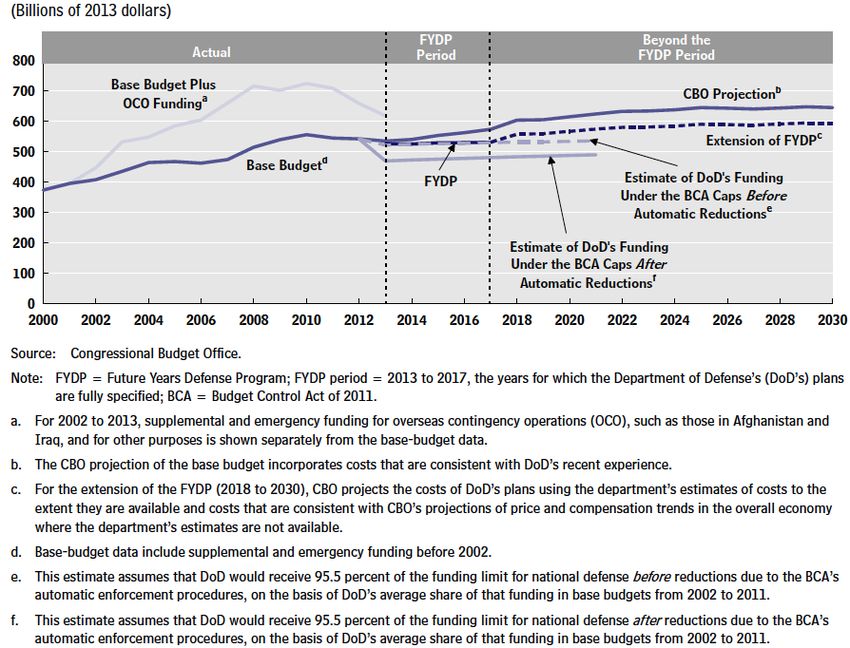
But, Ten Years of War Have Placed a Limited Burden on the
      National Economy, and One Consistently Lower than in the
                Last Years of “Peace” in the Cold War
       National Defense Totaled 5.2% to 6.2% of the US GDP from FY1980-FY1089; It had
       shrunk to a Post-WWII low of 3% in FY200 and FY2001. By comparison, it peaked
                    at 37.8% in WWII, 14.2% in Korea, and 9.4% in Vietnam.

Source: DoD FY2013 Green Book, pp. 264-265
                                                                                        4
The Realities that Should Shape US Strategy and US
 Military Forces for FY2013 and the Next Decade
Concepts are not a strategy. Broad outlines do not set real priorities. A strategy requires a plan with concrete goals
numbers schedules and costs for procurement, allocation, manpower, force structure, and detailed operational
capabilities.
For all the talk of 10 years of planned spending levels and cuts, the President and Congress can only shape the
actual budget and defense program one year at a time. Unpredicted events and realities will intervene. There is a
near zero real world probability that the coming plan and budget will shape the future in spite of changes in the
economy, politics, entitlements, and threats to the US.
Strategy will, however, be driven as much by changes in the national economy, national resource and cost
constraints, and entitlements pressures, as by threats.
Real world forces and mission capabilities will be budget and cost driven-barring unexpected existential threat.
The command and JCS must develop resource-constrained joint plans and budgets.
New threats, strategies, and tactics – cyberwarfare, space, cost-oriented asymmetric warfare -- will pose a
growing challenge putting constant additional new pressures on force plans and resources.
But, the global emergence of new economic powers and economic competition will be as important as military
threats.
A valid national strategy must increasingly consider the actions of potential allies and threats, global economic
changes, domestic spending needs, foreign policy and aid, homeland defense,
Non-traditional alliances and relations will continue to become steadily more important.
The military aspects of strategic choices should be joint choices made by major mission and command. The
services should not be strategic planners, only enablers. Interservice rivalry will be self-destructive.
The quality of execution and cost control is critical, and must have top down Secretarial and Service Chief
responsibility.

                                                                                                                         5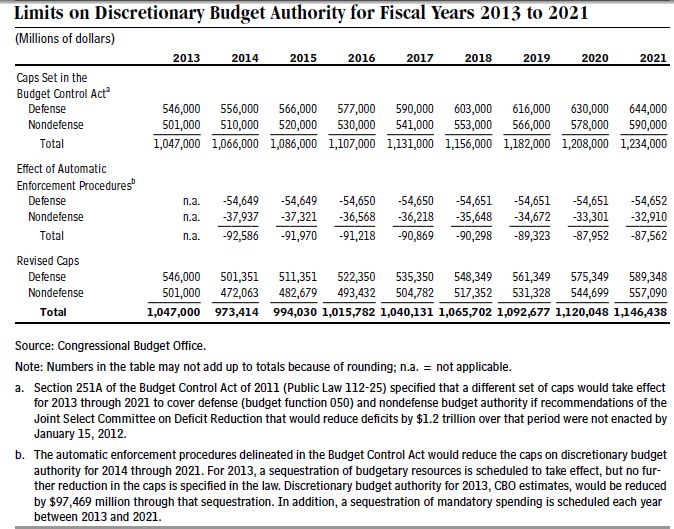
Living with a Continuing Crisis
   over Entitlements, Taxes,
   deficits, and Pressures on
  Discretionary and Defense
            Spending

                                  6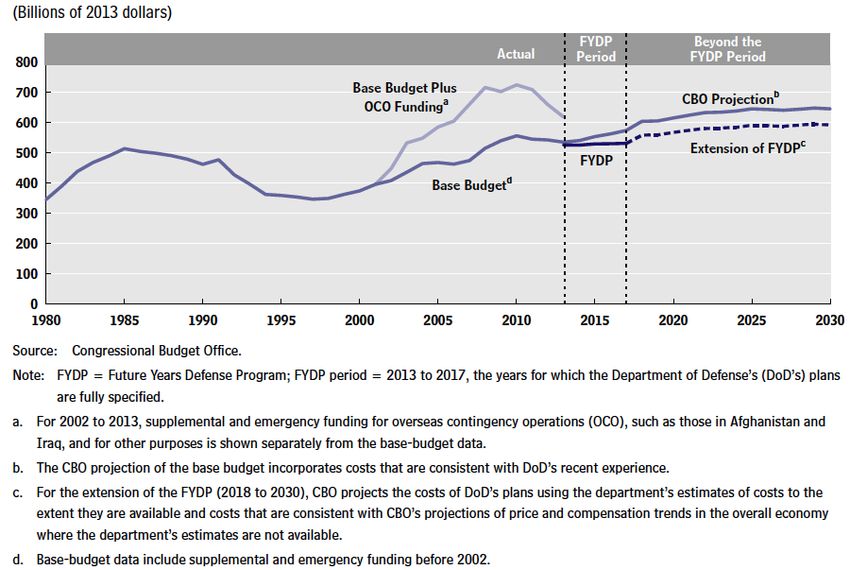
Recession, War Costs, and Burden of US Public Spending
are Limited Compared to Other Major Democracies, But
     Too High for American Politics and Tax Levels

Sources: OECD. The Economist, March 31-April 6, 2012, p. 31 .
                                                                7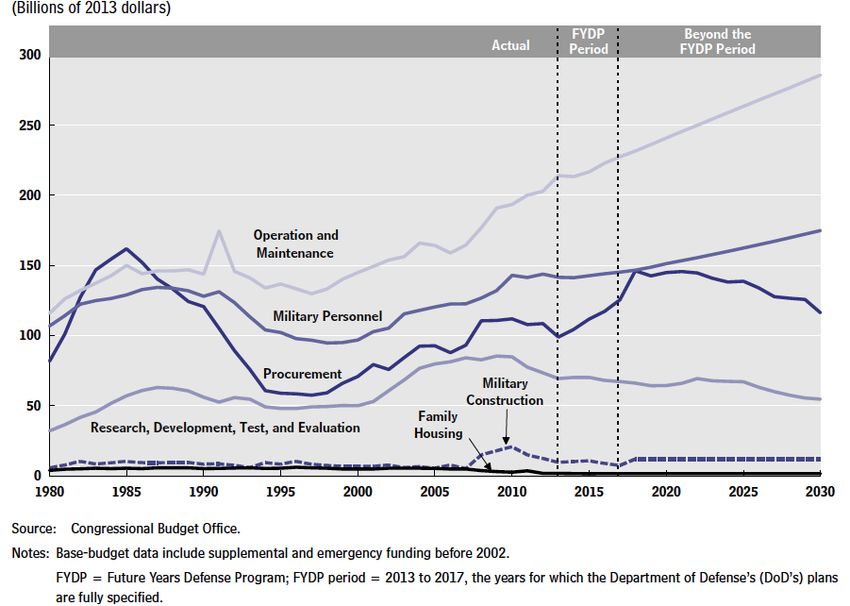
CBO Estimates That There Will Be a Critical Rise in Deficit
       Without a Massive Increase in Taxes and Cut in Entitlements

Source: CBO, An Analysis of the President’s 2013 Budget, March 2012, p. 5
                                                                            8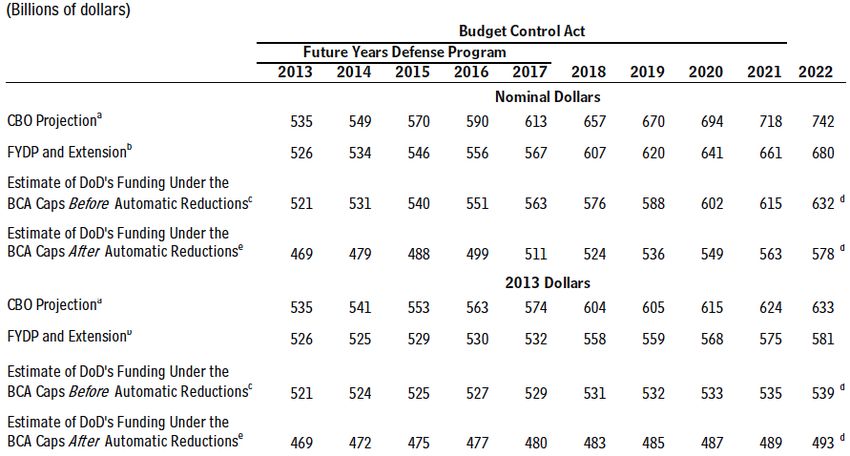
Federal Spending in FY2011 (Latest Year with Hard Data) :
   Revenues vs. Mandatory and Discretionary Spending

                 % of GDP

                                                        Source:
                                                         CBO,
                                                         2012

                                                            9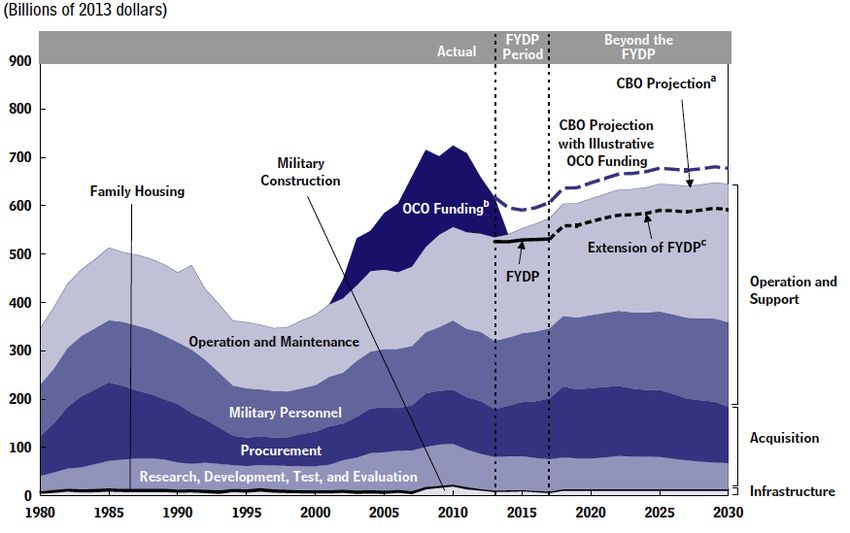
Where Federal Spending Actually Goes: Discretionary Spending

                  % of GDP

                                                         Source:
                                                          CBO,
                                                          2012

                                                           10
Where Federal Spending Actually Goes: Mandatory
(Entitlements) Spending
-Graph reflects data from OMB.
Source: CBO, 2012 11CBO Estimate of 10 Year’s More Deficit Spending, Driven by
Entitlements, Even with Defense Cuts if No Sequestration
Source: CBO, An Analysis of the President’s 2013 Budget, March 2012, p. 3
12Entitlements, Not Defense, Drive the Federal Budget
Its Burden on the National Economy
-Graph reflects data from OMB.
13CBO Estimate of Long Term Impact of Deficit Spending Through
2037 With & Without Tax Rises & Spending Cuts
Source: CBO, June 2012,
14CBO Estimate of Deficit as % of GDP Without Tax Rises &
Spending Cuts
Source: CBO, June 2012,
15OMB Estimates Entitlement Budget Authority Rises From
204% of National Security Costs in FY2012 ($1,570.7B vs.
$738.0B) to 351% in FY2017 ($1,850B vs. $649.5B)
Source: DoD FY2013 Green Book, p. 12
16Even with Unrealistic Tax Rises, Entitlements Costs Could
Cripple Federal Discretionary Spending : CBO 3/2012
Much of the projected decline in the deficit only occurs because, under current law, revenues will rise considerably as a
share of GDP—from 15.8 percent in 2012 to 19.8 percent in 2014 and 21.2 percent in 2022. In particular, in CBO’s
baseline, revenues shoot up by more than 30 percent over the next two years, mostly because of the recent or scheduled
expirations of tax provisions—such as those that reduce income and payroll tax rates and limit the reach of the alternative
minimum tax (AMT)—and the imposition of new taxes, fees, and penalties that are scheduled to go into effect. Under that
alternative fiscal scenario, deficits over the 2013–2022 period would be much higher, averaging 5.3 percent of GDP rather
than the 1.4 percent reflected in CBO’s baseline projections. Instead of declining to 61 percent of GDP, debt held by the
public would climb to 93 percent in 2022, the highest percentage since just after World War II
Source: CBO, Updated Budget Projections: Fiscal Years 2012 to 2022, pp. 1-3, http://www.cbo.gov/publication/43119
17Our Greatest “Threat” is not Foreign, it is is Managing
Entitlements and the Social Forces that
Drive the Rise in Their Cost
• Mandatory or “entitlement” outlays will increase by 5.1 percent in 2011 and by an average of
4.4 percent annually between 2012 and 2020, compared with an average growth rate of 6.4 percent
between 1999 and 2008.
• They will average 12.3% to 13.3% of the GDP during FY2012 to FY2020.
• Defense spending will average only 3.3% to 4.3%, dropping from a peak war year level of 4.7% in
FY2010.
• All other discretionary federal spending will equal 4.1% to 3.1% of the GDP.*
• The defense share of federal spending is so low a percentage of total federal spending, the GDP,
and rising entitlements costs that no feasible amount of cuts in US national security spending can
have a major impact on the US deficit and debt problems..
• The most serious single threat the US faces to its national security does not come from foreign
threats, but from the pressures on defense spending created by these domestic social and
economic trends, and the rising cost US federal entitlements spending.
• These rises in total spending are driven two critical factors that cannot be addressed simply by
altering the federal budget.
• Cost of mandatory retirement and spending on the aging
• Medical costs that extend far beyond government spending
* CBO, http://www.cbo.gov/ftpdocs/108xx/doc10871/Chapter3.shtml.)
18An Aging Population Threatens National Security by Lacking
Pensions and Savings
• In 1940, the life expectancy of a 65-year-old was almost 14 years; today it's almost 20
years. By 2036, there will be almost twice as many older Americans as today -- from
41.9 million today to 78.1 million.
• There are currently 2.9 workers for each Social Security beneficiary. By 2036, there
will be 2.1 workers for each beneficiary. At the end of 2011, roughly 50% of the present
US workforce had no private pension coverage, and 31% of the workforce has no
savings set aside specifically for retirement.
• In 2011, 54% of retired married couples and 73% of unmarried persons – some 35
million Americans or 69% of those receiving benefits -- received 50% or more of their
income from Social Security; and 22% of married couples.
• About 43% of unmarried persons receiving benefits relied on Social Security for 90%
or more of their income.
• . Another 9% of Americans over 65 had no retirement savings and did not receive
Social Security benefits.
• In addition, 8.4 million disabled Americans and 2 million of their dependents (19% of
total benefits) depended on Social Security, plus 6.3 million survivors of deceased
workers (12% of total benefits). (Social Security Administration)
19The Rise in National Medical Costs is the Greatest
Single “Threat” to National Security
• Entire pattern of federal spending will be driven by the rising cost of Medicare, Medicaid (and potentially
national medical care under the Affordable care Act as of 2014).
• These costs, however, are driven in turn massive rises in the national cost of medical care from around
6% of the GDP to well over 20% -- they rose 5.73% in 2011.
• Expenditures in the United States on health care surpassed $2.3 trillion in 2008, more than three times
the $714 billion spent in 1990, and over eight times the $253 billion spent in 1980. Without major
changes in cost, they will equal some 25% of the GDP in 2025.
• They are costs which roughly one quarter of Americans have no insurance, and many only partial
insurance coverage. Even so, the average health insurance premium for family coverage has more than
doubled over the past decade to $13,770 a year.
• Some 45.1% of the workforce from ages 18 to 64 had no coverage as of September 2011, and many
retirees lacked the savings to pay for any additional payments above Medicare. These figures did no
include Americans who had not worked in the last 12 months, and coverage had dropped substantially
since 2008. If one includes self-financed medical insurance, some 50 million Americans or 16.% of the
population had no coverage in 2010.
• In 2010, 31% of Americans relied on the government for health insurance, up from 24.2% in 1999. a total
of 9.8% of children under age 18 are uninsured despite the government programs. (US Census Bureau,
Kaiser Family Foundation, CNN Money)
20CBO Estimate of Rise in Federal Social Security and
Medical Costs: 2000-2037 (% of GDP)
Medical Costs Social Security Costs
CBO, Long-Term Budget Outlook, June 2012, pp. 58 & 64. these are baseline projections. Rises without tax hikes will be much higher
21The Impact of the Budget
Control Act and Sequestration
22CBO Summary of Impact of Budget Control Act CBO,. Long-Term Implications of the 2013 Future Years Defense Program, July 2012 , http://www.cbo.gov/sites/default/files/cbofiles/attachments/07-11-12-FYDP_forPosting.pdf, p. 7 23
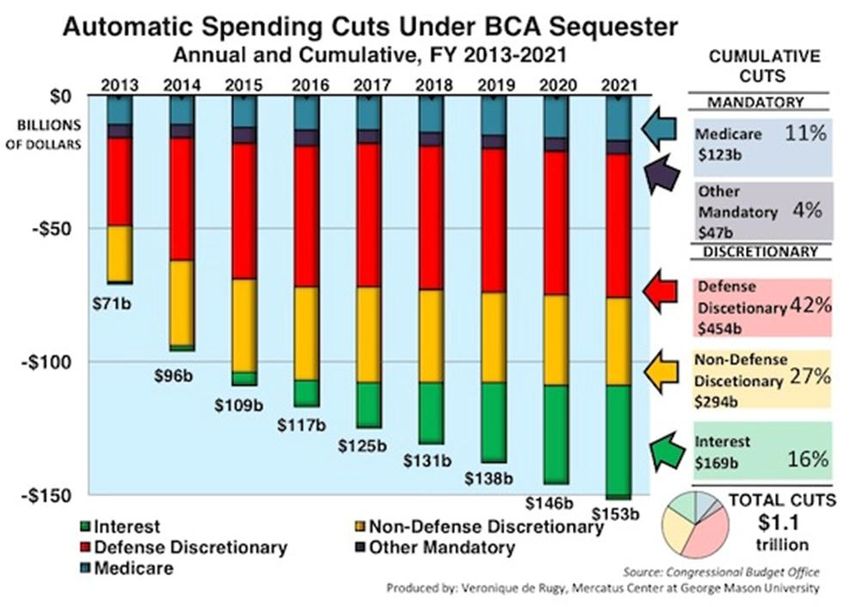
CBO Estimate of Impact of Budget Control Act and
                                Sequestration
 CBO estimates that, if no legislation originating from the deficit reduction committee was enacted, the
 automatic enforcement process specified in the Budget Control Act would produce the following results
 between 2013 and 2021:
 • Reductions ranging from 10.0 percent (in 2013) to 8.5 percent (in 2021) in the caps on new
   discretionary appropriations for defense programs, yielding total outlay savings of $454 billion.
 • Reductions ranging from 7.8 percent (in 2013) to 5.5 percent (in 2021) in the caps on new discretionary
   appropriations for nondefense programs, resulting in outlay savings of $294 billion.
 • Reductions ranging from 10.0 percent (in 2013) to 8.5 percent (in 2021) in mandatory budgetary
   resources for nonexempt defense programs, generating savings of about $0.1 billion.
 • Reductions of 2.0 percent each year in most Medicare spending because of the application of a special
   rule that applies to that program, producing savings of $123 billion, and reductions ranging from 7.8
   percent (in 2013) to 5.5 percent (in 2021) in mandatory budgetary resources for other nonexempt
   nondefense programs and activities, yielding savings of $47 billion. Thus, savings in nondefense
   mandatory spending would total $170 billion.
 • About $31 billion in outlays stemming from the reductions in premiums for Part B of Medicare and
   other changes in spending that would result from the sequestration actions.
 • An estimated reduction of $169 billion in debt-service costs.
 In all, those automatic cuts would produce net budgetary savings of about $1.1 trillion over the 2013–
 2021 period, CBO estimates.

 That amount is lower than the $1.2 trillion figure for deficit reduction in the Budget Control Act for three reasons. First, because of the lag in
 timing between appropriations and subsequent expenditures, part of the savings from the automatic cuts in budgetary resources would occur after
 2021. Second, CBO expects that some reductions—particularly those related to Medicare—would have other effects that would boost net spending
 (by the $31 billion mentioned above). Third, CBO estimates that the reduction in debt-service costs would be lower than the amount of such
 savings stipulated in the Budget Control Act
Note: CBO Estimate was made before FY2013 budget submission. Source CBO, Estimated Impact of Automatic Budget Enforcement Procedures Specified in the Budget
Control Act September 12, 2011                                                                                                                                 24
How the BCA and Sequestration Would Be Applied
Section 302 of the Budget Control Act specifies procedures that, if triggered, would result in automatic cuts in mandatory and
discretionary spending beginning in 2013. The law requires that any necessary automatic reductions be calculated as follows:
1. The deficit reduction amount of $1.2 trillion for the 2012–2021 period would be reduced to account for any estimated
savings stemming from legislation originated by the deficit reduction committee and enacted before January 15, 2012.
2. To determine the amount of the reductions in spending for the government’s programs and activities that would be
necessary to achieve the required savings, the act stipulates that 18 percent of the savings should be assumed to come from
decreases in debt-service costs. Thus, if the required savings were the entire $1.2 trillion, $216 billion would be assumed
to come from reduced debt-service costs, leaving $984 billion to come from reductions in budgetary resources through
2021.
3. That adjusted target would be divided evenly over the nine years from 2013 to 2021, requiring a reduction of about
$109 billion per year to produce a nine-year total of $984 billion.
4. That annual total would be allocated equally between defense spending (accounts in budget function 050, most—but
not all—of which finance activities of the Department of Defense) and nondefense spending (all other budget functions)
Thus, reductions of roughly $55 billion per year would be required in each of those two broad spending categories if no
savings resulted from legislation originated by the deficit reduction committee.
5. Within the defense and nondefense categories, the required reductions would be allocated proportionally between
discretionary and mandatory spending, according to various rules.
Each year, OMB would determine the proportional allocations of required cuts in budgetary resources for mandatory and
discretionary programs in both the defense and nondefense categories. The President would order any necessary sequestrations
for mandatory programs and activities or reductions in discretionary spending caps in order to achieve the required reductions.
For discretionary spending, reductions in 2013 would be executed by canceling new budget authority made available in that
year (that cut would take the form of a sequestration of existing appropriations because it would occur in January 2013, well after
the start of the fiscal year). Reductions in discretionary spending from 2014 to 2021 would be achieved by reducing the
caps on such spending for each year, pursuant to the procedures specified in the Budget Control Act.8 For mandatory spending,
reductions in all years would be achieved through sequestrations.
. Source CBO, Estimated Impact of Automatic Budget Enforcement Procedures Specified in the Budget Control Act September 12, 2011
25Defense Will Bear the Largest Share of the BCA
Sequestrations, But Think Tank Estimates Differ
Defense will see the largest share of spending cuts under the Budget Control Act of 2011’s
automatic cuts. While entitlement spending is responsible for the largest share of federal
government expenditures, discretionary cuts significantly outweigh entitlement cuts under
this legislation.
-Nominal Dollars, data from CBO, compiled by Heritage Foundation -Graphic from National Review Online, http://www.nationalreview.com/corner/281604/more-
supercommittee-sequester-veronique-de-rugy
26CBO Summary of Impact of Budget Control Act
on Defense Budget
• Defense appropriations are defined as appropriations for budget function 050 (national defense), which
includes the military activities of the Department of Defense (DoD), the nuclear weapons activities of the
Department of Energy and the National Nuclear Security Administration, and the national security
activities of several other agencies. On average during the past 10 years, funding for DoD has represented
95.5 percent of total funding for budget function 050.
• Under the allocation of the BCA’s caps on discretionary appropriations stemming from the automatic
enforcement procedures—but before the reductions in the caps due to those procedures—funding for
national defense during the 2013–2021 period would be about $80 billion less than what would have been
provided if appropriations increased with inflation starting from the amount appropriated in 2012.
• The automatic reductions will lower the caps on discretionary funding for national defense by an additional
$492 billion over the 2013–2021 period, with the reduction spread evenly at nearly $55 billion per year. The
resulting caps start at $491 billion in 2013 and rise to $589 billion in 2021; adjusted for inflation, the cap for
2021 is about 9 percent lower than the amount appropriated for 2012.
• If DoD was assessed the same share of the $55 billion per year in automatic reductions for national defense
as the department has received in funding historically, its budget authority would be reduced by about $52
billion each year.
• For 2013, sequestration will apply to both the base budget and funding for OCO, and the effect on the base
budget alone is unclear; the amounts discussed here are estimated as if the sequestration is applied entirely
to the base budget.
• Expressed in 2013 dollars, the average annual reduction from the caps on national defense funding would
be about $49 billion over the whole period, beginning with $52 billion in 2013 and ending with $45 billion in
2021.
CBO,. Long-Term Implications of the 2013 Future Years Defense Program, July 2012
, http://www.cbo.gov/sites/default/files/cbofiles/attachments/07-11-12-FYDP_forPosting.pdf, p. 9 27CBO Estimates Sequestration Impact Could Cripple Defense
Spending:Force $54.6 Billion a Year Cut in Budget Caps:
$2,598B Over Five Years and $4,878 Over Ten Years
Note: CBO Estimate was made before FY2013 budget submission. Source CBO, Estimated Impact of Automatic Budget Enforcement Procedures Specified in the Budget
Control Act September 12, 2011 28CBO Estimates of Sequestration Impact by Size of Cuts in
Discretionary Expenditures ($USB by FY)
Note: CBO Estimate was made before FY2013 budget submission. Source CBO, Estimated Impact of Automatic Budget Enforcement Procedures Specified in the Budget
Control Act September 12, 2011 29Financial Times Estimate of Economic Impact of
Sequestration
James Politi, US budget: Pushed to the brink, Financial Times, July 5, 2012 8:25 pm
30Strategy by Constraints on
Topline Defense Spending:
FY 2001-FY2017
No Matter What Rationale is Provided, Our Real-World
Strategy is Now Driven by Budget Limits
31Secretary Panetta on the Risks of Letting
Budget Limits Drive Strategy
• “The risks come with the fact that … we will have a smaller force…when you
have a smaller force, there are risks associated with that in terms of our
capability to respond. “We think we've dealt with those risks because the
combination of the forces we have in place and the ability, if we have to, to
mobilize quickly will give us the capability to deal with any threat.”
• “We’re depending a great deal on being at the technological edge of the
future…Can we develop the kind of technology we're going to need to confront
the future? I’m confident we can, but there are risks associated with that.”
• “The reality is that as we draw down from Iraq and Afghanistan, we still face a
number of very important threats in the world…Obviously we're continuing to
fight a war in Afghanistan, and we continue to face the threat of terrorism.”
• “We see the threats coming from Iran, and a nuclear-capable Iran represents a
threat to us and to the world…Weapons of mass destruction and proliferation of
weapons of mass destruction are a concern. North Korea is a concern because
they, too, are developing a nuclear capability.”
• You can see the vast array of threats that we have to confront with the force that
we've designed here…So it's all of those that are my concern for the future.”
Jim Garamone, Panetta, Dempsey Discuss Risks, Threats of the Future, American Forces Press Service, Washington, Jan. 26, 2012
–
32Chairman Dempsey on the Risks
• “The greater risk would be had we decided that we would just wish away any particular capability or any particular
form of conflict.. So, say, ‘no, … we're just never going to do that.’ What you're expressing here is the recognition that
we are retaining our full-spectrum capability, and that we didn't take any risk with that.”
• “At the same time, we put national security above parochial interest -- exactly what the American people should
expect of us.”
• “Capability is more important than size…We get leaner. But this budget does not lead to a military in decline. It leads
to a joint force that is global and networked, that is versatile and innovative, that is ably led and that is always ready.”
• That joint force “can win any conflict, anywhere,”
• There are no proposed pay freezes or reductions, and department officials will not change health care benefits for
active-duty troops, those with combat injuries or service members who have medically retired, he added. “But we
cannot – we cannot - ignore some hard realities...Pay and benefits are now roughly one-third of defense spending. …
pay will need to grow more slowly in the future.”
• “We’ll take the time to determine how to enact any retirement reforms over the next year.
• “It represents responsible investment in our national security…But make no mistake, the tradeoffs were tough. The
choices were complex.”
• “The primary risks lie not in what we can do, but in how much we can do and how fast we can do it,” he said. “The
risks, therefore, are in terms of time and capacity.”
• “I am convinced we can properly manage them by ensuring we keep the force in balance, investing in new
capabilities and preserving a strong reserve component...As I’ve said before, we will face greater risks if we do not
change the way we’ve been doing things.”
• “Much will be said and written about the individual decisions underlying this budget…Some may be tempted to view
them through the prism of a zero-sum game, parsing through each cut, each change, to look for a winner and a loser.
That is actually the least-productive way to assess this budget...I’m confident it meets our nation’s needs in our
current fights and for our future.”
Jim Garamone, Panetta, Dempsey Discuss Risks, Threats of the Future, American Forces Press Service, Washington, Jan. 26, 2012;
and Ken Parrish, Dempsey: Defense Budget Reflects Clear Strategic Choices, American Forces Press Service, Washington, Jan. 26,
2012.
33Topline By the Numbers
• $525 topline (Baseline) billion for FY2013, rising to $567 billion in FY217 in current
dollars. Down from $531 billion in FY2011.
• Wartime (OCO) account drops from $115 billion in FY2011 to $88.4 billion in FY2012.
• Conforms to 2011 Budget Control Act requirement to reduce future DoD
expenditures by $487 billion over next decade (a cut of nearly 9%), or $259 billion
over next five years.
• The new budget level for the Defense Department will rise from FY 2013 to FY 2017;
however, total U.S. defense spending, including both base funding and war costs, will
drop by about 22% from its peak in 2010, after accounting for inflation.
• By comparison, the 7 years following the Vietnam and Cold War peak budgets saw a
similar magnitude of decline on the order of 20 to 25%.
• Cuts are a continuation of the effort begun in 2010, which identified more than $150
billion in savings over five years allocated among the three military departments, the
defense agencies,
• combatant commands, and the Secretary’s staff. This left less room for additional
reductions to meet the new target of $259 billion over FY13‐17.
• Nonetheless, DoD found about $60 billion in new projected savings over FY13‐17.
34Different Estimates of Coming Cuts
Source: Adapted from DoD Factsheet issued by OSD (PA) on 26.1.12
35Cuts from FY2012 President’s Baseline Budget Request in
FY2013 Request: ($US in Current Billions)
Source: Adapted from DoD Factsheet issued by OSD (PA) on 26.1.12
36How Much Should Be Enough? Still Roughly 4% of GDP in
FY2001-FY2017:
Source: DoD FY2013 Budget Summary
37FY2013-FY2017 Budget Remains High If Exclude Wartime
Spending
($US in Current or “Nominal” Billions)
Source: Adapted from DoD Factsheet issued by OSD (PA) on 26.1.12
38Baseline Cuts Are Minimal Even in Constant Dollars
($US in Current vs. Constant Billions)
Source: Adapted from DoD Factsheet issued by OSD (PA) on 26.1.12
39BUT, Once Again, Sequestration Could Cripple Defense Spending: Force $54.6 Billion a Year Cut in Budget Caps: $2,598B Over Five Years and $4,878 Over Ten Years Note: CBO Estimate was made before FY2013 budget submission 40
The Myth of Efficiency: “More Disciplined Use of
             Resources” = DoD Wide Cuts Worth $30.8 Billion in
                             FY2013-FY2017
•   Civilian Pay Raises ($10.4 billion). The civilian pay increase for FY 2013 was limited to 0.5
    percent.
•   Defense Agency/Office of the Secretary of Defense ($10.7 billion). Initiatives include reducing
    overhead, staffing, and expenses; more efficient contracting and acquisition; and more.
•   Better Buying Power ($5.3 billion). obtain greater efficiency and productivity in defense
    spending by improving the way the Department acquires critical defense goods and services.
•   Ensure Compliance with the Executive Order on Promoting Efficient Spending ($0.5 billion).
    Reductions were made to travel, printing and reproduction by leveraging technology to
    teleconference and provide information in electronic form.
•   Reduce Combatant Command Support Costs ($1.5 billion). Initiatives include reducing
    overhead and support costs.
•   Reduce Defense Working Capital Fund Rates ($1.1 billion). Reduce rates for supplies and
    printing provided by the Defense Logistics Agency, financial services provided by the DoD
•   Finance and Account Service, and Pentagon space as a result of cost reductions.
•   Delay and restructure various facility projects ($0.6 billion)

      Department of Defense, Overview - FY2013 Defense Budget                                         41
“More Disciplined Use of Resources”
Budget Cuts by Service: FY2013-FY2017 -- $30.8 Billion
Department of Defense, Overview - FY2013 Defense Budget 42$60B More in “Projected Savings Through Efficiency, More
Disciplined Use of Dollars”
• Continuation of the effort begun in 2010, which identified more than $150 billion in savings
over five years allocated among the three military departments, the defense agencies
,combatant commands, and the Secretary’s staff. This left less room for additional
reductions to meet the new target of $259 billion over FY13‐17.
• Nonetheless, did find about $60 billion in new projected savings over FY13‐17.
• Examples include:
• More skillful contracting practices to increase competition, reduce costs, and
• increase buying power
• Better use of information technology
• Better use of business and enterprise systems
• Streamlined staff
• Limitations on official travel
• Better inventory management
• Reductions in contract services
• Deferral of some military construction to align our facilities more closely with the
• size and posture of our future force
• Reductions in planned civilian pay raises.
• “Beyond the roughly $60 billion in efficiencies and overhead savings, eliminated a number
of poorly performing programs” described earlier.
43Senate Markups to the FY 2013 Defense Budget
The Senate Committee on Armed Services passed a $631.4 billion budget on May 24, which included
approximately 150 amendments. Analysis of the draft bill is limited as of yet, but according to one observer, the
draft bill includes:
• Restricting assistance to the Pakistani military while Pakistan continues to prohibit the movement of
supplies to Afghanistan;
• Eliminating many of the funding decreases planned for the Air National Guard;
• Sustaining M1 Abrams production;
• Eliminating higher TRICARE fees;
• Cutting the number of civilians within DOD by 5% within 5 years.
Source: Jeremy Herb, “Senate Panel Moves $631B Defense Bill.” DEFCON Hill:
The HILL’s Defense Blog. May 24, 2012. http://thehill.com/blogs/defcon-hill/budget-
approriations/229433-senate-panel-passes-631b-defense-bill
Amendments offered by the Armed Services Committee’s Subcommittee on Readiness and Management
Support, the only subcommittee to hold a markup session open to the public, include:
• Eliminating approximately $500 million from O&M and over $600 million from military construction;
• Increasing funding for the DOD Inspector General ($59 million increase) and the DOD Corrosion Control
Initiative ($21 million increase);
• Improving contracting to enhance the accountability of contractors and the efficiency of programs;
• Proposing that a risk assessment be conducted prior to cutting a key Marine Corps squadron;
• Improving efficiency in supplying the mission in Afghanistan through the Northern Supply Route;
• Eliminating base realignments and closures (BRACs) for FY 2013.
Source: US Senate, Subcommittee on Readiness and Management Support, Committee on Armed Services, “Hearing to Mark Up the Readiness and management
Support Programs Contained in the National Defense Authorization Act for Fiscal Year 2013.,” May 22, 2012. http://armed-
services.senate.gov/Transcripts/2012/05%20May/12-39%20-%205-22-12.pdf
44As the FY2013 Defense Budget Goes Through The Legislature,
Congressionally-Driven Spending Could Cause Friction With
the Obama Administration
The House of Representatives recently passed a defense budget worth $642 billion, including billions more than what
was proposed by the President. It is reported by the Washington Post that the President may veto the budget. Key issues
include:
• The House does not support the closing of bases in the US in FY 2013;
• Representatives have stipulated that US troops would remain in Afghanistan until 2014 with a combat force 68,000
strong. An accelerated withdrawal amendment failed in the House;
• An additional $100 million was included for a missile defense shield on the US East Coast.
Sources: AP, “Disputed Issues in the House Defense Budget,” The Washington Post, May 18, 2012. http://www.washingtonpost.com/national/disputed-issues-in-the-
house-defense-budget/2012/05/18/gIQAvzUqXU_story.html
Key political issues in the budget going forward:
• BASE CLOSURES: Both the House and the Senate are seemingly in agreement with regards to closing bases in the
US. The decisions against the closings on both sides appear to be driven by the costliness of past closings;
• BUDGET INCREASES: The House bill and Senate draft bill call for spending in excess of what is permitted under the
Budget Control Act of 2011. In fact, the House has approved a budget that adds several billion dollars to the Obama
Administration’s planned expenditures. Significantly more expenditures than planned by the administration raises the
prospect of a presidential veto;
• MISSILE DEFENSE: A key point of disagreement in reconciling the bills will be the missile defense shield on the US
East Coast, which is supported by the House but not the Senate. In terms of overseas defenses, both the House and
the Senate are in agreement on strengthening missile defense in Israel;
• INDEFINITE DETENTION: Both the House bill and the draft bill that left the Senate Committee on Armed Services do
not alter the section of the defense budget that allows for indefinite detention, although it is reported that Senator Udall
will propose an amendment for the Senate floor when the bill is debated in June or July.
Sources: AP, “Disputed Issues in the House Defense Budget,” The Washington Post, May 18, 2012. http://www.washingtonpost.com/national/disputed-issues-in-the-
house-defense-budget/2012/05/18/gIQAvzUqXU_story.html and US Senate, Subcommittee on Readiness and Management Support, Committee on Armed Services,
“Hearing to Mark Up the Readiness and management Support Programs Contained in the National Defense Authorization Act for Fiscal Year 2013.,” May 22, 2012.
http://armed-services.senate.gov/Transcripts/2012/05%20May/12-39%20-%205-22-12.pdf and Jeremy Herb, “Senate Panel Moves $631B Defense Bill.” DEFCON
Hill: The HILL’s Defense Blog. May 24, 2012. http://thehill.com/blogs/defcon-hill/budget-approriations/229433-senate-panel-passes-631b-defense-bill
45The Impact of Sequestration on Defense and National Security
“…every dollar the United States spends on old and unnecessary programs is a dollar we loose
from new, necessary strategic investments…Sequester was designed to be irrational…a
sequester would have devastating effects on our readiness and our workforce and disrupt
thousands of contracts and programs.” –Deputy Defense Secretary Ashton Carter, May 30,
2012.
• It was recently determined that sequestrations could have a direct impact on war fighting.
While initially thought that overseas contingency operations (OCO) would be insulated from
sequestration, a DOD statement from May 2012 indicates that OCO funds are in fact
vulnerable to scale-backs.
• While DOD has sought cost-saving measures such as boosting TRICARE premiums and
closing bases through BRACs, Congress has opposed these measures. Congressional
resistance to DOD efforts to conserve resources threatens the department’s ability to adapt
to the constraints of fiscal austerity.
Sources: Quote from US Department of Defense, “Deputy Secretary of Defense Carter Speech to the American Enterprise Institute Washington, DC,” News
Transcript, May 30, 2012. http://www.defense.gov/transcripts/transcript.aspx?transcriptid=5044; Other sources Roxana Tiron, “War Funds Face Automatic Cuts In
January, Pentagon Says,” Bloomberg News, May 30, 2012. and Charles S. Clark, “Pentagon’s No. 2 Leader Criticizes Lawmakers’ Add-Backs To Defense Bill,”
GovExec.com, May 30, 2012.
46Department of Defense Still
Cannot Control Its Costs or
Accurately Plan Future
Spending – With and Without
the impact of the BCA
– But it will still place a lower
burden on the economy in
“worst case”
47The Self-Destructive Behavior of the Department
of Defense is also Part of the Threat
The Department of Defense needs to make a major new effort to deal with
its own, self-inflicted non-traditional threats.
• Lack of adequate cost control and realistic planning of future budgets
cited earlier.
• A quarter century of posturing (?), failed efforts to develop effective
procurement programs and cost controls.
• A fundamental breakdown in the ability to tie strategy to feasible,
affordable programs.
• Massive rises in the cost per solider on active duty.
48CBO Warning in July 2012 - I
• To execute its base-budget plans for 2013 through 2017, DoD would need five years of appropriations
totaling $53 billion (or 2.0 percent) more in real, or inflation-adjusted, terms than if funding for the base
budget was held at the 2012 amount of $543 billion
• For the entire projection period of 2013 through 2030, DoD’s base-budget plans would require
appropriations totaling $1.2 trillion (or 12 percent) more than if funding for the base budget was held at
the 2012 amount in real terms.
• To execute its base-budget plans for 2013, the department would require appropriations of $535 billion,
1.4 percent less than the $543 billion appropriated in 2012. That figure for 2013 is $9 billion higher than
DoD’s request because CBO includes the cost of all active-duty personnel (whereas the department
proposes to shift the cost of some of those personnel out of the base budget) and because CBO assumes
that the Congress will continue its history of rejecting DoD’s proposals to shift some health care costs to
the military beneficiaries receiving the care. To execute its base-budget plans after 2013, DoD’s
appropriations would need to nearly return to their 2012 level in 2014 and grow at an average annual
rate of 2.0 percent between then and 2017, all in real terms.
• From 2017 to 2030, DoD’s appropriations would need to grow at an average annual rate of 0.9 percent in
real terms. The cost of the department’s plans would rise to $574 billion in 2017 and to$645 billion in
2030 in real terms.
• The primary cause of growth in DoD’s costs from 2013 to 2030 would be rising costs for operation and
support (O&S), which accounts for 64 percent of the base budget in 2012. In particular, under DoD’s
plans, there would be significant increases in the costs of military health care, compensation of the
department’s military and civilian employees, and various operation and maintenance activities. O&S
costs would grow from $356 billion in 2013 to $460 billion in 2030, for an average annual growth rate of
1.5 percent per year, all in real terms.
CBO,. Long-Term Implications of the 2013 Future Years Defense Program, July 2012, http://www.cbo.gov/sites/default/files/cbofiles/attachments/07-11-12-
FYDP_forPosting.pdf
49CBO Warning in July 2012 - II
• The costs of replacing and modernizing weapon systems would grow sharply in the near term, from $168
billion in 2013 to $212 billion in 2018 in real terms—an increase of 26 percent. However, acquisition costs
would remain fairly steady at that level until 2025 before declining.
• The growth in DoD’s costs would be less than CBO’s projection of the growth of the
economy, so costs would decline as a share of gross domestic product product (GDP).
Spending for DoD’s base budget was 3.5 percent of GDP in 2010 and would decline to 3.0
percent of GDP in 2017 and to 2.5 percent in 2030.
CBO,. Long-Term Implications of the 2013 Future Years Defense Program, July 2012, http://www.cbo.gov/sites/default/files/cbofiles/attachments/07-11-12-
FYDP_forPosting.pdf
50CBO Projection of Real Cost of FY2013 Plan vs. DoD Projection
CBO,. Long-Term Implications of the 2013 Future Years Defense Program, July 2012
, http://www.cbo.gov/sites/default/files/cbofiles/attachments/07-11-12-FYDP_forPosting.pdf, pp. v, 6
51O&M Drives Cost Escalation In Spite of Escalation in
vi
Procurement
CBO,. Long-Term Implications of the 2013 Future Years Defense Program, July 2012
, http://www.cbo.gov/sites/default/files/cbofiles/attachments/07-11-12-FYDP_forPosting.pdf, p. 7 52CBO Projection is for Higher Gap if Real World Contingency
vi
Funding is Provided
CBO,. Long-Term Implications of the 2013 Future Years Defense Program, July 2012
, http://www.cbo.gov/sites/default/files/cbofiles/attachments/07-11-12-FYDP_forPosting.pdf, p. 5
53This Would Make the Impact of Budget Control Act
(Sequestration) Much Worse
CBO,. Long-Term Implications of the 2013 Future Years Defense Program, July 2012
, http://www.cbo.gov/sites/default/files/cbofiles/attachments/07-11-12-FYDP_forPosting.pdf, p. 10 54Zooming In On The Future: FY2013-F2030 CBO,. Long-Term Implications of the 2013 Future Years Defense Program, July 2012 , http://www.cbo.gov/sites/default/files/cbofiles/attachments/07-11-12-FYDP_forPosting.pdf, p. 10 55
Looking at the DoD/BCA Reality Gap by Year: FY2013-F2022:
       $14B in FY2013 without BCA; $66B with BCA

CBO,. Long-Term Implications of the 2013 Future Years Defense Program, July 2012
, http://www.cbo.gov/sites/default/files/cbofiles/attachments/07-11-12-FYDP_forPosting.pdf, p. 10   56
Yet, CBO Still Projects Burden on GDP
(and Federal Spending) With Still Shrink
CBO,. Long-Term Implications of the 2013 Future Years Defense Program, July 2012
, http://www.cbo.gov/sites/default/files/cbofiles/attachments/07-11-12-FYDP_forPosting.pdf, p. 12 57You can also read